CC-003 · Climate & Energy · Emissions & targets
Per-capita emissions vs 2030 projection
Misleading High confidence Draft: right of reply pending
Parts of this claim
The claim is split into parts that are tested separately, as in the report below. Each part has its own number.
- CC-003A Emissions per capita have fallen 44% since 2005 (CAA [1])Reproduced from Eurostat (−46% to 2023, −48% to 2024). Commission source.
- CC-003B …well above the EU average of 34% (CAA [1])Reproduced (−34% to 2023). True per person (3rd of 27 to 2024); not in total tonnes (−27% vs −33%; 20th of 27).
- CC-003C Emissions per unit of GDP down 81.6% vs EU 61.9% (CAA [1])Not recomputed (GDP series and price base not stated). Direction consistent with Commission data.
- CC-003D Malta is reducing emissions at household level (CAA [1])In total, sectors linked to households rose: transport +49%, buildings +9 to +12%, air-conditioning gases up almost six-fold. Per person, the target sectors were flat (2.50 t to 2.52 t, our estimate), not falling. A per-person ratio of all emissions is not a household measure.
- CC-003E Malta’s efforts are showing clear results (CAA [1])True for power generation. The same report shows Malta over its yearly limits since 2022 and projects the largest shortfall in the EU (in percentage points) against its binding 2030 target; the release mentions neither.
- CC-003F Malta aims to reduce emissions by 40% by 2030 (CAA [1])A stated aim, not a result. Scope (total or effort-sharing) not given. Same figure appears in the 2026 Labour manifesto (see CC-011).
Claim Check 003 · Statistics and EU reports
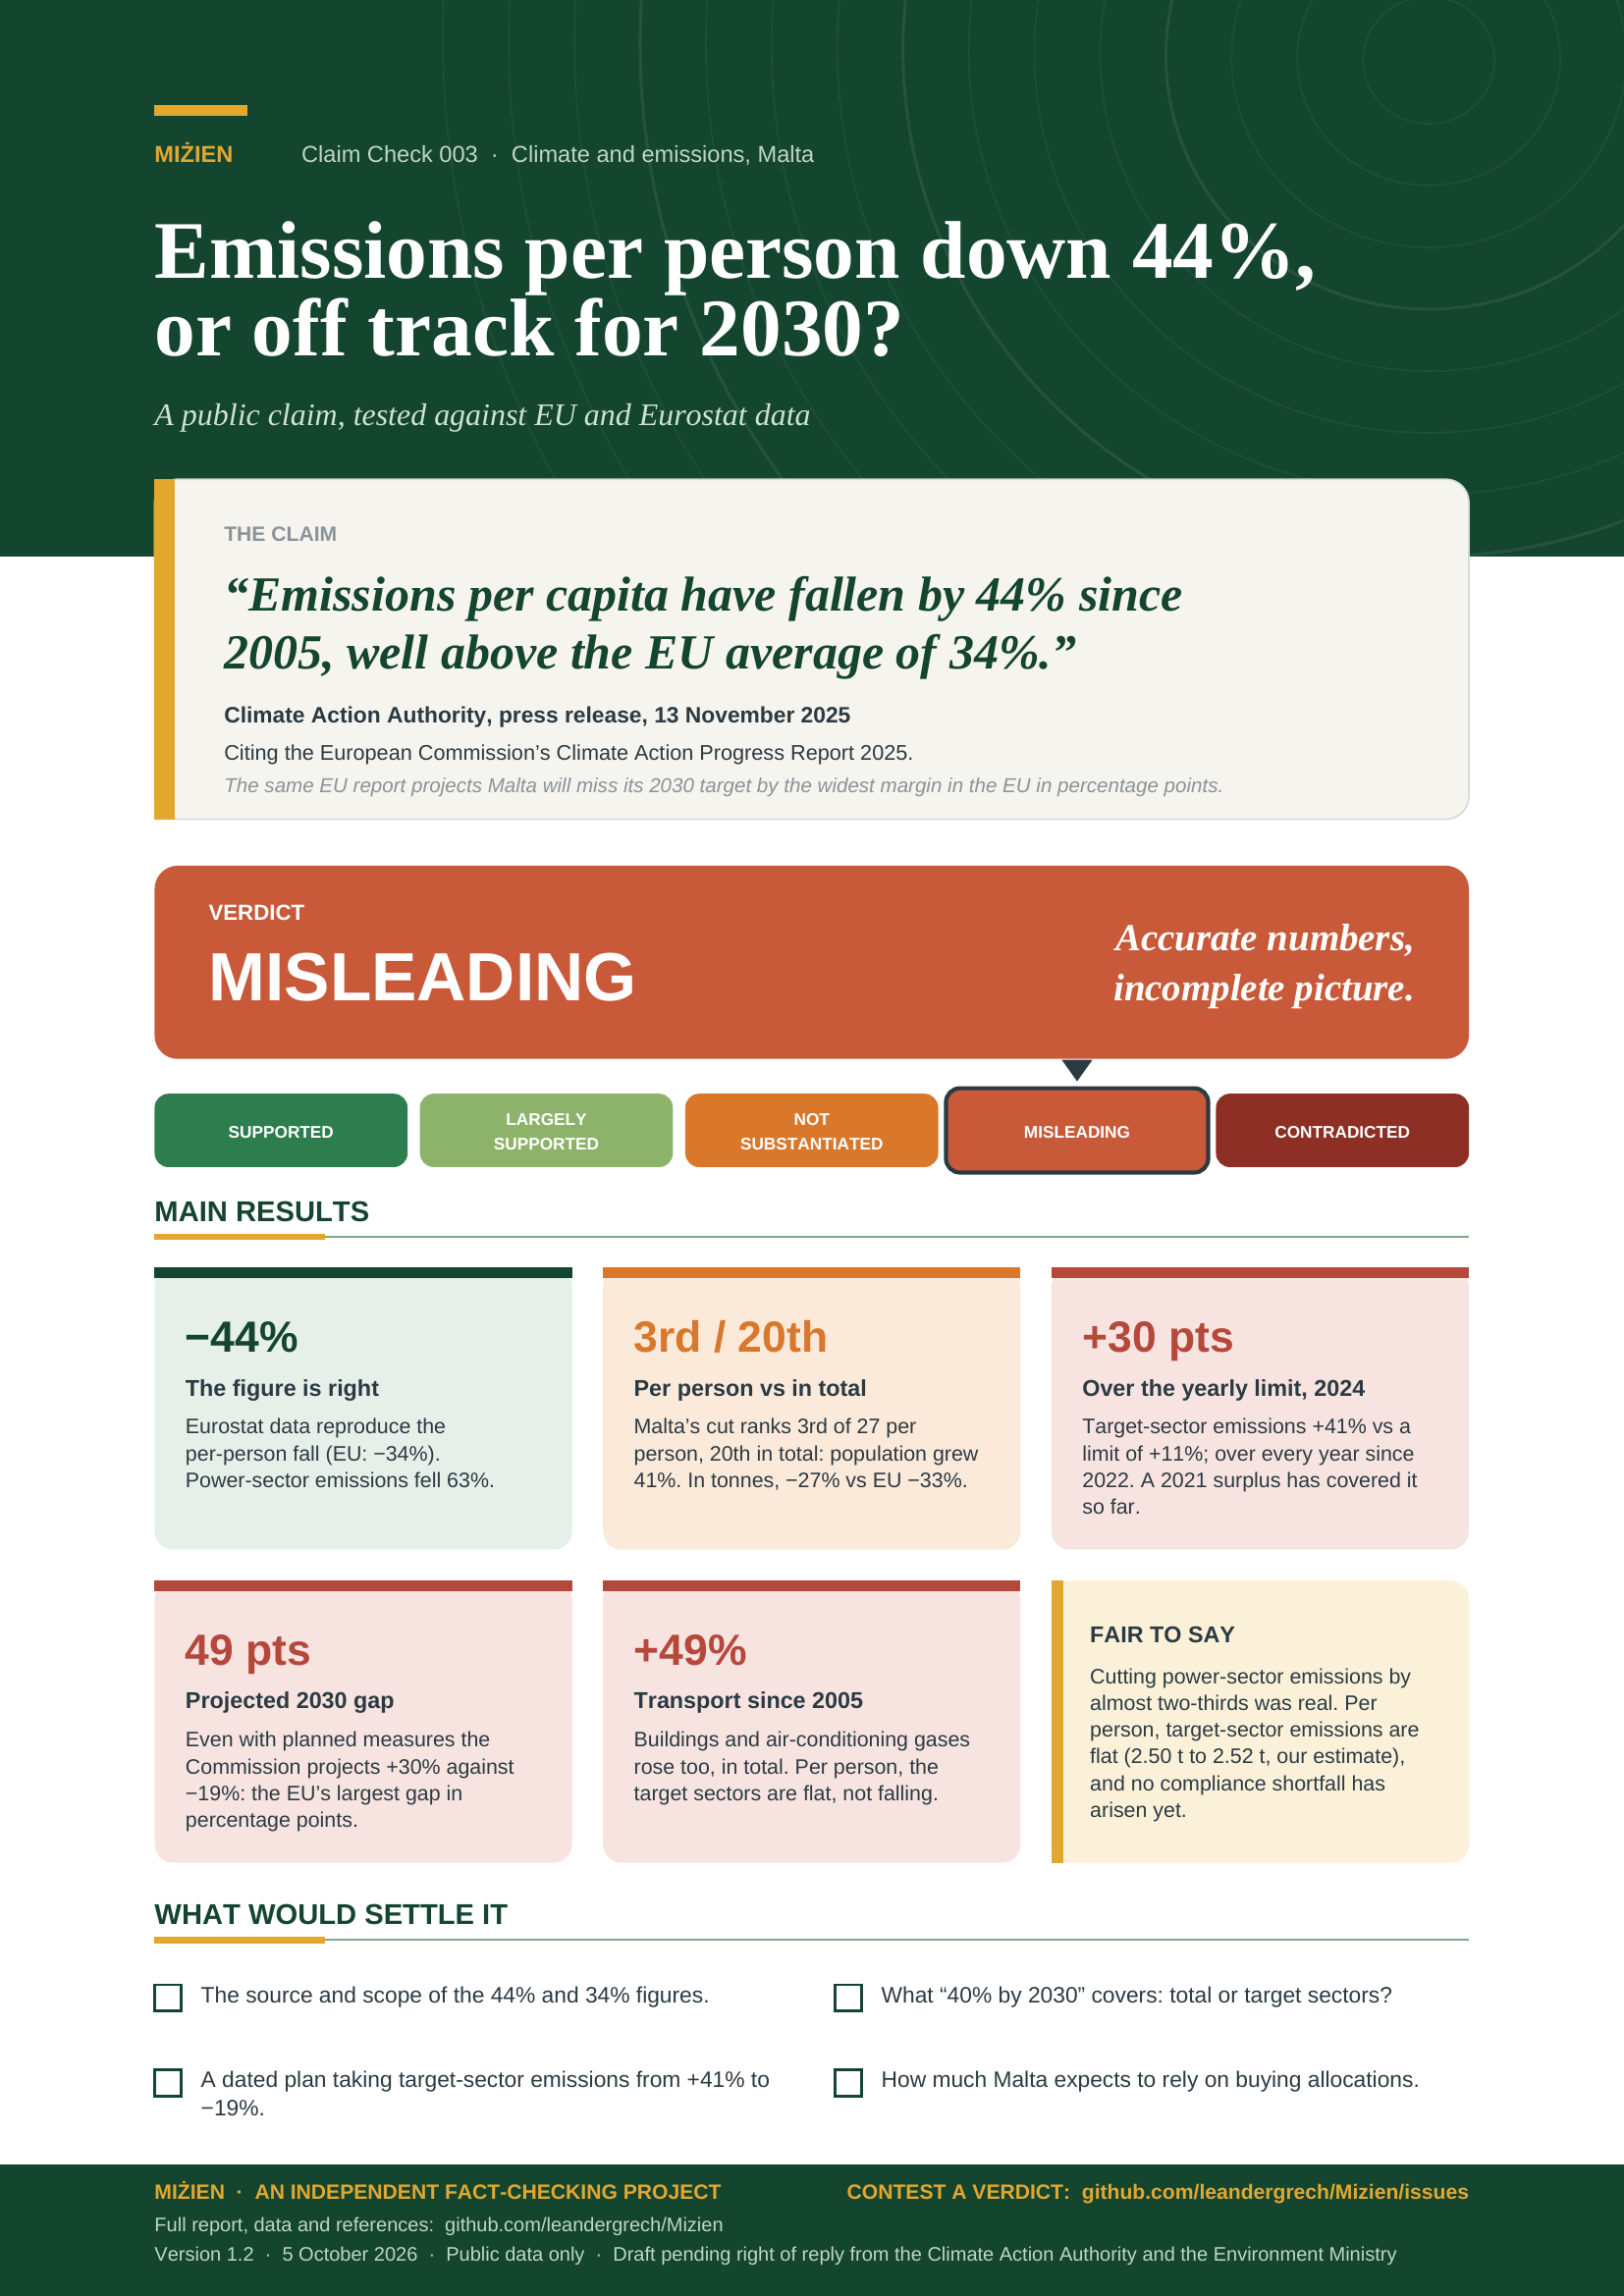
Down 44% per person, or off track for 2030?
Testing a public claim about Malta’s greenhouse-gas emissions against EU and Eurostat data
“Emissions per capita have fallen by 44% since 2005, well above the EU average of 34%.”
Climate Action Authority, press release, 13 November 2025.
Citing the European Commission’s Climate Action Progress Report 2025.
Verdict: Misleading Accurate figures; the report’s main finding is left out
Version 1.2 · 5 October 2026
TL;DR
Malta’s Climate Action Authority (CAA) said in November 2025 that emissions per person have fallen 44% since 2005, well above the EU average of 34%, citing the European Commission’s 2025 Climate Action Progress Report. Ranked against all 27 Member States, Malta’s per-person cut to 2024 is the 3rd largest; its cut in total emissions is the 20th. In the sectors under its binding national target, the same Commission report shows Malta over its yearly limit by 22 to 30 points in each year from 2022 to 2024, and projects that it will miss its 2030 target by the widest margin in the EU in percentage points. The release mentions neither.
- The numbers are right. Eurostat data reproduce a per-person fall of about 46% (2005–2023) for Malta against 34% for the EU.
- Per person 3rd in the EU, in total 20th. Malta’s population grew 41%, second only to Luxembourg; about half of the per-person fall is population growth. Total emissions fell 27% (EU 33%; Figure 2).
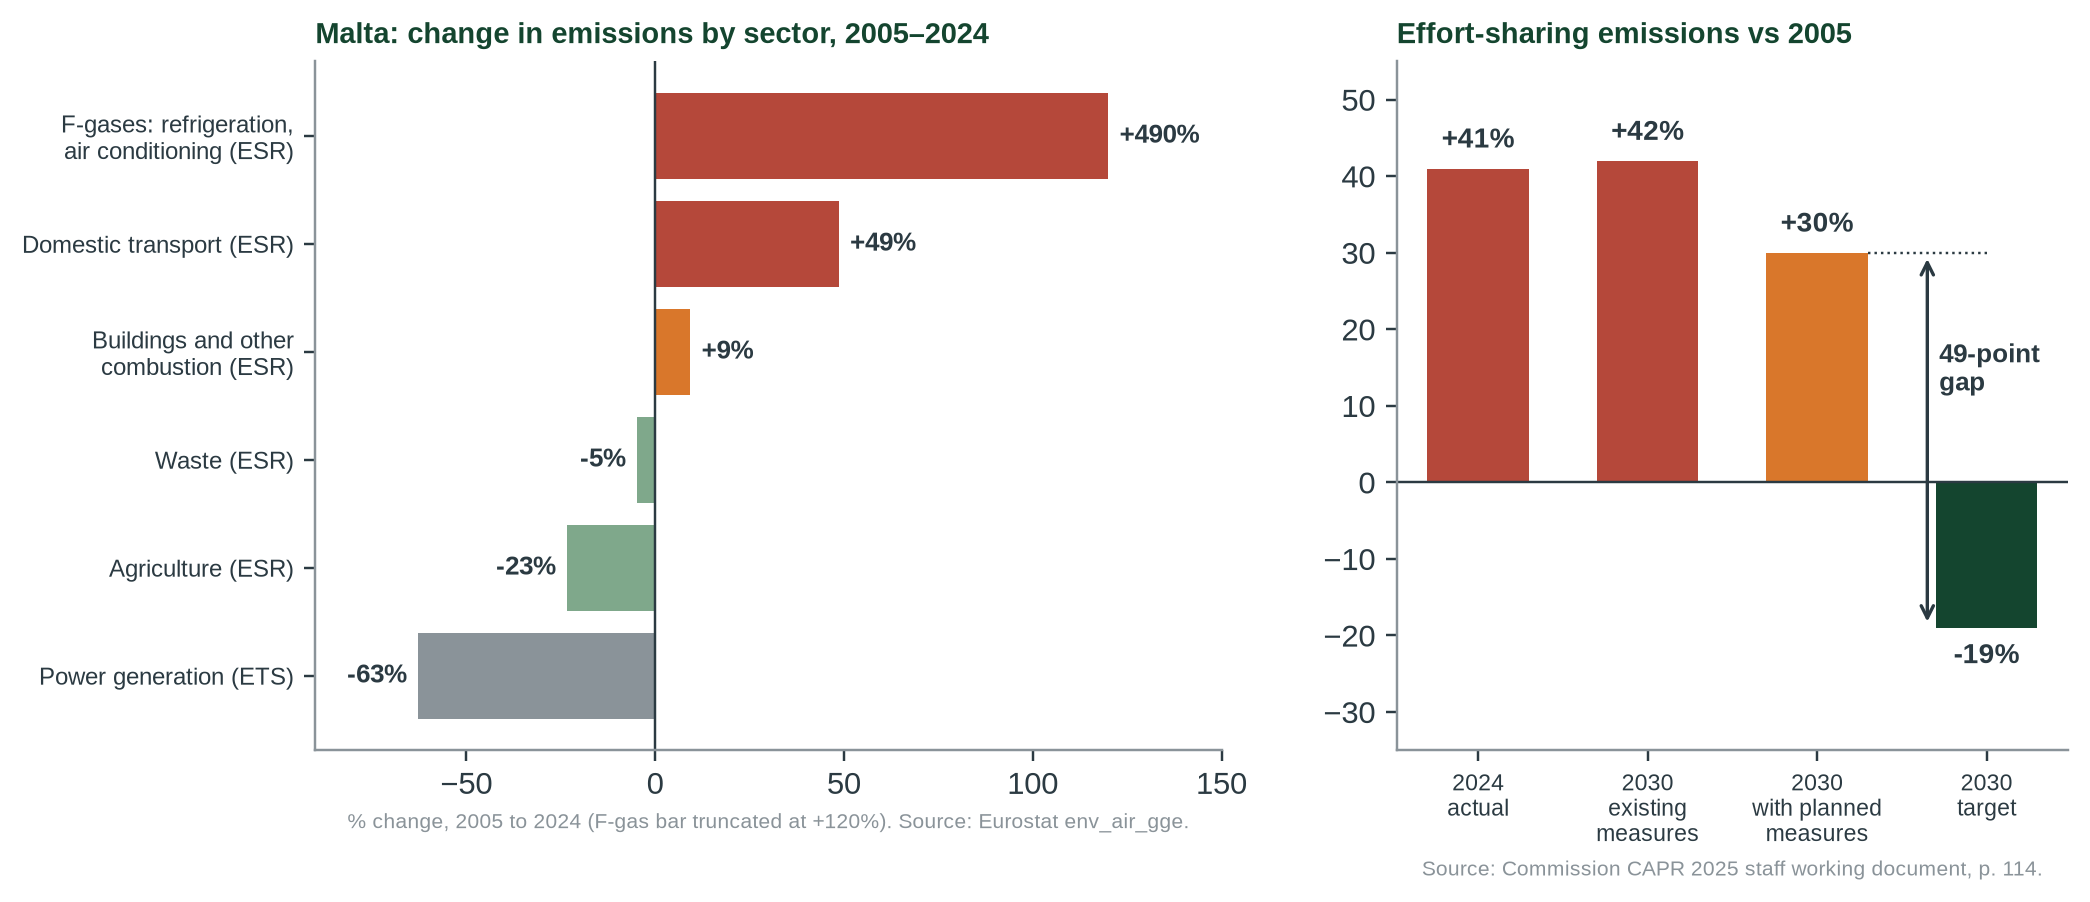
- Nearly all of the cut came from power generation, which is outside the national target (−63%). Transport rose 49%, buildings 9% and refrigerant gases almost six-fold.
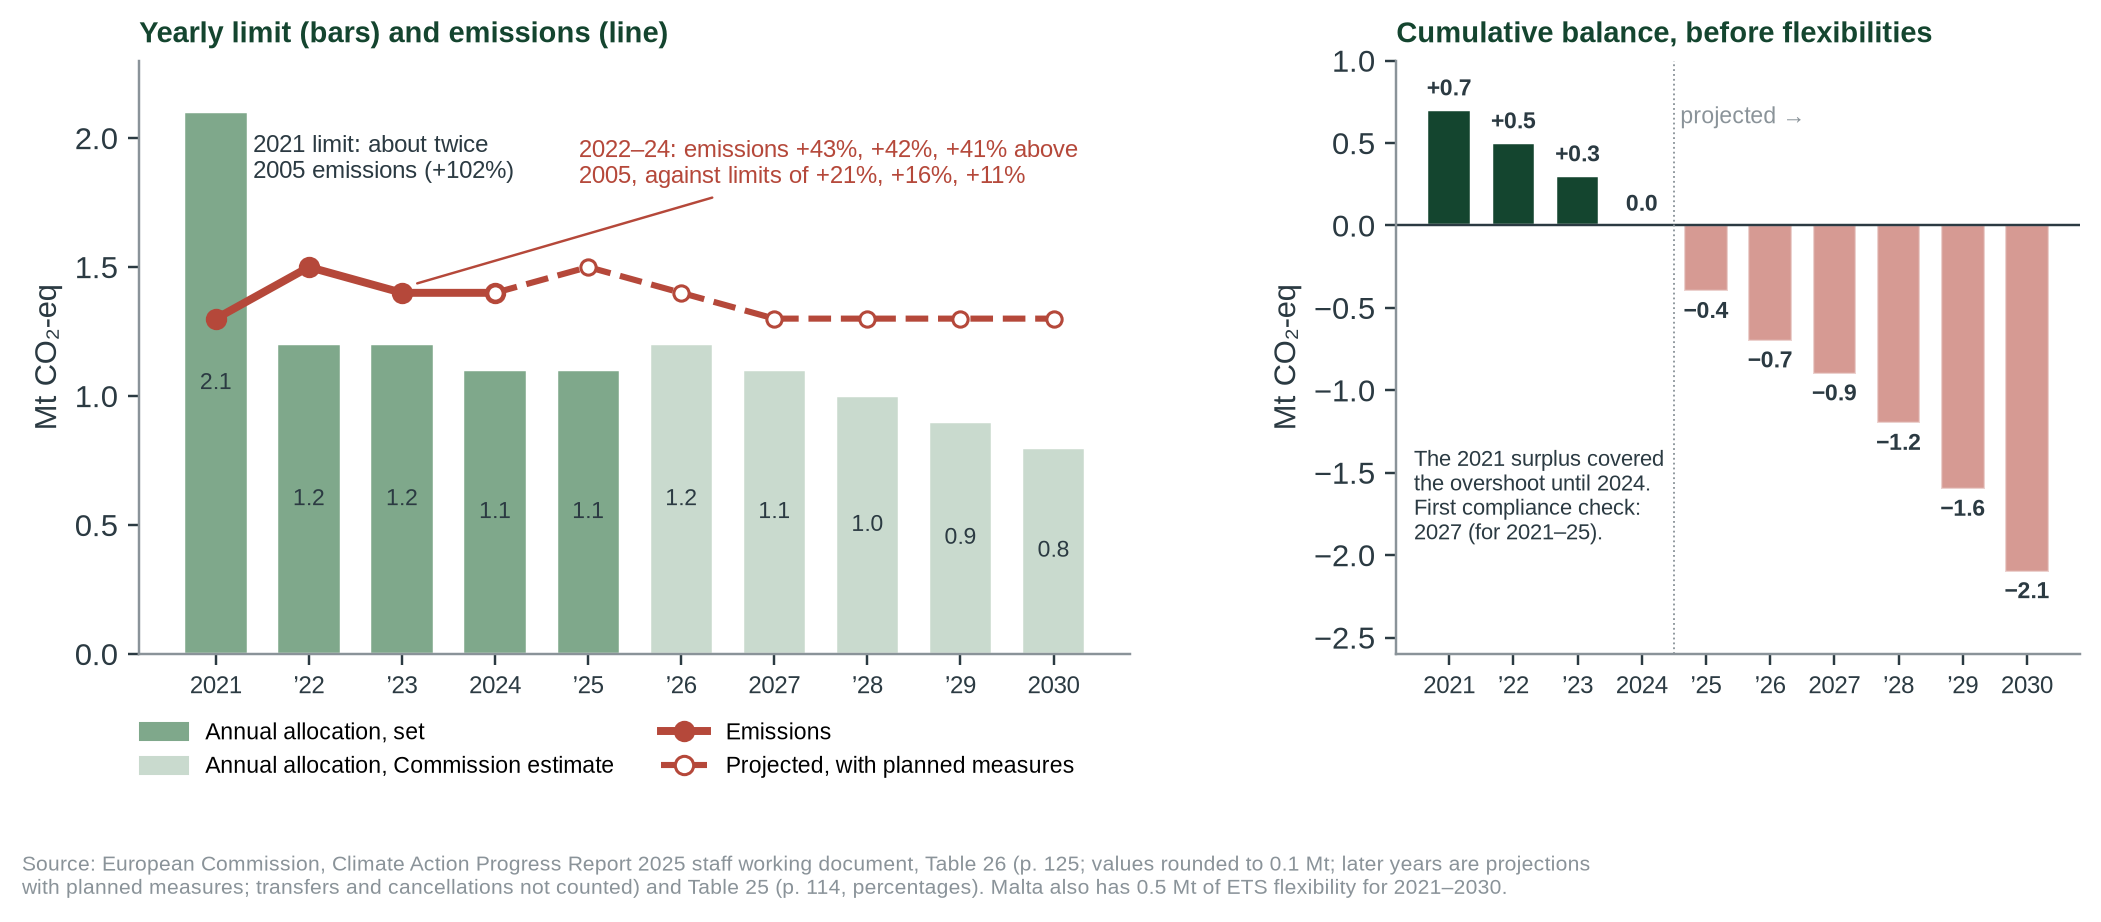
- Over the yearly limit since 2022. Effort-sharing emissions (transport, buildings, waste, farming, F-gases) were 41–43% above 2005 in 2022–2024, against limits of +21% to +11%. A large 2021 allocation has covered the overshoot until 2024; the balance is projected at −2.1 Mt by 2030 (Figure 4), and even with planned measures at +30% against a −19% target.
- Two points in the authority’s favour. Per person, target-sector emissions are flat (2.50 t in 2005, 2.52 t in 2024; our estimate), and no compliance shortfall has arisen yet: the first check is in 2027.
- Verdict: misleading (high confidence). Each figure is accurate, but citing the per-person result from the report while omitting its central finding on Malta leaves an inaccurate overall impression.
- Supported
- Largely supported
- Not substantiated
- Misleading
- Contradicted
What would move the verdict up
A published path taking effort-sharing emissions from +41% to −19% by 2030; evidence that the projections are out of date; or a statement that put the per-person figure next to the 2030 projection.
What would move it down
Evidence that the per-person figure is used in place of the target metric in other official communications, or that Malta plans to rely mainly on buying allocations from other states.
IN THIS REPORT
1 The claim and what we could verify
The claim is the Climate Action Authority’s own press release of 13 November 2025 [1], read in full from an archived copy. MaltaToday reported it the same week, quoting the authority [2]. A news-agency report on the same EU publication led instead with Malta’s projected 2030 increase [3]. We assess the authority’s wording, not the headlines.
| Source | What it says | Our access | Status |
|---|---|---|---|
| Climate Action Authority, press release, 13 Nov 2025 [1] | “Emissions per capita have fallen by 44% since 2005, well above the EU average of 34%.” Emissions per unit of GDP down 81.6% (EU 61.9%). The figures “show that Malta is reducing emissions both at household level and across the economy, while continuing to grow.” Transport and buildings named as sectors “where challenges remain”. No mention of the 2030 projection. | Read in full (Wayback copy, 15 Apr 2026). Live site blocks automated access. | The claim |
| MaltaToday, Nov 2025 [2] | Repeats the authority’s figures and quotes it. | Read in full (Wayback copy). | Relay |
| Italpress / MNA, 17 Nov 2025 [3] | Same EU report: Malta’s emissions to rise about 30% above 2005 by 2030 against a 19% cut, a gap of 49 points; per-person fall of 44% also reported. | Read in full. | Context |
| European Commission, CAPR 2025 staff working document [4] and chapter 3 [5] | Malta’s effort-sharing emissions and projections; sector trends; Malta among the three Member States with the largest projected 2030 gaps. | Read: all Malta passages. | Primary evidence |
| CAA factsheet, June 2026 | Listed in our candidate file as the authority’s framing. | Not read: blocked, no archived copy. | Gap |
2 Method
Question. Is the per-person comparison accurate, and does it give a fair picture of Malta’s progress on emissions as the same EU report assesses it?
Evidence. This claim is statistical, so independent datasets carry most of the weight. We downloaded Eurostat greenhouse-gas inventories (env_air_gge), population (nama_10_pe) and renewables shares (nrg_ind_ren) on 2 October 2026, and the same emissions and population series for all 27 Member States on 5 October 2026, and recomputed every percentage with a script (tools/cc-003-report/calc.py; outputs in data/cc-003/). Malta’s effort-sharing figures are typed from the Commission’s Tables 25 and 26 into data/cc-003/capr2025_esr_malta.csv. We read every passage on Malta in the Commission’s staff working document. Peer-reviewed literature was searched for Malta-specific decompositions of emissions; none was found (Section 8).
Grades. Official statistics and EU assessments are grade C under our scale (official statistics summary). The two peer-reviewed papers on Maltese transport are context only. Verdicts follow the five-point scale in Appendix A.
3 Why per person and total differ
Emissions per person are total emissions divided by population. If the population grows, the per-person figure falls even when total emissions do not change. This is the identity behind the “impact = population × impact per person” framing used in environmental science since the 1970s [12 ◆]. Malta’s population grew 41% over the period, second only to Luxembourg (+46%) in the EU, so the two measures diverge more for Malta than for almost any other state.
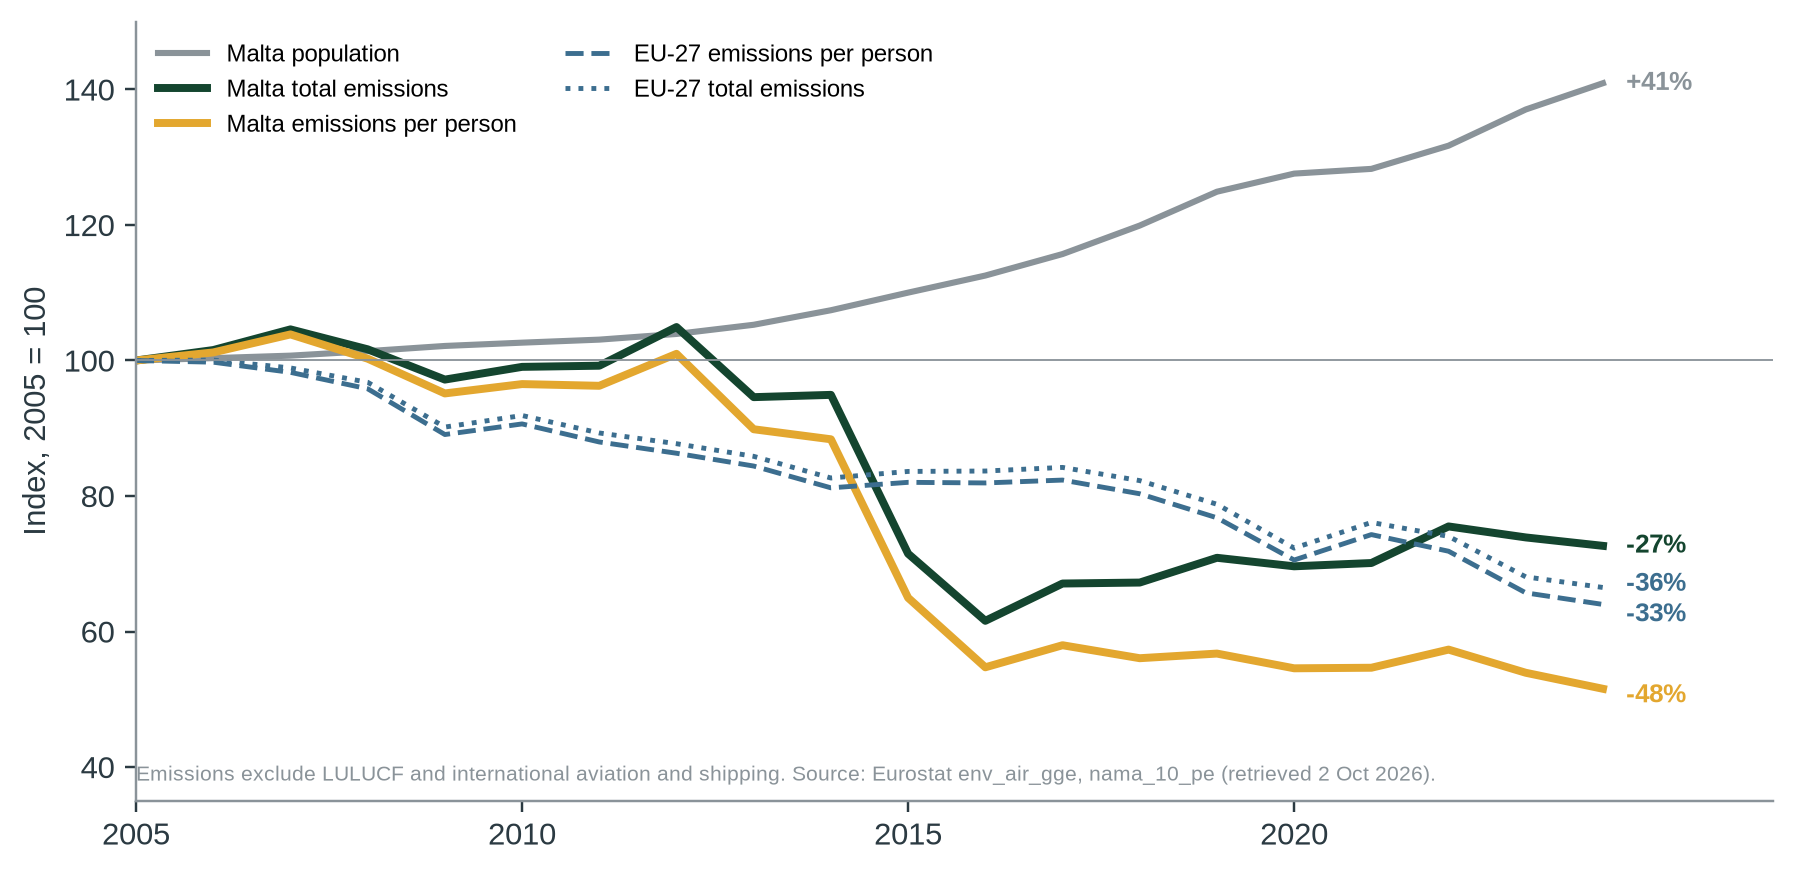
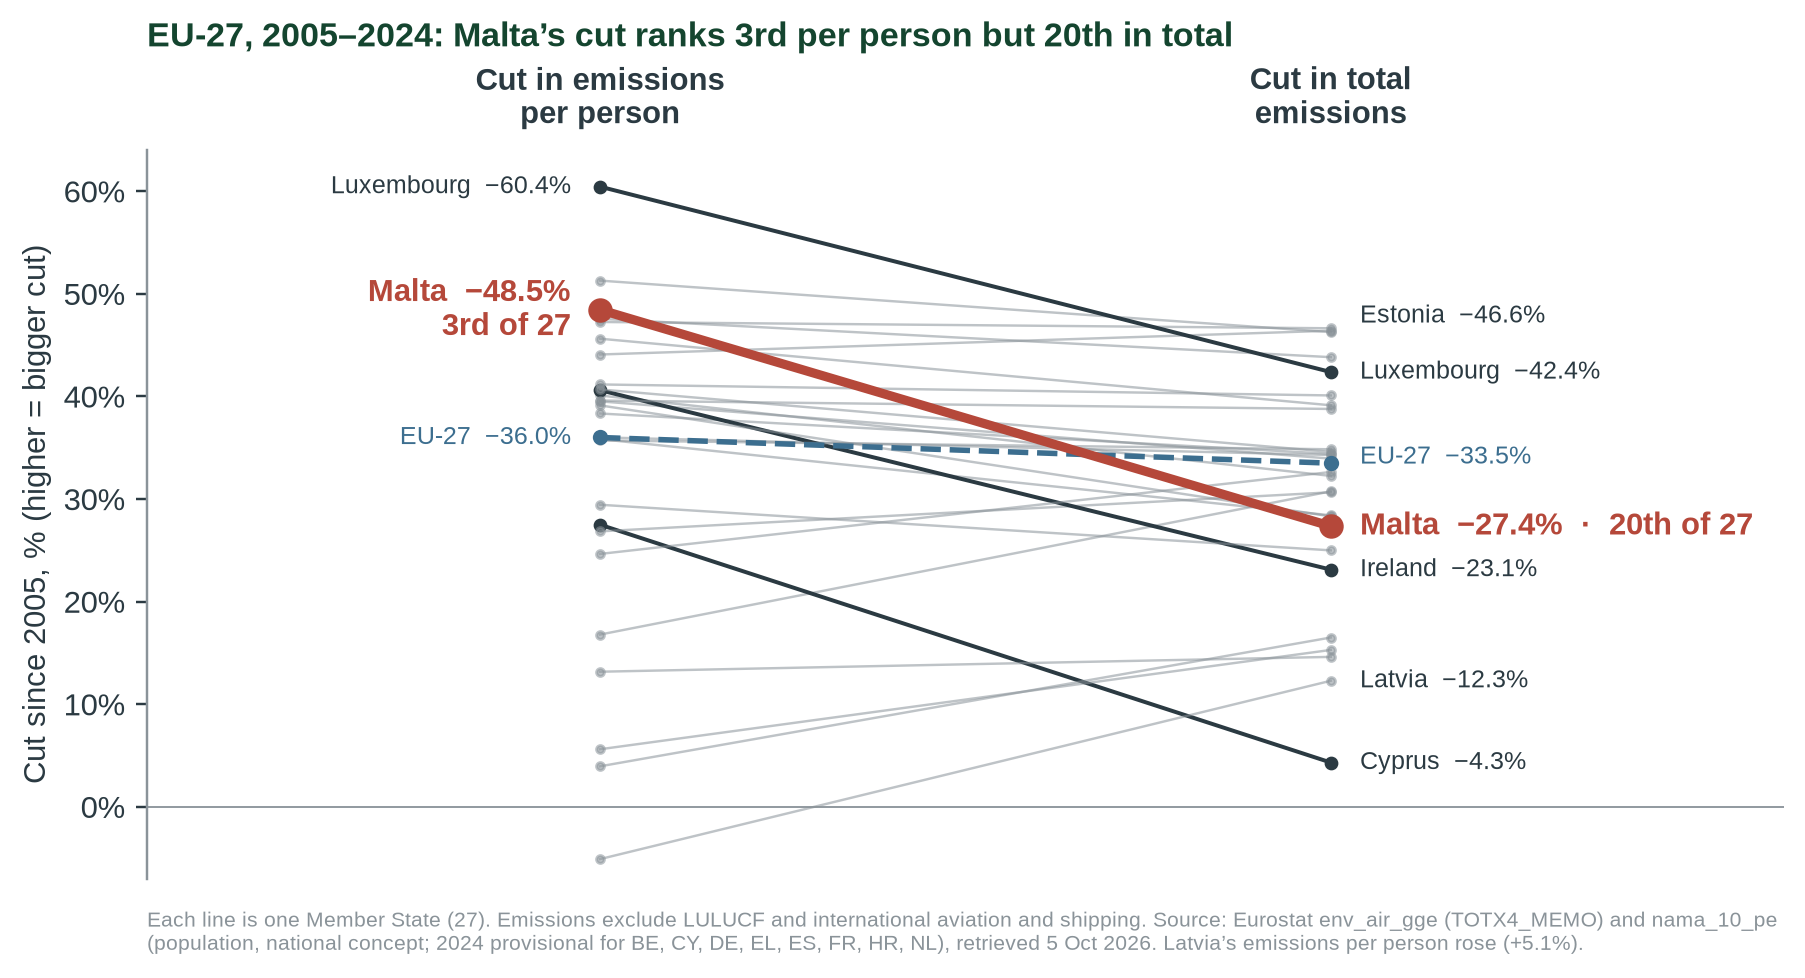
Ranking all 27 Member States both ways shows how much the choice of measure matters (Figure 2). Malta’s per-person cut, −48.5% to 2024, is the third largest, behind Luxembourg and Denmark. Its cut in total emissions, −27.4%, is the 20th. No other state falls as far between the two rankings (17 places; next Ireland, 12, and Cyprus, 7); all three are among the four fastest-growing populations in the EU (Malta +41%, Cyprus +32%, Ireland +29%).
4 What the data show
| Indicator | Malta | EU-27 | Source | Grade |
|---|---|---|---|---|
| Per-person emissions, 2005–2023 | −46% | −34% | Eurostat [6, 7]; CAA cites −44% / −34% [1] | C |
| Total emissions, 2005–2024 | −27% | −33% | Eurostat [6] | C |
| Population, 2005–2024 | +41% | +4% | Eurostat [7] | C |
| Power generation emissions, 2005–2024 | −63% | −54% | Eurostat [6] | C |
| Domestic transport emissions, 2005–2024 | +49% | −5% | Eurostat [6]; Commission [4] pp. 51–52 | C |
| Industrial emissions (mainly refrigeration and air-conditioning gases), 2005–2023 | +293% | −36% | Commission [4] p. 44 | C |
| Buildings emissions since 2005 | +12% | fell in every other state but Romania | Commission [4] p. 59 | C |
| Effort-sharing emissions, 2024 vs 2005 | +41% | −20% | Commission [4] pp. 114–115 | C |
| 2030 projection, existing measures / with planned measures | +42% / +30% | −31% / −38% | Commission [4] pp. 114–115 | C |
| 2030 effort-sharing target | −19% | −40% (EU) | Commission [4] pp. 114–115 | C |
| Effort-sharing emissions vs yearly limit, 2022 / 2023 / 2024 | +43 / +42 / +41% vs +21 / +16 / +11% | 2024: −20% vs −21% | Commission [4] pp. 114–115 | C |
| Cumulative allocation balance, 2024 / 2030 projected | 0.0 / −2.1 Mt | – | Commission [4] p. 125 | C |
| Effort-sharing emissions per person, 2005 → 2024 (our estimate) | 2.50 → 2.52 t | about −23% | Eurostat [6, 7]; Commission [4] | C |
| Renewables share of electricity, 2024 | 10.7% | 47.5% | Eurostat [8] | C |
All values recomputed or transcribed in data/cc-003/checks.csv. The Commission’s per-person series uses net emissions and an earlier inventory; ours uses the 2026 inventory excluding land use, so small differences are expected. Effort-sharing per person: Malta’s national total minus power generation (see below); EU from the Commission’s −20% and Eurostat population.
Reading across the data
- The cut was concentrated in electricity, which is regulated at EU level through the ETS and does not count towards Malta’s national 2030 target.
- The sectors closest to households rose: cars, buildings and air-conditioning gases. The release’s phrase “reducing emissions both at household level” is not what the sector data show; a per-person ratio is not a measure of household emissions.
- Malta’s 2030 gap is the largest in the EU in percentage points: 61 points with existing measures and 49 with planned measures. The next largest is Ireland (33 and 20) [4]. In tonnes, larger states’ gaps are bigger: Germany’s projected 2030 shortfall is 64 Mt CO2-eq, Malta’s 0.5 Mt [4, pp. 118, 125]. The Commission names Germany, Ireland and Malta as having the largest projected gaps [5].
- International shipping and aviation bunkers, which are outside both the national total and the target, tripled from 2.4 to 7.3 Mt, more than three times Malta’s national total. They are reported but not part of this claim.
Malta against its yearly limits
Under the Effort Sharing Regulation each Member State has a binding limit for every year from 2021, its annual emission allocation. Malta’s 2021 allocation was set at about twice its 2005 emissions (+102%); its emissions that year were 30% above 2005, leaving a surplus of 0.7 Mt. From 2022 the limits are much tighter, +21%, +16% and +11%, while emissions stayed at 41–43% above 2005: 22, 25 and 30 points over [4, p. 114]. Counting the 2021 surplus against the later overshoots, the Commission’s cumulative balance falls to 0.0 Mt in 2024 and, on projections with planned measures, to −2.1 Mt by 2030 (Figure 4) [4, p. 125]. Compliance is first checked in 2027, for 2021–2025, when states may use flexibilities such as buying allocations from other states; Malta also has 0.5 Mt of ETS flexibility for the decade [4, pp. 111, 125].
5 Where the evidence points different ways
Three questions decide how the per-person figure should be read. Each sets out the case for the authority’s framing beside the case against.
Q1 Is per person a fair way to compare Malta with the EU?
BOTH VALID, NOT INTERCHANGEABLEEVIDENCE FOR THE CLAIM'S IMPRESSION
Per-person emissions are a standard indicator, published by the Commission itself [4]. They allow small and large states to be compared and reflect equity arguments in climate policy.
EVIDENCE AGAINST
Malta’s binding EU obligation is expressed in total tonnes against 2005, not per person. With the second-fastest population growth in the EU, the per-person figure flatters Malta more than any other state: it ranks 3rd per person and 20th in total (Figure 2).
Q2 Do the results reflect policy, or one-off changes?
MAINLY ONE STRUCTURAL CHANGEEVIDENCE FOR THE CLAIM'S IMPRESSION
The interconnector and the gas conversion were policy decisions, and they delivered a lasting 63% cut in power-sector emissions. Emissions per unit of GDP fell 82% [1, 4].
EVIDENCE AGAINST
Outside power generation, emissions grew. Effort-sharing sectors were 30% above 2005 already in 2021 and 41% above in 2024 [4]. Transport and car ownership growth on islands is a known structural problem [10, 11].
Q3 Can the 2030 gap still be closed?
UNCERTAIN; PROJECTIONS SAY NOEVIDENCE FOR THE CLAIM'S IMPRESSION
The CAA says Malta aims to cut emissions by 40% by 2030 [1]. No shortfall has been incurred yet: the 2021 surplus covers 2022–2024, and compliance is first checked in 2027 [4, pp. 111, 125]. The EU rules allow flexibilities (buying allocations from other states, ETS and land-use credits). Projections can be revised as measures are added.
EVIDENCE AGAINST
Malta has been 22–30 points over its yearly limit since 2022 [4, p. 114]. Even with planned measures the Commission projects +30% against −19% [4]. The cumulative allocation balance turns negative from 2025 and reaches −2.1 Mt by 2030 before flexibilities [4, p. 125]. Malta is among six states projected to have excess emissions in 2026–2030 [5].
6 Testing the claim
| Sub-claim | Said by | What the evidence shows | Rating |
|---|---|---|---|
| A. Emissions per capita have fallen 44% since 2005 | CAA [1] | Reproduced from Eurostat (−46% to 2023, −48% to 2024). Commission source. | ACCURATE |
| B. …well above the EU average of 34% | CAA [1] | Reproduced (−34% to 2023). True per person (3rd of 27 to 2024); not in total tonnes (−27% vs −33%; 20th of 27). | ACCURATE, PARTIAL |
| C. Emissions per unit of GDP down 81.6% vs EU 61.9% | CAA [1] | Not recomputed (GDP series and price base not stated). Direction consistent with Commission data. | NOT TESTED |
| D. Malta is reducing emissions at household level | CAA [1] | In total, sectors linked to households rose: transport +49%, buildings +9 to +12%, air-conditioning gases up almost six-fold. Per person, the target sectors were flat (2.50 t to 2.52 t, our estimate), not falling. A per-person ratio of all emissions is not a household measure. | NOT SUPPORTED |
| E. Malta’s efforts are showing clear results | CAA [1] | True for power generation. The same report shows Malta over its yearly limits since 2022 and projects the largest shortfall in the EU (in percentage points) against its binding 2030 target; the release mentions neither. | MISLEADING BY OMISSION |
| F. Malta aims to reduce emissions by 40% by 2030 | CAA [1] | A stated aim, not a result. Scope (total or effort-sharing) not given. Same figure appears in the 2026 Labour manifesto (see CC-011). | UNCLEAR SCOPE |
7 Verdict and requests for evidence
Accurate figures, inaccurate overall impression. Confidence: high. Based on the Commission’s own report and Eurostat data, both of which can be shown.
Why. (1) The 44% and 34% figures are correct and reproducible. (2) About half of Malta’s per-person fall reflects population growth; in total tonnes Malta cut less than the EU average, and its rank falls from 3rd to 20th of 27. (3) The cut came almost entirely from power generation, which is outside the national target, while transport, buildings and refrigerant gases rose. (4) The report the authority cites shows Malta over its yearly limits since 2022 and projects that it will miss its binding 2030 target by the widest margin in the EU in percentage points; the release omits this. Under our scale, a statement whose individual figures are defensible but which omits material facts so that the overall impression is inaccurate is Misleading.
What this verdict does not say. It does not say the figures are false, that the power-sector transition was not an achievement, that Malta has already broken EU rules (the 2021 surplus has covered the overshoot so far, and compliance is first checked in 2027), or that anyone acted in bad faith. A fuller statement would read: “Emissions per person fell 44%, helped by strong population growth; total emissions fell 27%. Emissions in transport, buildings and other effort-sharing sectors are 41% above 2005, and the Commission projects we will miss our 2030 target unless we do more.”
Evidence we are asking for
- The Climate Action Authority’s source for the 44% and 34% figures (table, year and emissions scope).
- The scope of the “40% by 2030” aim: total emissions, effort-sharing emissions, or another basis.
- The latest projection of effort-sharing emissions for 2030, and the measures and dates that close the gap to −19%.
- Whether Malta expects to use flexibilities (purchased allocations, ETS or land-use credits) to meet the target, and in what quantity.
- The June 2026 CAA emissions factsheet, which we could not access.
8 Limitations
- This is a statistical check. Peer-reviewed literature was searched (Crossref, OpenAlex) for Malta-specific decompositions of emissions; none was found, so the decomposition here is our own two-factor arithmetic.
- Eurostat’s 2026 inventory differs slightly from the 2025 inventory the Commission used; we reproduce the direction and size of the CAA’s figures, not the exact decimals.
- Projections are the Commission’s reading of Malta’s 2025 submissions; newer measures may change them.
- Effort-sharing emissions per person are our estimate (national total minus power generation), not an official series; they match the Commission’s 2005 base and its 2021–2024 changes within 3 points. The Commission’s Table 26 rounds to 0.1 Mt, so a balance of 0.0 Mt in 2024 means within about 0.05 Mt of zero, and its cumulative balance ignores transfers and cancellations [4, p. 116].
- The EU-27 ranking uses 2024 population figures that Eurostat marks provisional for eight states (not Malta).
- We read the transport papers [10, 11] as abstracts only; they are context, not evidence for the verdict.
- The CAA’s June 2026 factsheet could not be read. If it presents the 2030 gap, that would be relevant to how the authority communicates, though not to the November 2025 release assessed here.
References
- [1] Climate Action Authority (13 Nov 2025). Malta strengthens its contribution toward the EU’s climate goals. Press release. (Read from Wayback Machine copy of 15 Apr 2026.) https://climateaction.gov.mt/press/malta-strengthens-its-contribution-toward-the-eus-climate-goals/
- [2] Zammit J. (Nov 2025). Malta cuts emissions faster than EU average, report shows. MaltaToday. https://www.maltatoday.com.mt/news/national/138271/malta_cuts_emissions_faster_than_eu_average_report_shows
- [3] Italpress / MNA (17 Nov 2025). Malta set to increase emissions as EU cuts carbon output. https://www.italpress.com/?p=605399
- [4] European Commission (Nov 2025). Climate Action Progress Report 2025, Commission Staff Working Document. Pages cited (printed page numbers; the PDF page is one higher): 33, 44, 51–52, 59, 111, 113–116, 118, 125. https://climate.ec.europa.eu/document/download/35f83a2d-f77d-4895-b616-d579069b23d3_en?filename=capr2025_swd_en.pdf
- [5] European Commission (2025). EU Climate Action Progress Report 2025, Chapter 3: Effort sharing emissions. https://climate.ec.europa.eu/eu-action/climate-strategies-targets/progress-climate-action/eu-climate-action-progress-report-2025/chapter-3-effort-sharing-emissions_en
- [6] Eurostat. Greenhouse gas emissions by source sector (env_air_gge), updated 2 Jun 2026, retrieved 2 Oct 2026 (all EU-27 states, 5 Oct 2026). https://ec.europa.eu/eurostat/databrowser/view/env_air_gge/default/table
- [7] Eurostat. Population and employment (nama_10_pe), retrieved 2 Oct 2026 (all EU-27 states, 5 Oct 2026). https://ec.europa.eu/eurostat/databrowser/view/nama_10_pe/default/table
- [8] Eurostat. Share of energy from renewable sources (nrg_ind_ren), retrieved 2 Oct 2026. https://ec.europa.eu/eurostat/databrowser/view/nrg_ind_ren/default/table
- [9] MiŻien. Calculation script and outputs: tools/cc-003-report/calc.py; data/cc-003/checks.csv.
- [10] Camilleri R., Attard M., Hickman R. (2024). Participatory policy packaging for transport backcasting: a pathway for reducing CO2 emissions from transport in Malta. Sustainability 16(1):430. doi:10.3390/su16010430. (Abstract read.) https://doi.org/10.3390/su16010430
- [11] Warren J.P., Enoch M.P. (2010). Island transport, car ownership and use: a focus on practices in Cuba, Malta, Mauritius and Singapore. Island Studies Journal 5(2):193–216. doi:10.24043/isj.244. (Abstract read.) https://doi.org/10.24043/isj.244
- [12] Ehrlich P.R., Holdren J.P. (1971). Impact of population growth. Science 171(3977):1212–1217. doi:10.1126/science.171.3977.1212. (Cited for the identity only; not read.)
Appendix A: series standards and verdict scale
Every investigation in this series follows the same rules so that verdicts are comparable and challengeable.
| Verdict | Meaning |
|---|---|
| SUPPORTED | Evidence consistently backs the claim as stated. |
| LARGELY SUPPORTED | Backed by the evidence, with minor caveats that do not change the substance. |
| NOT SUBSTANTIATED | Stated more strongly than the evidence offered or available allows. May be true in some conditions but has not been shown. |
| MISLEADING | Omits material facts so that the overall impression is inaccurate, even if individual statements are defensible. |
| CONTRADICTED | The available evidence points against the claim. |
Confidence
High: multiple independent lines of evidence agree. Moderate: evidence is relevant but incomplete or indirect. Low: evidence is thin, second-hand or conflicting.
Evidence grades
A experiment · B observational study with a control or gradient · C review, guidance or official statistics · D assertion or anecdote. ◆ marks a source known only second-hand.
Standards
- Quote the speaker, not the headline, with outlet and date, and link the original where possible.
- Separate the claim from the evidence offered for it, and say who made which statement.
- Grade the evidence and show differing views side by side where the evidence is unsettled.
- State what we could not access or verify, and what would change the verdict either way.
- Ask for the missing evidence in specific, answerable requests.
- Offer a right of reply where a check finds a claim Not substantiated, Misleading or Contradicted (or a pledge Not measurable, Off track or Missed), before wider circulation, and append responses.
- Correct errors openly with a version number and change log.
- Whistle-blow only on evidence: a verdict of Misleading or Contradicted requires documents or data that can be shown, not inference.
- Check every side. Government, opposition, NGOs and developers are held to the same standard.
Appendix B: revision log
| Version | Date | Change |
|---|---|---|
| 1.0 | 2 Oct 2026 | First issue. Draft pending right of reply from the Climate Action Authority and the Ministry for the Environment, Energy and Public Cleanliness. |
| 1.1 | 5 Oct 2026 | Corrections. (1) Section 4 table, EU 2030 effort-sharing projection: “−31% / …” → “−31% / −38%” (existing / additional measures, Commission Table 25). (2) EU industrial emissions, 2005–2023: “fell” → “−36%” (Commission p. 44). (3) “Widest margin in the EU” → “widest margin in the EU in percentage points” (TL;DR, Sections 6 and 7, flyer); Section 4 adds that in tonnes Germany’s projected 2030 shortfall (64 Mt) exceeds Malta’s (0.5 Mt). (4) Commission page numbers changed from PDF to printed pages: p. 115 → pp. 114–115 (Figure 2 label → p. 114), p. 126 → 125, p. 45 → 44, p. 52 → 51–52, p. 60 → 59. (5) Flyer title “Emissions down 44%” → “Emissions per person down 44%”; the two “+41%” flyer cards retitled “Population growth since 2005” and “Target-sector emissions, 2024”. (6) data/cc-003/checks.csv now also holds the EU-27 values shown in the Section 4 table. Verdict and confidence unchanged. |
| 1.2 | 5 Oct 2026 | Upgrade: (1) New Figure 2 ranks all 27 Member States on the per-person and the total cut, 2005–2024 (Eurostat): Malta 3rd (−48.5%) and 20th (−27.4%). (2) New Figure 4 and a subsection on Malta’s yearly effort-sharing limits from the Commission’s Tables 25 and 26: 22, 25 and 30 points over in 2022–2024; cumulative balance 0.0 Mt in 2024, −2.1 Mt projected for 2030. (3) Fairness note: per-person emissions in the target sectors are flat (2.50 t to 2.52 t; our estimate, tested against the Commission’s figures), and no shortfall has been incurred before the first compliance check in 2027. (4) TL;DR, key points, tiles, Sections 3–8, flyer and data updated; old Figure 2 is now Figure 3. Verdict and confidence unchanged. |
Sources and archived copies
-
Malta strengthens its contribution toward the EU's climate goals, Climate Action Authority, 13 Nov 2025.
Original · Archived copy
The claim. Read in full from Wayback copy of 15 Apr 2026 (live site blocks automated access). -
Climate Action Progress Report 2025, Commission Staff Working Document, European Commission, Nov 2025.
Original · fetched and fingerprinted 2026-10-10; no public snapshot yet
Primary evidence: ESR Table 25 pp. 114-115, AEA balance p. 125 (printed page numbers; PDF page is one higher). - Malta set to increase emissions as EU cuts carbon output (citing EC 2025 Climate Action Progress Report), Italpress / MNA, Nov 2025. Original · fetched and fingerprinted 2026-10-10; no public snapshot yet
- Malta cuts emissions faster than EU average, report shows, MaltaToday, Nov 2025. Original · Archived copy
-
Facts: emissions (June 2026), Climate Action Authority, Jun 2026.
Original · fetched and fingerprinted 2026-10-04; no public snapshot yet
Not read: blocked by the gov.mt network and no archived copy. Archive by hand. - Renewable Energy 2026: Malta, Chambers Practice Guides, 11 Sep 2026. Original · Archived copy
Right of reply
The body concerned has not yet been asked to reply. Its response will be published here, beside the verdict.
Connections
How this claim relates to the others: who made it, the themes it shares with other claims, and the patterns it shows. A connection is a reason to read two checks side by side. It does not make either one right or wrong. How connections are found.
Who made it
Climate Action Authority Ministry for the Environment
Other claims by Ministry for the Environment 7
- CC-004 'Strong progress' in waste separation (Not substantiated)
- CC-010 Tree-planting counts (Largely supported)
- CC-022 'Lowest electricity burden in the EU' (Largely supported)
- CC-027 Power cuts: heat, not generation (not yet checked)
- CC-029 First offshore wind farm (Largely supported)
- CC-048 Sea urchins recovering (not yet checked)
- CC-051 'Over 30% of our seas protected' (Misleading)
Linked directly 14
Claims that share a theme with this one. A theme is a cause, a mechanism, a target or a way of presenting figures that the editors have found in several claims; its strength says how close the link is.
Transport, air and climate Shared driver · Strong
Fleet growth links traffic claims, air quality and emissions. The climate report names transport and buildings as the lagging sectors.
Selective-metric pattern Rhetorical pattern · Pattern, not causal
A favourable metric is cited while the regulator-relevant metric looks worse. Useful for tagging, not for implying a common cause.
2030 carbon target Shared target · Strong
The Climate Action Authority and the 2026 Labour manifesto (priority 18) both state a 40% cut in carbon emissions by 2030 against 2005, without saying whether it covers total or effort-sharing emissions.
- CC-011 Ten minutes' walk to green space (pledge: Not measurable)
- CC-094 Commission: Malta to emit more in 2030 than in 2005 (Supported)
- CC-025 Per-capita emissions down 44% since 2005 (Largely supported)
- CC-109 EU: transport is 48% of effort-sharing emissions (Largely supported)
- CC-114 PN: only EU state with rising emissions intensity (Misleading)
Same pattern
Pattern tags name a recurring way a claim can mislead. They describe the statement, not the speaker.
Selective metric
A favourable metric is cited while the regulator-relevant metric looks worse.
- CC-002 Comino tree compensation (Largely supported)
- CC-004 'Strong progress' in waste separation (Not substantiated)
- CC-009 More RO, less WSC groundwater (Largely supported)
- CC-025 Per-capita emissions down 44% since 2005 (Largely supported)
- CC-026 EU's largest rise in emissions (Largely supported)
- CC-079 Waste-to-energy: 4.5% of energy (Misleading)
- CC-114 PN: only EU state with rising emissions intensity (Misleading)
Two steps away 23
Not linked to this claim directly, but linked to a claim that is. These are found by following the links, not chosen by the editors, so they are looser: they show where one theme meets another.
- CC-001 Upper Barrakka concrete (Not substantiated)through Transport, air and climateCC-008Sealed soil and concrete or Selective-metric patternCC-010Replanting as currency
- CC-002 Comino tree compensation (Largely supported)through Selective-metric patternCC-004Waste and construction or Transport, air and climateCC-008Sealed soil and concrete or Selective-metric patternCC-010Replanting as currency
- CC-012 Ta' Qali gravel and grass (Contradicted)through Transport, air and climateCC-008Sealed soil and concrete
- CC-017 Land reclamation outside the Freeport (Not substantiated)through Selective-metric patternCC-004Waste and construction or Transport, air and climateCC-008Waste and construction
- CC-019 830,000 m2 of land lost in five years (Not substantiated)through Transport, air and climateCC-008Sealed soil and concrete
- CC-020 EP study: noise law not the cause (Largely supported)through Transport, air and climateCC-007Compliance-not-health pattern
- CC-022 'Lowest electricity burden in the EU' (Largely supported)through 2030 carbon targetCC-025Selective-metric pattern
- CC-024 Renewables target for 2030 (Not substantiated)through 2030 carbon targetCC-0112030 carbon target
- CC-031 Gozo, first climate-neutral region (Largely supported)through Transport, air and climateCC-026Shared emissions figures or 2030 carbon targetCC-109Shared emissions figures
- CC-033 Delimara: 'much cleaner air' (not yet checked)through Transport, air and climateCC-007Compliance-not-health pattern
- CC-035 PM2.5 death rate down two-thirds (Largely supported)through Transport, air and climateCC-007Transport, air and climate
- CC-054 Project Green: 100,000 m2 a year (not yet checked)through Selective-metric patternCC-010Replanting as currency
- CC-056 Central Link: 'only 254 trees' (not yet checked)through Transport, air and climateCC-008Replanting as currency
- CC-057 1,649 compensation trees (not yet checked)through Selective-metric patternCC-010Replanting as currency
- CC-069 82 million bus trips (not yet checked)through Transport, air and climateCC-008Transport, air and climate
- CC-072 EUR 15m to take cars off the road (not yet checked)through Transport, air and climateCC-008Transport, air and climate or 2030 carbon targetCC-109Transport, air and climate
- CC-076 36 more vehicles a day (Supported)through Transport, air and climateCC-008Transport, air and climate
- CC-079 Waste-to-energy: 4.5% of energy (Misleading)through Selective-metric patternCC-004Waste and construction
- CC-081 Landfill share rising (not yet checked)through Selective-metric patternCC-004Waste and construction
- CC-110 EU: 37.7% of new cars zero-emission (Supported)through Transport, air and climateCC-007Selective-metric pattern or Transport, air and climateCC-026Transport, air and climate or 2030 carbon targetCC-109Transport, air and climate
- CC-111 EU: 621 kg of waste a head, 74% landfilled (Supported)through Selective-metric patternCC-004Waste and construction
- CC-115 Chamber: congestion cost EUR 770m, 3.4% of GDP (Not substantiated)through Transport, air and climateCC-008Transport, air and climate or 2030 carbon targetCC-109Transport, air and climate
- CC-117 EU: Malta missed recycling targets (reasoned opinion) (not yet checked)through Selective-metric patternCC-004Waste and construction
Three steps away 26
One step further again. At this distance a connection says more about how the themes fit together than about this claim.
- CC-013 Permits keep property prices in check (Largely supported)through Selective-metric patternCC-004Waste and constructionCC-017Planning, housing and land take
- CC-014 Fewer enforcement notices, fewer illegalities (Misleading)through Selective-metric patternCC-004Waste and constructionCC-017Planning, housing and land take
- CC-018 IMF 'confirms' MDA on housing (Largely supported)through Selective-metric patternCC-004Waste and constructionCC-017Planning, housing and land take
- CC-029 First offshore wind farm (Largely supported)through 2030 carbon targetCC-0112030 carbon targetCC-024Renewables delivery
- CC-051 'Over 30% of our seas protected' (Misleading)through 2030 carbon targetCC-025Selective-metric patternCC-022Selective-metric pattern
- CC-058 96% of farmland in use (not yet checked)through Transport, air and climateCC-008Sealed soil and concreteCC-019Planning, housing and land take
- CC-059 Subsidies are 20% of farm output (not yet checked)through Transport, air and climateCC-008Sealed soil and concreteCC-019Farmland and farming pressure
- CC-063 Construction waste: 'standstill' warning (Not substantiated)through Selective-metric patternCC-004Waste and constructionCC-017Waste and construction
- CC-071 EUR 100m a year for free buses (Not substantiated)through Transport, air and climateCC-008Transport, air and climateCC-069Transport, air and climate
- CC-075 Seventh in the EU for cars (Misleading)through Transport, air and climateCC-007Selective-metric patternCC-110Transport, air and climate
- CC-080 EUR 75m organic plant (not yet checked)through Selective-metric patternCC-004Waste and constructionCC-079Waste and construction
- CC-092 PN: afforestation in a net-zero Gozo (pledge: Not measurable)through Transport, air and climateCC-026Shared emissions figuresCC-031Net-zero Gozo
- CC-095 EUR 400m to keep bills low (Not substantiated)through 2030 carbon targetCC-025Selective-metric patternCC-022Energy subsidies
- CC-101 EU: no registration or prior authorisation of water abstraction in Malta (Largely supported)through Selective-metric patternCC-004Waste and constructionCC-117EU findings of unmet obligations
- CC-104 PN: Malta fails EU noise law (not yet checked)through Transport, air and climateCC-007Compliance-not-health patternCC-020Noise governance
- CC-105 ADPD: no study of Freeport and airport noise (Largely supported)through Transport, air and climateCC-007Compliance-not-health patternCC-020Noise governance
- CC-107 A net-zero Gozo by 2040 (pledge: Not measurable)through Transport, air and climateCC-026Shared emissions figuresCC-031Net-zero Gozo
- CC-113 EEA: Malta among highest fossil-fuel subsidies relative to GDP (Largely supported)through 2030 carbon targetCC-025Selective-metric patternCC-022Energy subsidies
- CC-119 Council: renewables 17.2% of energy, almost all solar (not yet checked)through 2030 carbon targetCC-0112030 carbon targetCC-024Renewables delivery
- CC-120 EP study: 54,000 exposed to road noise, likely an underestimate (Largely supported)through Transport, air and climateCC-007Compliance-not-health patternCC-020Noise governance
- CC-123 KPMG: 8,716 residential units approved in 2024, up 7.4% (not yet checked)through Transport, air and climateCC-008Sealed soil and concreteCC-019Planning, housing and land take
- CC-124 CCPI 2026: Malta 25th, car use not down (Largely supported)through 2030 carbon targetCC-0112030 carbon targetCC-024Renewables delivery
- CC-127 EU: Malta has the lowest organic share in the EU (not yet checked)through Transport, air and climateCC-008Sealed soil and concreteCC-019Farmland and farming pressure
- CC-128 EU: Malta missed the water-plan timetable (not yet checked)through Selective-metric patternCC-004Waste and constructionCC-117EU findings of unmet obligations
- CC-129 EU: Malta has not updated its air pollution programme (not yet checked)through Selective-metric patternCC-004Waste and constructionCC-117EU findings of unmet obligations
- CC-130 NGOs: ODZ racecourse policy ends protection (not yet checked)through Transport, air and climateCC-008Sealed soil and concreteCC-019Farmland and farming pressure
Similar wording
Claims whose own words overlap with this one, with the words they share. Found by comparing the wording of the claims, not their verdicts; a lead to read them together, not a finding.
- CC-025 Per-capita emissions down 44% since 2005 (Largely supported)shares: capita, emissions
Timeline
What was said, what was published before and after it, and each step of this check, in date order. Statements and sources carry the date they were published. The steps of the check carry the date the research was done, from the check's research log. Other statements by the same body on the same topic show whether a position was repeated, changed or corrected.
2025
- 6 May 2025 Earlier statement by Ministry for the Environment on Climate & Energy CC-022 'Lowest electricity burden in the EU' (Largely supported)
- 2025 Evidence published EU Climate Action Progress Report 2025, Chapter 3: Effort sharing emissions, European Commission
- 22 July 2025 Earlier statement by Ministry for the Environment on Climate & Energy CC-029 First offshore wind farm (Largely supported)
- 13 November 2025 The statement Climate Action Authority; Ministry for the Environment (this claim)
- 13 November 2025 Statement published Malta strengthens its contribution toward the EU's climate goals, Climate Action Authority
- November 2025 Reported Malta set to increase emissions as EU cuts carbon output (citing EC 2025 Climate Action Progress Report), Italpress / MNA
- November 2025 Reported Malta cuts emissions faster than EU average, report shows, MaltaToday
- November 2025 Evidence published Climate Action Progress Report 2025, Commission Staff Working Document, European Commission
2026
- June 2026 Evidence published Facts: emissions (June 2026), Climate Action Authority
- 21 July 2026 Later statement by Miriam Dalli on Climate & Energy CC-027 Power cuts: heat, not generation (not yet checked)
- 11 September 2026 Evidence published Renewable Energy 2026: Malta, Chambers Practice Guides
- 2 October 2026 Version 1.0: first issue First issue. Draft pending right of reply from the Climate Action Authority and the Ministry for the Environment, Energy and Public Cleanliness.
- 5 October 2026 Version 1.2 Upgrade: (1) New Figure 2 ranks all 27 Member States on the per-person and the total cut, 2005–2024 (Eurostat): Malta 3rd (−48.5%) and 20th (−27.4%). (2) New Figure 4 and a subsection on Malta’s yearly effort-sharing limits from the Commission’s Tables 25 and 26: 22, 25 and 30 points over in 2022–2024; cumulative balance 0.0 Mt in 2024, −2.1 Mt projected for 2030. (3) Fairness note: per-person emissions in the target sectors are flat (2.50 t to 2.52 t; our estimate, tested against the Commission’s figures), and no shortfall has been incurred before the first compliance check in 2027. (4) TL;DR, key points, tiles, Sections 3–8, flyer and data updated; old Figure 2 is now Figure 3. Verdict and confidence unchanged. Verdict in this version: Misleading, high confidence.
- 5 October 2026 Evidence reviewed
- 5 October 2026 Version 1.1: corrections Corrections. (1) Section 4 table, EU 2030 effort-sharing projection: “−31% / …” → “−31% / −38%” (existing / additional measures, Commission Table 25). (2) EU industrial emissions, 2005–2023: “fell” → “−36%” (Commission p. 44). (3) “Widest margin in the EU” → “widest margin in the EU in percentage points” (TL;DR, Sections 6 and 7, flyer); Section 4 adds that in tonnes Germany’s projected 2030 shortfall (64 Mt) exceeds Malta’s (0.5 Mt). (4) Commission page numbers changed from PDF to printed pages: p. 115 → pp. 114–115 (Figure 2 label → p. 114), p. 126 → 125, p. 45 → 44, p. 52 → 51–52, p. 60 → 59. (5) Flyer title “Emissions down 44%” → “Emissions per person down 44%”; the two “+41%” flyer cards retitled “Population growth since 2005” and “Target-sector emissions, 2024”. (6) data/cc-003/checks.csv now also holds the EU-27 values shown in the Section 4 table. Verdict and confidence unchanged. all corrections
2027
- 5 October 2027 Coming up: Evidence review due Each finished check is reviewed against new evidence within a year.
Every change to this claim's record is public: history of the record.
Download the report and flyer