CC-025 · Climate & Energy · Emissions & targets
Per-capita emissions down 44% since 2005
Largely supported Moderate confidence Draft: no right of reply needed
Parts of this claim
The claim is split into parts that are tested separately, as in the report below. Each part has its own number.
- CC-025A Per-capita emissions down over 44% since 2005 (Govt of Malta [1])Reproduced from Eurostat: −46% to 2023, −48.5% to 2024; Malta passed −44% in 2016. The same figure was checked in CC-003. About half of it is population growth.
- CC-025B Emissions per unit of GDP down more than 80% (Govt of Malta [1])Holds at current prices (−82% to 2023, −84% to 2024). In chain-linked volumes it is −70% and −72%; no year reaches −80%. The statement names neither basis.
- CC-025C …demonstrating our commitment to decoupling growth from emissions (Govt of Malta [1])Real GDP +161%, total emissions −27%: absolute decoupling over 2005–2024. A statement of commitment is not itself testable; the data show the decoupling it refers to.
Claim Check 025 · Statistics and EU data
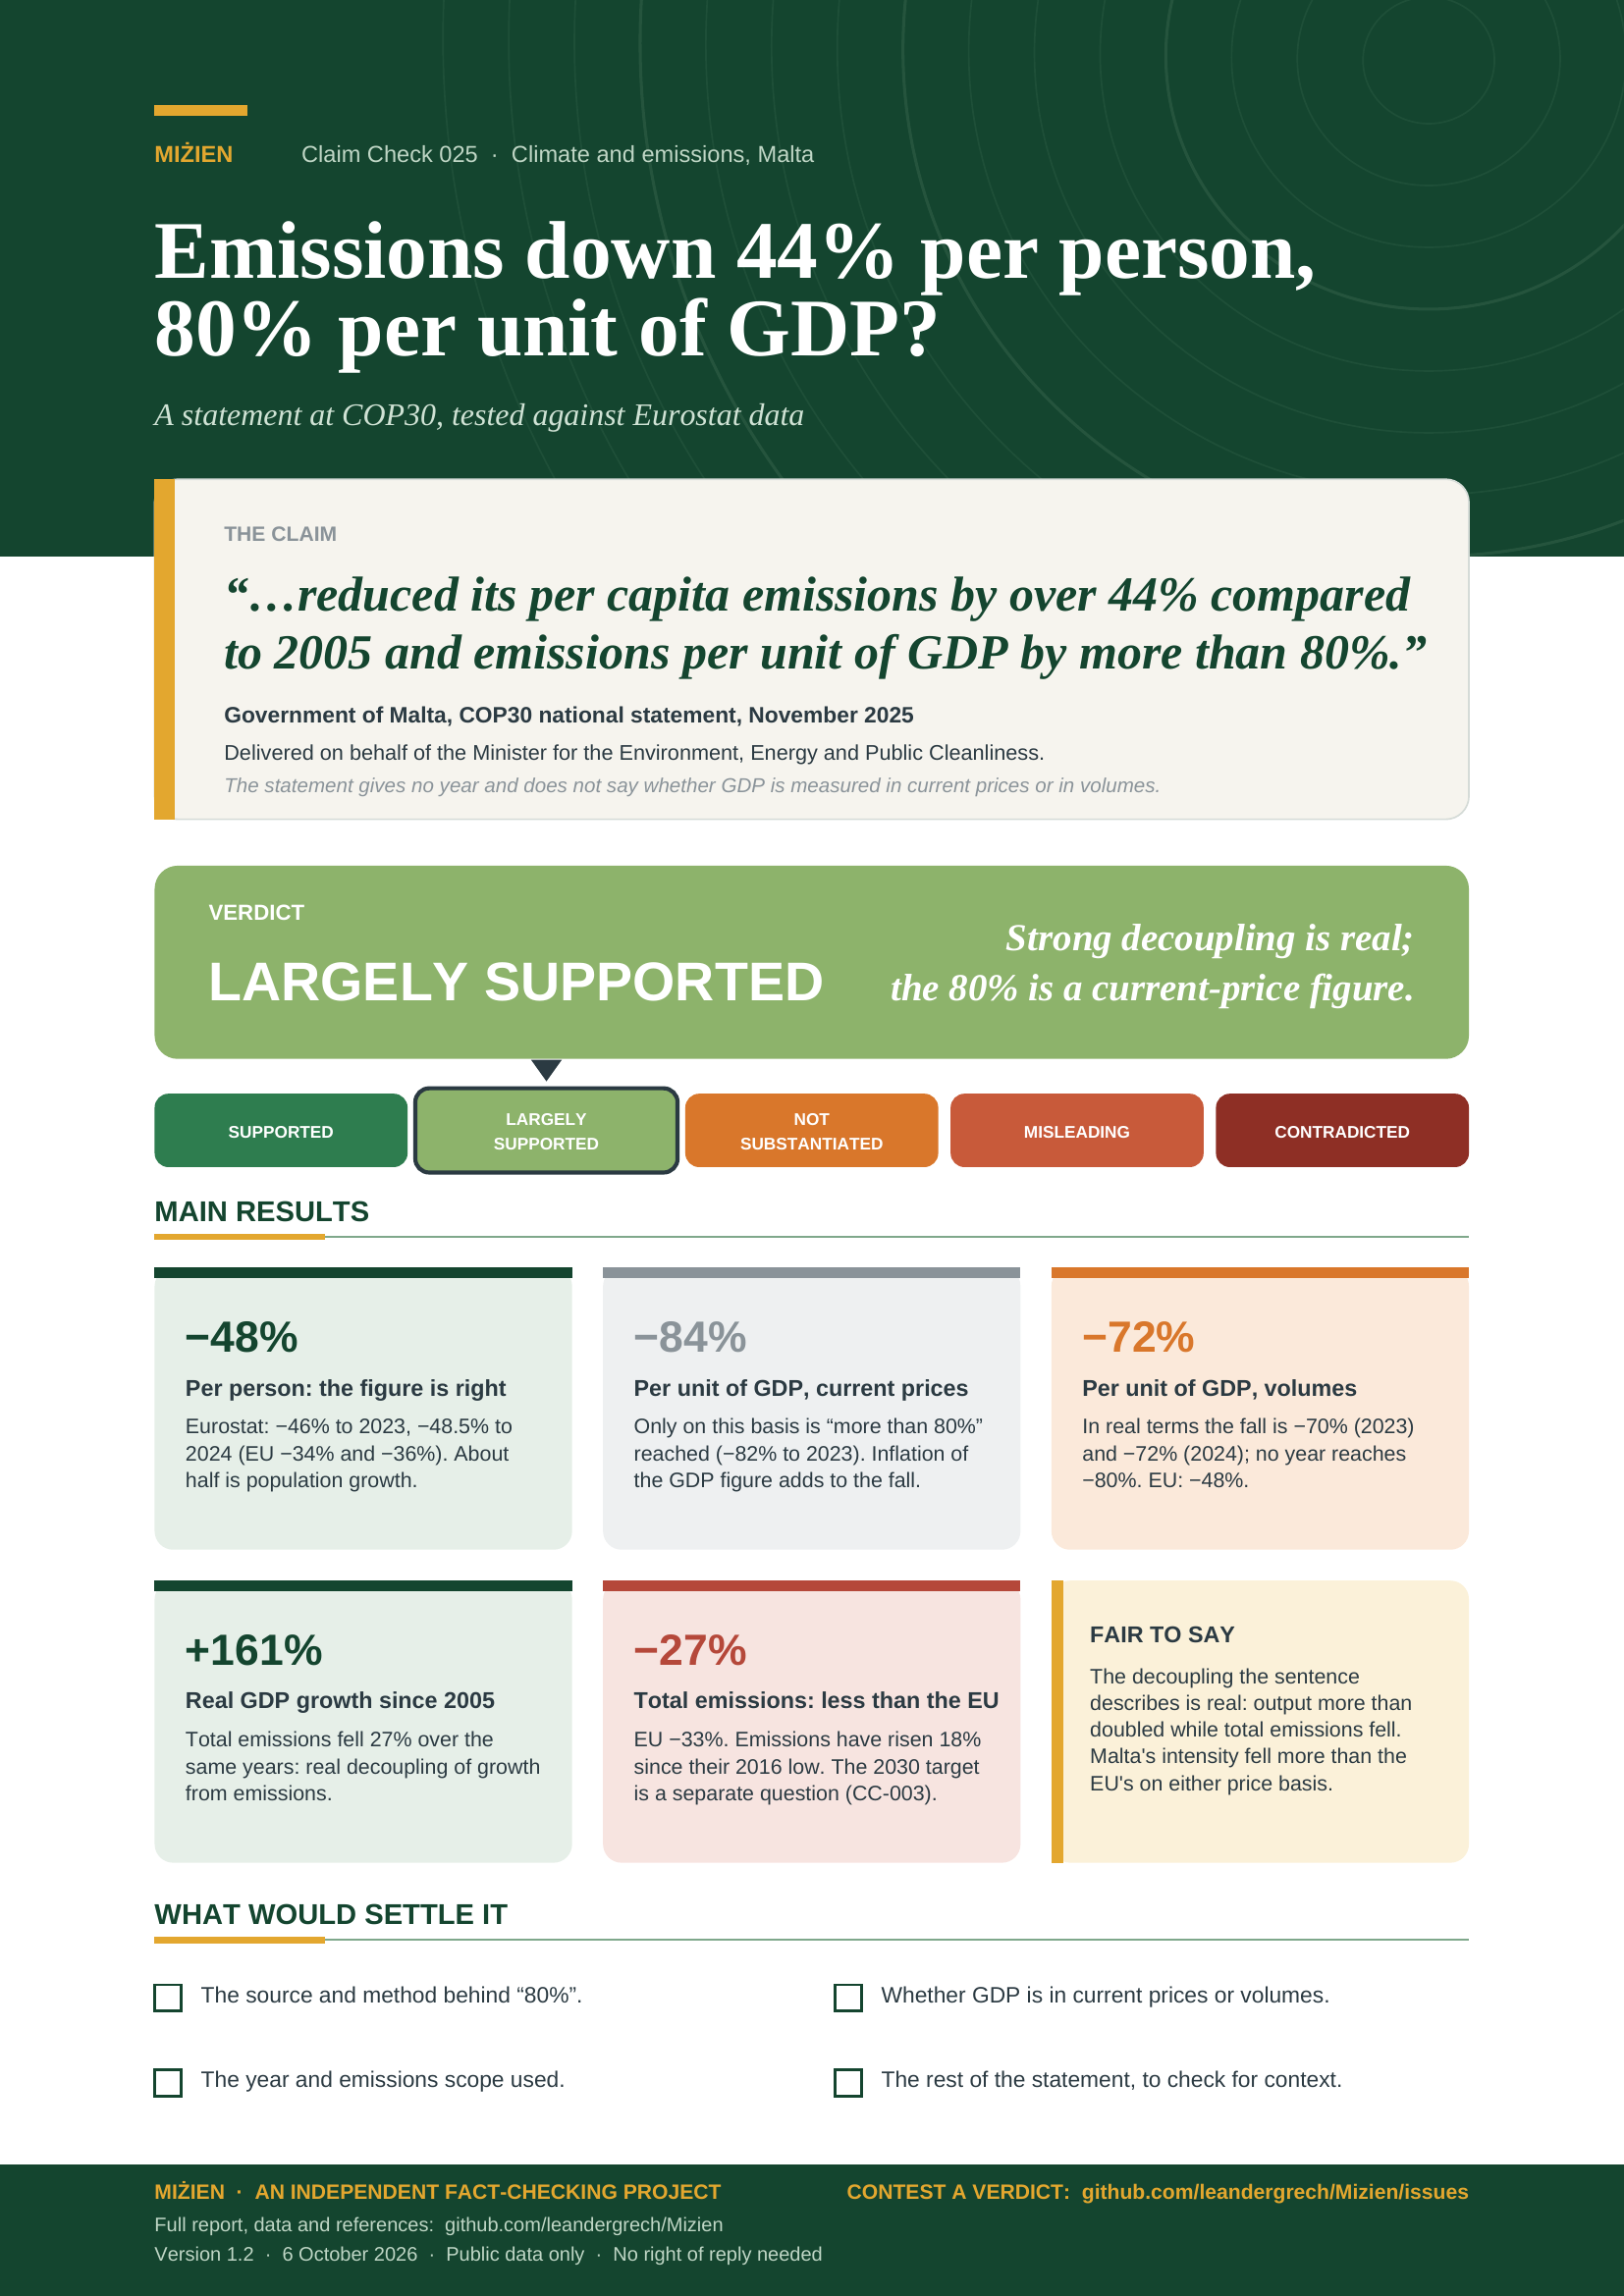
Emissions down 44% per person, 80% per unit of GDP?
Testing Malta’s COP30 statement on emissions against Eurostat data
“Malta has already reduced its per capita emissions by over 44% compared to 2005 and emissions per unit of GDP by more than 80%.”
Government of Malta, COP30 national statement, November 2025.
Delivered on behalf of the Minister for the Environment, Energy and Public Cleanliness.
Verdict: Largely supported The 80% holds only at current prices; about 70% in real terms
Version 1.2 · 6 October 2026
TL;DR
In its statement to the COP30 high-level segment (November 2025), the Government of Malta said: “Malta has already reduced its per capita emissions by over 44% compared to 2005 and emissions per unit of GDP by more than 80%, demonstrating our commitment to decoupling growth from emissions.” We tested both figures against Eurostat’s greenhouse-gas inventory, GDP and population series.
- The 44% figure is right. Eurostat gives −46% to 2023 (the latest year available when the statement was made) and −48.5% to 2024; the EU average is −34% and −36%. Malta passed −44% in 2016. Population growth of 41% explains about half of it (see CC-003).
- The “more than 80%” figure depends on the price basis, which the statement does not give. Against GDP at current prices, Malta’s emissions intensity fell 82% to 2023 and 84% to 2024. Against GDP in chain-linked volumes, the usual way to compare intensity over time, it fell 70% and 72%. No year to 2024 reaches −80% in volumes. The gap is a price effect: Malta’s GDP deflator rose about 72%.
- The decoupling claim holds. Real GDP grew 161% between 2005 and 2024 while total emissions fell 27%: absolute decoupling, which the research literature calls rare [8 ◆]. Most of the fall came from power generation (CC-003).
- What the sentence does not say. Total emissions fell less than the EU average (−27% against −33%), and CC-003 shows that Malta’s emissions in the sectors under its binding 2030 target are above their 2005 level. We have read only the quoted paragraph of the statement, not the rest, so we cannot say whether it addresses this elsewhere.
- Verdict: largely supported (moderate confidence). The substance, strong decoupling, is backed by the data. The headline “80%” holds only at current prices; in volumes it is about 70%.
- Supported
- Largely supported
- Not substantiated
- Misleading
- Contradicted
What would move the verdict up
None: this is not the top of the scale only because of the price basis. Supported would need the statement, or a published government source, to name a basis on which “more than 80%” holds and say so.
What would move it down
Evidence that the government’s own source uses volumes and obtains a different result; or the rest of the statement presenting the figures without the context needed to read them (then Misleading would have to be tested, as in CC-003).
IN THIS REPORT
1 The claim and what we could verify
The wording comes from “COP30 Malta National Statement” on the UNFCCC site [1] (a Word document behind a .pdf address). The wording is the paragraph supplied by the maintainer on 5 October 2026 and recorded in literature/CC-025/primary-source.md; the supplied text covers the opening line and the paragraph quoted above. Our own download of the file was refused by a bot check: on 6 October 2026 the address still returned a 212-byte HTML page, not the document. We therefore could not check the wording against the file ourselves. The statement was delivered on behalf of Malta’s Minister for the Environment, Energy and Public Cleanliness; the text we have does not name the person who read it, so we attribute it to the Government of Malta.
| Source | What it says | Our access | Status |
|---|---|---|---|
| Government of Malta, COP30 national statement, Nov 2025 [1] | “Importantly, Malta has already reduced its per capita emissions by over 44% compared to 2005 and emissions per unit of GDP by more than 80%, demonstrating our commitment to decoupling growth from emissions.” | The paragraph, as supplied by the maintainer (5 Oct 2026); our download was refused. Rest of the statement not read. | The claim |
| Climate Action Authority, press release, 13 Nov 2025 (CC-003) [2] | Per-capita fall of 44% (EU 34%); emissions per unit of GDP down 81.6% (EU 61.9%). Different speaker, same figures, same week. | Read in CC-003 (Wayback copy). | Context |
| Eurostat, env_air_gge, nama_10_gdp, nama_10_pe [3–5] | Emissions inventory, GDP in current prices and chain-linked volumes, population. | Downloaded 5 Oct 2026 (data/cc-025/). | Primary data |
2 Method
Question. Are the two figures accurate, and does the sentence fairly describe “decoupling growth from emissions”?
Evidence. The test is statistical. On 5 October 2026 we downloaded Eurostat’s greenhouse-gas inventory (env_air_gge, total excluding land use and international transport, 1990–2024), GDP (nama_10_gdp, current prices and chain-linked volumes at 2020 prices) and population (nama_10_pe) for Malta and the EU-27 (tools/cc-025-report/fetch.py), and recomputed every percentage with a script (calc.py; outputs in data/cc-025/checks.csv). No Eurostat status flags apply to the Malta values used. The statement gives no year and no GDP basis; we report 2023 (the last inventory year available in November 2025) and 2024. The 2024 emissions file is the same vintage as CC-003’s.
Why the GDP basis matters. Emissions per unit of GDP divides emissions by GDP. If GDP is measured in current prices, inflation inflates the denominator and the ratio falls faster than the economy’s real efficiency improves. Comparing intensity over time is normally done in volumes (prices of a fixed year), so that only real output is counted. Both are computable; they give different numbers.
Grades. Official statistics are grade C in our scale; the one peer-reviewed review used [8] is grade C (review) and is read as an abstract. Verdicts follow the five-point scale in Appendix A.
3 What the data show
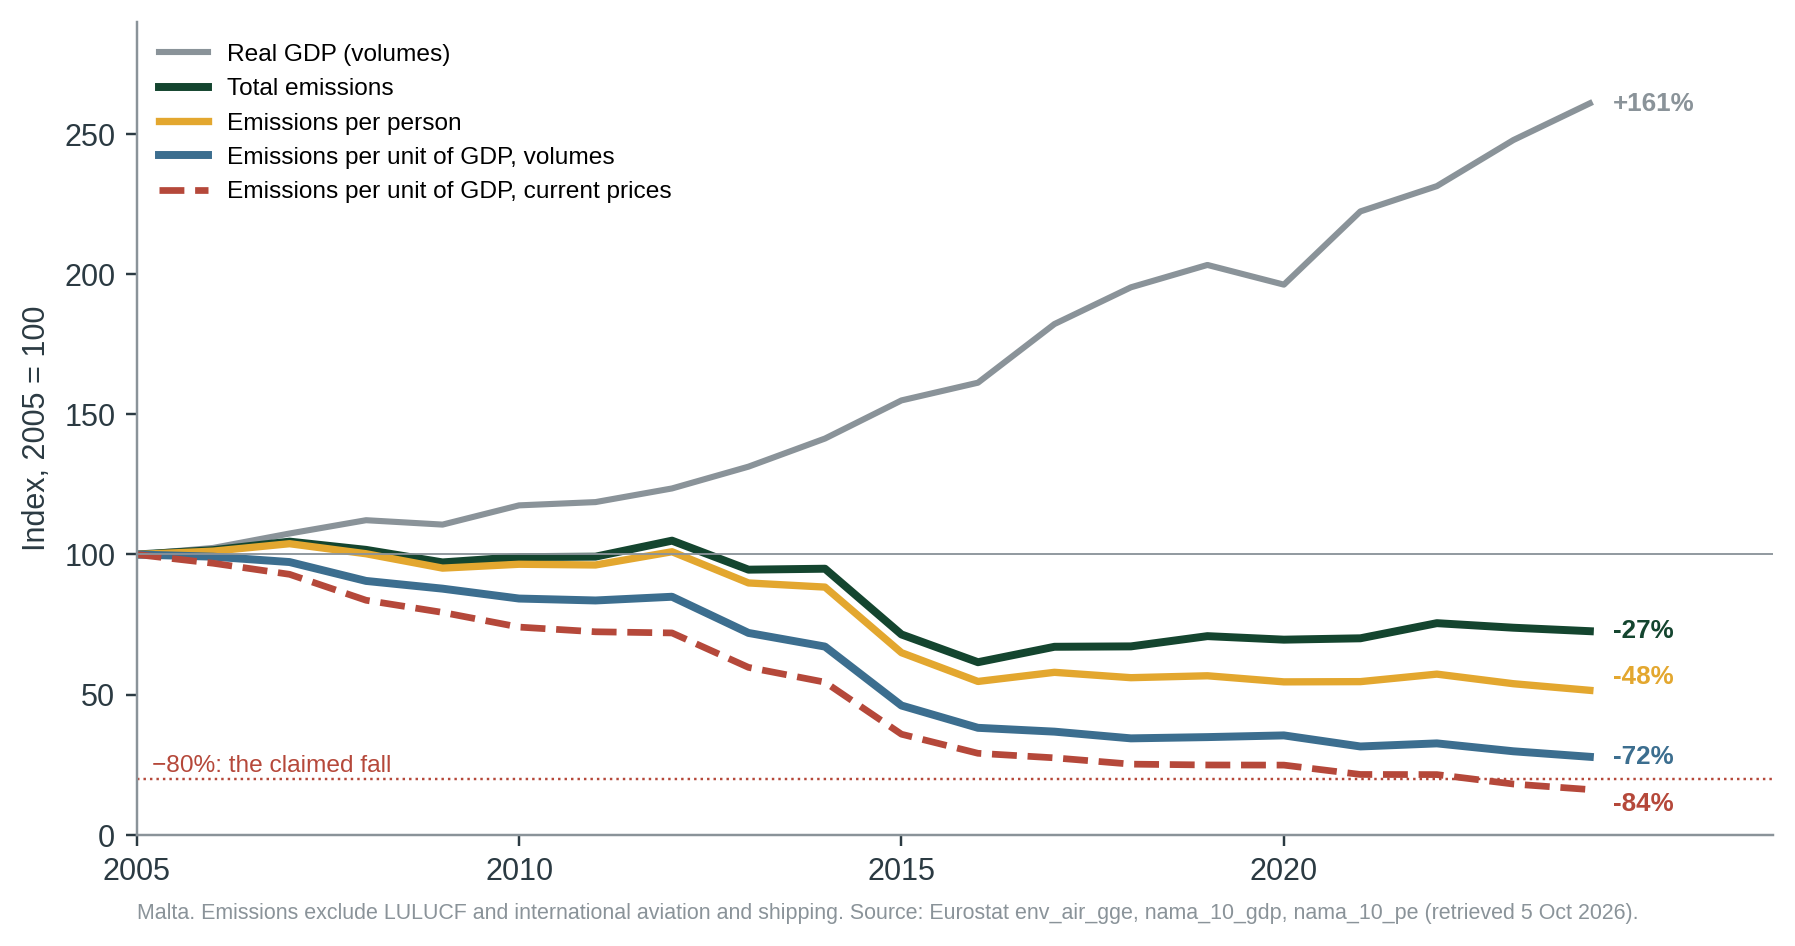
Malta’s real GDP grew 161% from 2005 to 2024, its population 41% and its total emissions fell 27%. Per person that is −48.5% (EU −36%), matching “over 44%”. Per unit of GDP it is −72% in volumes (EU −48%) and −84% at current prices (EU −65%). In 2023, the year the statement could have used, the figures are −70% and −82% (EU −46% and −62%).
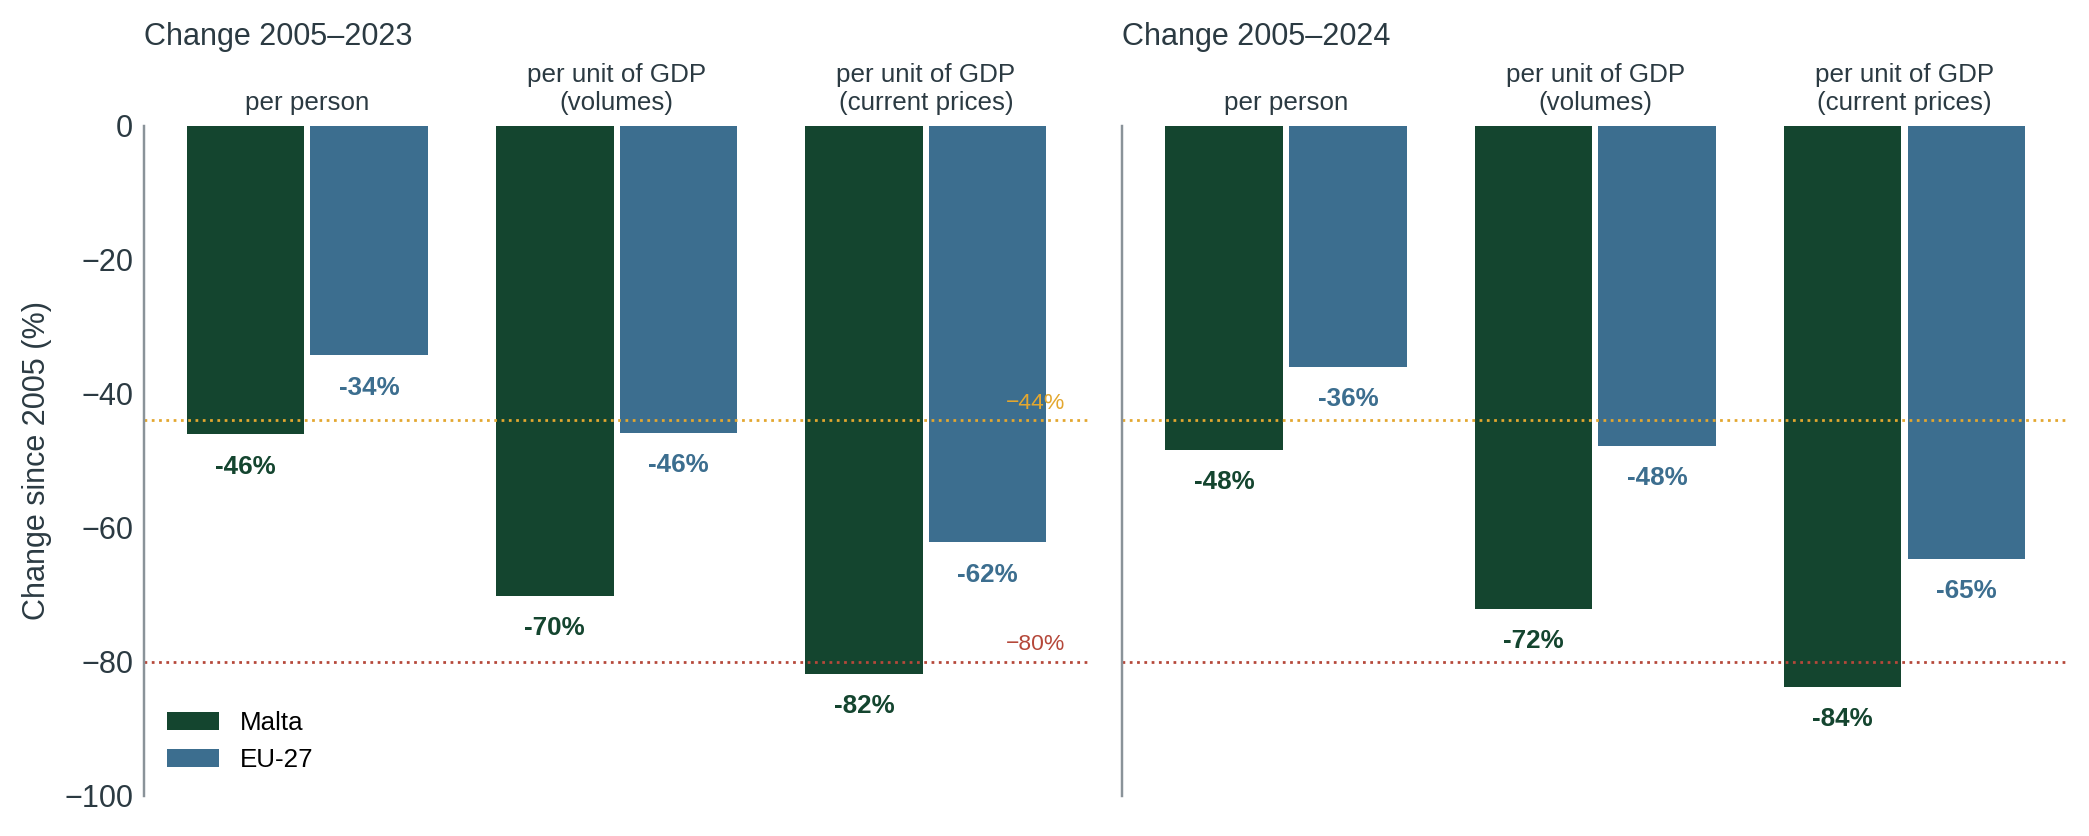
The Climate Action Authority’s “81.6% (EU 61.9%)” [2] is close to our current-price results for 2023 (−81.9%, EU −62.2%), which suggests the same basis. That is our inference; neither document states the basis.
4 Where the evidence points different ways
Is “decoupling growth from emissions” fair?
LARGELY YESEVIDENCE FOR THE CLAIM
Real GDP +161% while total emissions −27% (2005–2024). Absolute decoupling in this sense is unusual in the literature [8 ◆].
CAVEATS
The fall is concentrated in one step: after the 2015 interconnector and gas conversion (CC-003), total emissions reached a low in 2016 and have since risen 18% to 2024 (calc.py). Total emissions fell less than the EU average (−27% vs −33%). Emissions in the sectors under the national target are not falling (CC-003). Production-based inventory only: it excludes international aviation and shipping and emissions embodied in imports.
The same period on the residence basis. The statement counts territorial emissions (UNFCCC inventory basis): it names no basis, but its figures hold on that one, and this report uses it throughout. Eurostat’s air emissions accounts count emissions of Malta-resident units instead, including international aviation fuel bought abroad. On that basis (env_ac_ainah_r2, all activities and households, per person using nama_10_pe) Malta’s emissions per person rose 69% from 2013 to 2024 (7.2 to 12.2 t CO2e; the 2024 value is flagged imputed), the largest rise of the 27 Member States (rank 27 of 27; the EU-27 fell 21%; four others also rose, Lithuania next at +18.5%). Total residence-basis emissions rose 126% against population +34%. This does not contradict the statement, which is about the territorial inventory and a different start year (2005; this series begins in our extract at 2013), and it is why we keep Largely supported. It is context a reader needs: the territorial fall and the residence-basis rise are both real. CC-114 differs because it draws a causal inference from the residence-basis series that the data contradict. Data: data/cc-025/residence_basis_per_person.csv.
5 Testing the claim
| Sub-claim | Said by | What the evidence shows | Rating |
|---|---|---|---|
| A. Per-capita emissions down over 44% since 2005 | Govt of Malta [1] | Reproduced from Eurostat: −46% to 2023, −48.5% to 2024; Malta passed −44% in 2016. The same figure was checked in CC-003. About half of it is population growth. | ACCURATE |
| B. Emissions per unit of GDP down more than 80% | Govt of Malta [1] | Holds at current prices (−82% to 2023, −84% to 2024). In chain-linked volumes it is −70% and −72%; no year reaches −80%. The statement names neither basis. | TRUE ONLY AT CURRENT PRICES |
| C. …demonstrating our commitment to decoupling growth from emissions | Govt of Malta [1] | Real GDP +161%, total emissions −27%: absolute decoupling over 2005–2024. A statement of commitment is not itself testable; the data show the decoupling it refers to. | SUPPORTED |
6 Verdict and requests for evidence
The substance, strong decoupling, is backed by the data; the “80%” holds only at current prices. Confidence: moderate.
Why. (1) The 44% figure is accurate and matches Eurostat and CC-003. (2) The “more than 80%” figure is reproducible only with GDP at current prices; in volumes the fall is about 70–72%. That is a caveat on the size of the figure, not on its direction: Malta’s intensity fell much more than the EU’s on either basis. (3) Real GDP more than doubled while emissions fell, which is the decoupling the sentence describes. We rate the whole claim Largely supported rather than Supported because the headline figure is stated without the basis it needs, and it overstates the fall by about ten points on the usual basis. Confidence is moderate because we have read the supplied paragraph only, and the statement’s own source and method are not published.
Why a ten-point overstatement is a minor caveat under the scale. The scale reserves Not substantiated, Misleading and Contradicted for claims whose central figure fails, or whose framing would leave a reader with a wrong picture. Here the 44% figure is right, the decoupling the sentence draws from it holds (real GDP +161%, emissions −27%), and “more than 80%” is reproducible from Eurostat on a stated, computable basis (current prices: −82% and −84%). The shortfall in volumes (−70% and −72%, so 8 to 10 points below the claim) changes the size of one figure, not the conclusion that Malta’s intensity fell steeply and faster than the EU’s on either basis. What would have made this Not substantiated: no basis, in any year, on which the figure could be reproduced; or evidence that the government’s own source uses volumes and obtains a different result. We also keep this consistent with CC-003, which rated the Climate Action Authority’s release Misleading on a different ground (it left out the Commission’s 2030 projection), not on the accuracy of these figures.
What this verdict does not say. It does not say Malta is on course for its 2030 target, which is a separate question (CC-003: Misleading for the authority’s release, which left out the projection; CC-094; CC-011). It does not say anyone chose the current-price basis to flatter the result: we found no document stating the basis. A fuller statement would read: “Emissions per person fell 44% and per unit of GDP about 70% in real terms, while real GDP more than doubled; total emissions fell 27%.”
Evidence we are asking for
- The source and method for “over 44%” and “more than 80%”, including the year, the emissions scope and whether GDP is in current prices or volumes.
- The full text of the statement, to check whether it mentions the 2030 effort-sharing projection.
- The name of the person who delivered the statement, if it is to be attributed beyond the Government of Malta.
7 Limitations
- We read only the paragraph supplied by the maintainer; our own download of the UNFCCC file was refused by a bot check (on 6 October 2026 it still returned a 212-byte HTML page). The wording is therefore not independently verified against the file, and other parts of the statement may qualify or add to it.
- The statement gives no year, scope or GDP basis. The choice of 2023 and 2024 is our assumption (2023 was the latest inventory year in November 2025); we report both, and the Eurostat total excluding land use and international transport (TOTX4_MEMO). Eurostat’s other total (TOTXMEMO) changes Malta’s intensity results by 0.1 point or less (EU-27: up to 0.8 points).
- Eurostat’s 2026 inventory may differ slightly from the national submission behind the statement.
- The literature [8] was read as an abstract only; it is context for the word “decoupling”, not evidence for the figures.
- Production-based emissions only: emissions embodied in imports and international aviation and shipping are outside the series.
References
- [1] Government of Malta (Nov 2025). COP30 Malta National Statement, high-level segment. UNFCCC. (Quoted paragraph as supplied by the maintainer, 5 Oct 2026; file is a Word document behind a .pdf address.) https://unfccc.int/sites/default/files/resource/MALTA_cop30cmp20cma7_HLS_ENG.pdf
- [2] Climate Action Authority (13 Nov 2025). Malta strengthens its contribution toward the EU’s climate goals. Press release (read in CC-003 from a Wayback copy). https://climateaction.gov.mt/press/malta-strengthens-its-contribution-toward-the-eus-climate-goals/
- [3] Eurostat. Greenhouse gas emissions by source sector (env_air_gge), retrieved 5 Oct 2026. https://ec.europa.eu/eurostat/databrowser/view/env_air_gge/default/table
- [4] Eurostat. GDP and main components (nama_10_gdp), updated 2 Oct 2026, retrieved 5 Oct 2026. https://ec.europa.eu/eurostat/databrowser/view/nama_10_gdp/default/table
- [5] Eurostat. Population and employment (nama_10_pe), retrieved 5 Oct 2026. https://ec.europa.eu/eurostat/databrowser/view/nama_10_pe/default/table
- [6] MiŻien. CC-003 report and data (per-person figure, 2030 projection): claims/CC-003; data/cc-003/.
- [7] MiŻien. Calculation script and outputs: tools/cc-025-report/calc.py; data/cc-025/checks.csv; residence-basis figures: tools/cc-025-report/residence_basis.py; data/cc-025/residence_basis_per_person.csv (Eurostat env_ac_ainah_r2, nama_10_pe, retrieved 6 Oct 2026).
- [8] Haberl H. et al. (2020). A systematic review of the evidence on decoupling of GDP, resource use and GHG emissions, part II: synthesizing the insights. Environmental Research Letters 15(6):065003. doi:10.1088/1748-9326/ab842a. (Abstract read; open access, CC BY.) https://doi.org/10.1088/1748-9326/ab842a
Appendix A: series standards and verdict scale
Every investigation in this series follows the same rules so that verdicts are comparable and challengeable.
| Verdict | Meaning |
|---|---|
| SUPPORTED | Evidence consistently backs the claim as stated. |
| LARGELY SUPPORTED | Backed by the evidence, with minor caveats that do not change the substance. |
| NOT SUBSTANTIATED | Stated more strongly than the evidence offered or available allows. May be true in some conditions but has not been shown. |
| MISLEADING | Omits material facts so that the overall impression is inaccurate, even if individual statements are defensible. |
| CONTRADICTED | The available evidence points against the claim. |
Confidence
High: multiple independent lines of evidence agree. Moderate: evidence is relevant but incomplete or indirect. Low: evidence is thin, second-hand or conflicting.
Evidence grades
A experiment · B observational study with a control or gradient · C review, guidance or official statistics · D assertion or anecdote. ◆ marks a source known only second-hand.
Standards
- Quote the speaker, not the headline, with outlet and date, and link the original where possible.
- Separate the claim from the evidence offered for it, and say who made which statement.
- Grade the evidence and show differing views side by side where the evidence is unsettled.
- State what we could not access or verify, and what would change the verdict either way.
- Ask for the missing evidence in specific, answerable requests.
- Offer a right of reply where a check finds a claim Not substantiated, Misleading or Contradicted (or a pledge Not measurable, Off track or Missed), before wider circulation, and append responses.
- Correct errors openly with a version number and change log.
- Whistle-blow only on evidence: a verdict of Misleading or Contradicted requires documents or data that can be shown, not inference.
- Check every side. Government, opposition, NGOs and developers are held to the same standard.
Appendix B: revision log
| Version | Date | Change |
|---|---|---|
| 1.0 | 5 Oct 2026 | First issue. Verdict Largely supported (moderate confidence); no right of reply needed. |
| 1.1 | 6 Oct 2026 | Corrections after audit: explained in section 6 why the roughly ten-point overstatement in volumes is a minor caveat and what would make the claim Not substantiated; recorded consistently that the wording is the maintainer-supplied paragraph and our own UNFCCC download was refused (HTML page returned on 6 Oct); stated the year choice as our assumption. Verdict unchanged; no right of reply needed. |
| 1.2 | 6 Oct 2026 | Added a paragraph in section 4 on the residence basis (Eurostat air emissions accounts): per-person emissions +69% 2013-2024, rank 27 of 27, so that the territorial basis of the statement is set beside it; cross-reference to CC-114. Verdict, confidence and sub-claim ratings unchanged; no right of reply needed. |
Sources and archived copies
-
Statement of Malta, COP30 High-Level Segment, UNFCCC, Nov 2025.
Original · fetched and fingerprinted 2026-10-10; no public snapshot yet
The claim. Delivered on the Minister's behalf. A Word file behind the .pdf address; paragraph supplied by the maintainer on 5 Oct 2026 (literature/CC-025/primary-source.md). Our own download was refused by a bot check (still an HTML page on 6 Oct 2026), so only the quoted paragraph was read and the wording is not independently verified. -
Greenhouse gas emissions by source sector (env_air_gge); GDP (nama_10_gdp); population (nama_10_pe), Eurostat, retrieved 5 Oct 2026.
Original · Archived copy
Primary data; extract and checks in data/cc-025/. -
Malta strengthens its contribution toward the EU's climate goals (CC-003), Climate Action Authority, 13 Nov 2025.
Original · Archived copy
Same 44% figure and 81.6% (EU 61.9%) per unit of GDP, from a different speaker; read in CC-003 (Wayback copy).
Right of reply
Not needed: this check finds the claim supported. A right of reply is sought when a check finds a claim Not substantiated, Misleading or Contradicted.
Connections
How this claim relates to the others: who made it, the themes it shares with other claims, and the patterns it shows. A connection is a reason to read two checks side by side. It does not make either one right or wrong. How connections are found.
Who made it
Other claims by Government of Malta 39
- CC-003 Per-capita emissions vs 2030 projection (Misleading)
- CC-004 'Strong progress' in waste separation (Not substantiated)
- CC-006 Spring hunting derogation (Not substantiated)
- CC-010 Tree-planting counts (Largely supported)
- CC-012 Ta' Qali gravel and grass (Contradicted)
- CC-016 Shore-to-ship: 90% less harbour pollution (Misleading)
- CC-017 Land reclamation outside the Freeport (Not substantiated)
- CC-021 Malta-Gozo tunnel traffic (not yet checked)
- CC-022 'Lowest electricity burden in the EU' (Largely supported)
- CC-023 Second interconnector by 2026 (not yet checked)
- CC-024 Renewables target for 2030 (Not substantiated)
- CC-027 Power cuts: heat, not generation (not yet checked)
- CC-029 First offshore wind farm (Largely supported)
- CC-031 Gozo, first climate-neutral region (Largely supported)
- CC-032 Solar flowers, first in Europe (Contradicted)
- CC-041 Sewage plants compliant by 2026 (not yet checked)
- CC-043 13 Blue Flag beaches (not yet checked)
- CC-044 2,400 tonnes from storm tunnels (not yet checked)
- CC-045 Do 20 km of tunnels manage flooding? (Not substantiated)
- CC-048 Sea urchins recovering (not yet checked)
- CC-051 'Over 30% of our seas protected' (Misleading)
- CC-054 Project Green: 100,000 m2 a year (not yet checked)
- CC-055 Manoel Island back to the public (Supported)
- CC-060 7,000 first-time buyers helped (not yet checked)
- CC-061 260 homes 30% below market (not yet checked)
- CC-064 Grand Harbour regeneration (not yet checked)
- CC-068 Marsaskala marina shelved (not yet checked)
- CC-069 82 million bus trips (not yet checked)
- CC-072 EUR 15m to take cars off the road (not yet checked)
- CC-073 Cab trips up 68% (not yet checked)
- CC-077 Metro: first section early 2030s (not yet checked)
- CC-078 Gozo Channel: +511,000 passengers (not yet checked)
- CC-083 Record tourism, 'future-proofed' (not yet checked)
- CC-086 Comino kiosks tendered from 2026 (pledge: Missed)
- CC-087 177 illegal short lets (not yet checked)
- CC-090 20 heat-linked deaths (not yet checked)
- CC-095 EUR 400m to keep bills low (Not substantiated)
- CC-096 Fish farms moved 6 km offshore (not yet checked)
- CC-103 Heat-death locations "within three months" (not yet checked)
Linked directly 5
Claims that share a theme with this one. A theme is a cause, a mechanism, a target or a way of presenting figures that the editors have found in several claims; its strength says how close the link is.
Selective-metric pattern Rhetorical pattern · Pattern, not causal
A favourable metric is cited while the regulator-relevant metric looks worse. Useful for tagging, not for implying a common cause.
2030 carbon target Shared target · Weak (indicative)
The Climate Action Authority and the 2026 Labour manifesto (priority 18) both state a 40% cut in carbon emissions by 2030 against 2005, without saying whether it covers total or effort-sharing emissions.
Same pattern
Pattern tags name a recurring way a claim can mislead. They describe the statement, not the speaker.
Selective metric
A favourable metric is cited while the regulator-relevant metric looks worse.
- CC-002 Comino tree compensation (Largely supported)
- CC-003 Per-capita emissions vs 2030 projection (Misleading)
- CC-004 'Strong progress' in waste separation (Not substantiated)
- CC-009 More RO, less WSC groundwater (Largely supported)
- CC-026 EU's largest rise in emissions (Largely supported)
- CC-079 Waste-to-energy: 4.5% of energy (Misleading)
- CC-114 PN: only EU state with rising emissions intensity (Misleading)
Two steps away 15
Not linked to this claim directly, but linked to a claim that is. These are found by following the links, not chosen by the editors, so they are looser: they show where one theme meets another.
- CC-004 'Strong progress' in waste separation (Not substantiated)through 2030 carbon targetCC-003Selective-metric pattern
- CC-007 Within EU limits vs WHO guideline (Largely supported)through 2030 carbon targetCC-003Transport, air and climate
- CC-008 Flyovers and congestion (Not substantiated)through 2030 carbon targetCC-003Transport, air and climate
- CC-010 Tree-planting counts (Largely supported)through 2030 carbon targetCC-003Selective-metric pattern
- CC-011 Ten minutes' walk to green space (pledge: Not measurable)through 2030 carbon targetCC-0032030 carbon target
- CC-016 Shore-to-ship: 90% less harbour pollution (Misleading)through 2030 carbon targetCC-003Transport, air and climate
- CC-021 Malta-Gozo tunnel traffic (not yet checked)through 2030 carbon targetCC-003Transport, air and climate
- CC-031 Gozo, first climate-neutral region (Largely supported)through Selective-metric patternCC-026Shared emissions figures
- CC-051 'Over 30% of our seas protected' (Misleading)through Selective-metric patternCC-022Selective-metric pattern
- CC-094 Commission: Malta to emit more in 2030 than in 2005 (Supported)through 2030 carbon targetCC-0032030 carbon target or Selective-metric patternCC-1142030 carbon target
- CC-095 EUR 400m to keep bills low (Not substantiated)through Selective-metric patternCC-022Energy subsidies
- CC-109 EU: transport is 48% of effort-sharing emissions (Largely supported)through 2030 carbon targetCC-0032030 carbon target
- CC-110 EU: 37.7% of new cars zero-emission (Supported)through Selective-metric patternCC-026Transport, air and climate
- CC-113 EEA: Malta among highest fossil-fuel subsidies relative to GDP (Largely supported)through Selective-metric patternCC-022Energy subsidies
- CC-124 CCPI 2026: Malta 25th, car use not down (Largely supported)through Selective-metric patternCC-022Energy subsidies
Three steps away 25
One step further again. At this distance a connection says more about how the themes fit together than about this claim.
- CC-001 Upper Barrakka concrete (Not substantiated)through 2030 carbon targetCC-003Transport, air and climateCC-008Sealed soil and concrete
- CC-002 Comino tree compensation (Largely supported)through 2030 carbon targetCC-003Selective-metric patternCC-004Waste and construction
- CC-012 Ta' Qali gravel and grass (Contradicted)through 2030 carbon targetCC-003Transport, air and climateCC-008Sealed soil and concrete
- CC-017 Land reclamation outside the Freeport (Not substantiated)through 2030 carbon targetCC-003Selective-metric patternCC-004Waste and construction
- CC-019 830,000 m2 of land lost in five years (Not substantiated)through 2030 carbon targetCC-003Transport, air and climateCC-008Sealed soil and concrete
- CC-020 EP study: noise law not the cause (Largely supported)through 2030 carbon targetCC-003Transport, air and climateCC-007Compliance-not-health pattern
- CC-024 Renewables target for 2030 (Not substantiated)through 2030 carbon targetCC-0032030 carbon targetCC-0112030 carbon target
- CC-029 First offshore wind farm (Largely supported)through Selective-metric patternCC-022Energy subsidiesCC-124Renewables delivery
- CC-033 Delimara: 'much cleaner air' (not yet checked)through 2030 carbon targetCC-003Transport, air and climateCC-007Compliance-not-health pattern
- CC-035 PM2.5 death rate down two-thirds (Largely supported)through 2030 carbon targetCC-003Transport, air and climateCC-007Transport, air and climate
- CC-054 Project Green: 100,000 m2 a year (not yet checked)through 2030 carbon targetCC-003Selective-metric patternCC-010Replanting as currency
- CC-056 Central Link: 'only 254 trees' (not yet checked)through 2030 carbon targetCC-003Transport, air and climateCC-008Replanting as currency
- CC-057 1,649 compensation trees (not yet checked)through 2030 carbon targetCC-003Selective-metric patternCC-010Replanting as currency
- CC-069 82 million bus trips (not yet checked)through 2030 carbon targetCC-003Transport, air and climateCC-008Transport, air and climate
- CC-072 EUR 15m to take cars off the road (not yet checked)through 2030 carbon targetCC-003Transport, air and climateCC-008Transport, air and climate
- CC-075 Seventh in the EU for cars (Misleading)through Selective-metric patternCC-026Transport, air and climateCC-110Transport, air and climate
- CC-076 36 more vehicles a day (Supported)through 2030 carbon targetCC-003Transport, air and climateCC-008Transport, air and climate
- CC-079 Waste-to-energy: 4.5% of energy (Misleading)through 2030 carbon targetCC-003Selective-metric patternCC-004Waste and construction
- CC-081 Landfill share rising (not yet checked)through 2030 carbon targetCC-003Selective-metric patternCC-004Waste and construction
- CC-092 PN: afforestation in a net-zero Gozo (pledge: Not measurable)through Selective-metric patternCC-026Shared emissions figuresCC-031Net-zero Gozo
- CC-107 A net-zero Gozo by 2040 (pledge: Not measurable)through Selective-metric patternCC-026Shared emissions figuresCC-031Net-zero Gozo
- CC-111 EU: 621 kg of waste a head, 74% landfilled (Supported)through 2030 carbon targetCC-003Selective-metric patternCC-004Waste and construction
- CC-115 Chamber: congestion cost EUR 770m, 3.4% of GDP (Not substantiated)through 2030 carbon targetCC-003Transport, air and climateCC-008Transport, air and climate
- CC-117 EU: Malta missed recycling targets (reasoned opinion) (not yet checked)through 2030 carbon targetCC-003Selective-metric patternCC-004Waste and construction
- CC-119 Council: renewables 17.2% of energy, almost all solar (not yet checked)through Selective-metric patternCC-022Energy subsidiesCC-124Renewables delivery
Similar wording
Claims whose own words overlap with this one, with the words they share. Found by comparing the wording of the claims, not their verdicts; a lead to read them together, not a finding.
- CC-003 Per-capita emissions vs 2030 projection (Misleading)shares: capita, emissions
Timeline
What was said, what was published before and after it, and each step of this check, in date order. Statements and sources carry the date they were published. The steps of the check carry the date the research was done, from the check's research log. Other statements by the same body on the same topic show whether a position was repeated, changed or corrected.
2020
- 2020 Evidence published A systematic review of the evidence on decoupling of GDP, resource use and GHG emissions, part II (Haberl et al.), Environmental Research Letters
2024
- December 2024 Earlier statement by Government of Malta on Climate & Energy CC-024 Renewables target for 2030 (Not substantiated)
2025
- 6 May 2025 Earlier statement by Ministry for the Environment on Climate & Energy CC-022 'Lowest electricity burden in the EU' (Largely supported)
- 22 July 2025 Earlier statement by Ministry for the Environment on Climate & Energy CC-029 First offshore wind farm (Largely supported)
- 21 October 2025 Earlier statement by Clint Camilleri and Parliamentary Secretariat for Public Works on Climate & Energy CC-032 Solar flowers, first in Europe (Contradicted)
- 13 November 2025 Earlier statement by Ministry for the Environment on Climate & Energy CC-003 Per-capita emissions vs 2030 projection (Misleading)
- November 2025 The statement Government of Malta (this claim)
- November 2025 Statement published Statement of Malta, COP30 High-Level Segment, UNFCCC
- November 2025 Statement published COP30 Malta National Statement (high-level segment), Government of Malta / UNFCCC
2026
- 21 July 2026 Later statement by Miriam Dalli and Robert Abela on Climate & Energy CC-027 Power cuts: heat, not generation (not yet checked)
- 25 September 2026 Later statement by Clint Camilleri on Climate & Energy CC-031 Gozo, first climate-neutral region (Largely supported)
- 30 September 2026 Later statement by Clyde Caruana on Climate & Energy CC-095 EUR 400m to keep bills low (Not substantiated)
- 4 October 2026 Added to the claims to check
- 5 October 2026 Exact wording found Verbatim wording supplied by the maintainer (COP30 Malta National Statement, UNFCCC; Word file behind a .pdf address). Our own download was refused by a bot check. Attributed to the Government of Malta.
- 5 October 2026 Note Eurostat env_air_gge, nama_10_gdp (current prices and chain-linked volumes) and nama_10_pe downloaded; per-person and per-GDP changes recomputed (tools/cc-025-report/calc.py). Per-person figure matches CC-003. Per-GDP: -82%/-84% at current prices, -70%/-72% in volumes.
- 5 October 2026 Version 1.0: first issue First issue. Verdict Largely supported (moderate confidence); no right of reply needed.
- 6 October 2026 Version 1.1 1.1: corrections after the 6 Oct 2026 audit: verdict rationale, consistent record of how the wording was obtained, year choice disclosed. Verdict unchanged (Largely supported, moderate); no right of reply needed.
- 6 October 2026 Version 1.2 1.2: residence-basis context added (report section 4, caveats, counter_evidence, cross-reference to CC-114). Verdict unchanged (Largely supported, moderate); no right of reply needed. Verdict in this version: Largely supported, moderate confidence.
- 6 October 2026 Evidence reviewed
- 6 October 2026 Correction Verdict rationale (report section 6): added why the 8-10 point overstatement in volumes (-70%/-72% against 'more than 80%') is a minor caveat under the scale, what would have made it Not substantiated, and the consistency with CC-003 (Misleading on a different ground). Verdict unchanged. all corrections
- 6 October 2026 Clarification Records made consistent: the wording is the maintainer-supplied paragraph; our own UNFCCC download was refused (re-tested 6 Oct 2026: 212-byte HTML page, not the .docx). Withdrew the earlier statement in literature/CC-025/primary-source.md that the file was read with a script. Report now discloses in one place that the wording is not independently verified and that the 2023/2024 year choice is our assumption. all corrections
- 6 October 2026 Clarification Added context on the residence basis (Eurostat air emissions accounts, env_ac_ainah_r2, all activities and households; population nama_10_pe, retrieved 6 Oct 2026): per-person emissions +69.2% 2013-2024 (7.2 to 12.2 t CO2e; 2024 flagged imputed), rank 27 of 27 (EU-27 -21.2%; Latvia, Romania, Croatia and Lithuania also rose). Matches the CC-114 audit figure when households are included (the activities-only total gives +77%). The claim uses the territorial basis, so verdict, confidence and sub-claim ratings are unchanged. New paragraph in report section 4; caveats and counter_evidence extended. all corrections
2027
- 6 October 2027 Coming up: Evidence review due Each finished check is reviewed against new evidence within a year.
Every change to this claim's record is public: history of the record.
Download the report and flyer