CC-071 · Transport · Public transport
EUR 100m a year for free buses
Not substantiated Low confidence Draft: right of reply pending
Parts of this claim
The claim is split into parts that are tested separately, as in the report below. Each part has its own number.
- CC-071A The system cost “almost €100 million in 2025” (headline: “reaches €100 million a year”) (The Shift [1])The article’s own components sum to €93.4 million, 6.6% under €100 million; €3.2 million is bus investment. The parliamentary reply was not read; Newsbook reports the same document ◆ [2].
- CC-071B Payments are the highest yet and still rising (The Shift [1])€36.3m, €42.8m, €69.4m, €84m, €93.4m for 2021–2025 as reported ◆ [1, 6]; bases may differ. Consistent with the article; not verified at source.
- CC-071C “Traffic congestion continues to worsen” (The Shift [1])TomTom Valletta-area congestion level 49.2% to 50.3% (+1.1 points), speed down 0.5 km/h; two years only, one area [5].
- CC-071D “Vehicle imports and private car use have continued to increase” (The Shift [1])Passenger cars +1.6% in 2025, +5.8% since 2022 [3]; but cars per 1,000 residents fell 610 to 585 [3, 4]. Imports and car use not measured by us.
- CC-071E The spending has brought “no measurable reduction in congestion” (the article’s framing) (The Shift’s experts [1])No counterfactual and no congestion series that straddles October 2022 in the sources we could read. Not tested.
Claim Check 071 · Transport
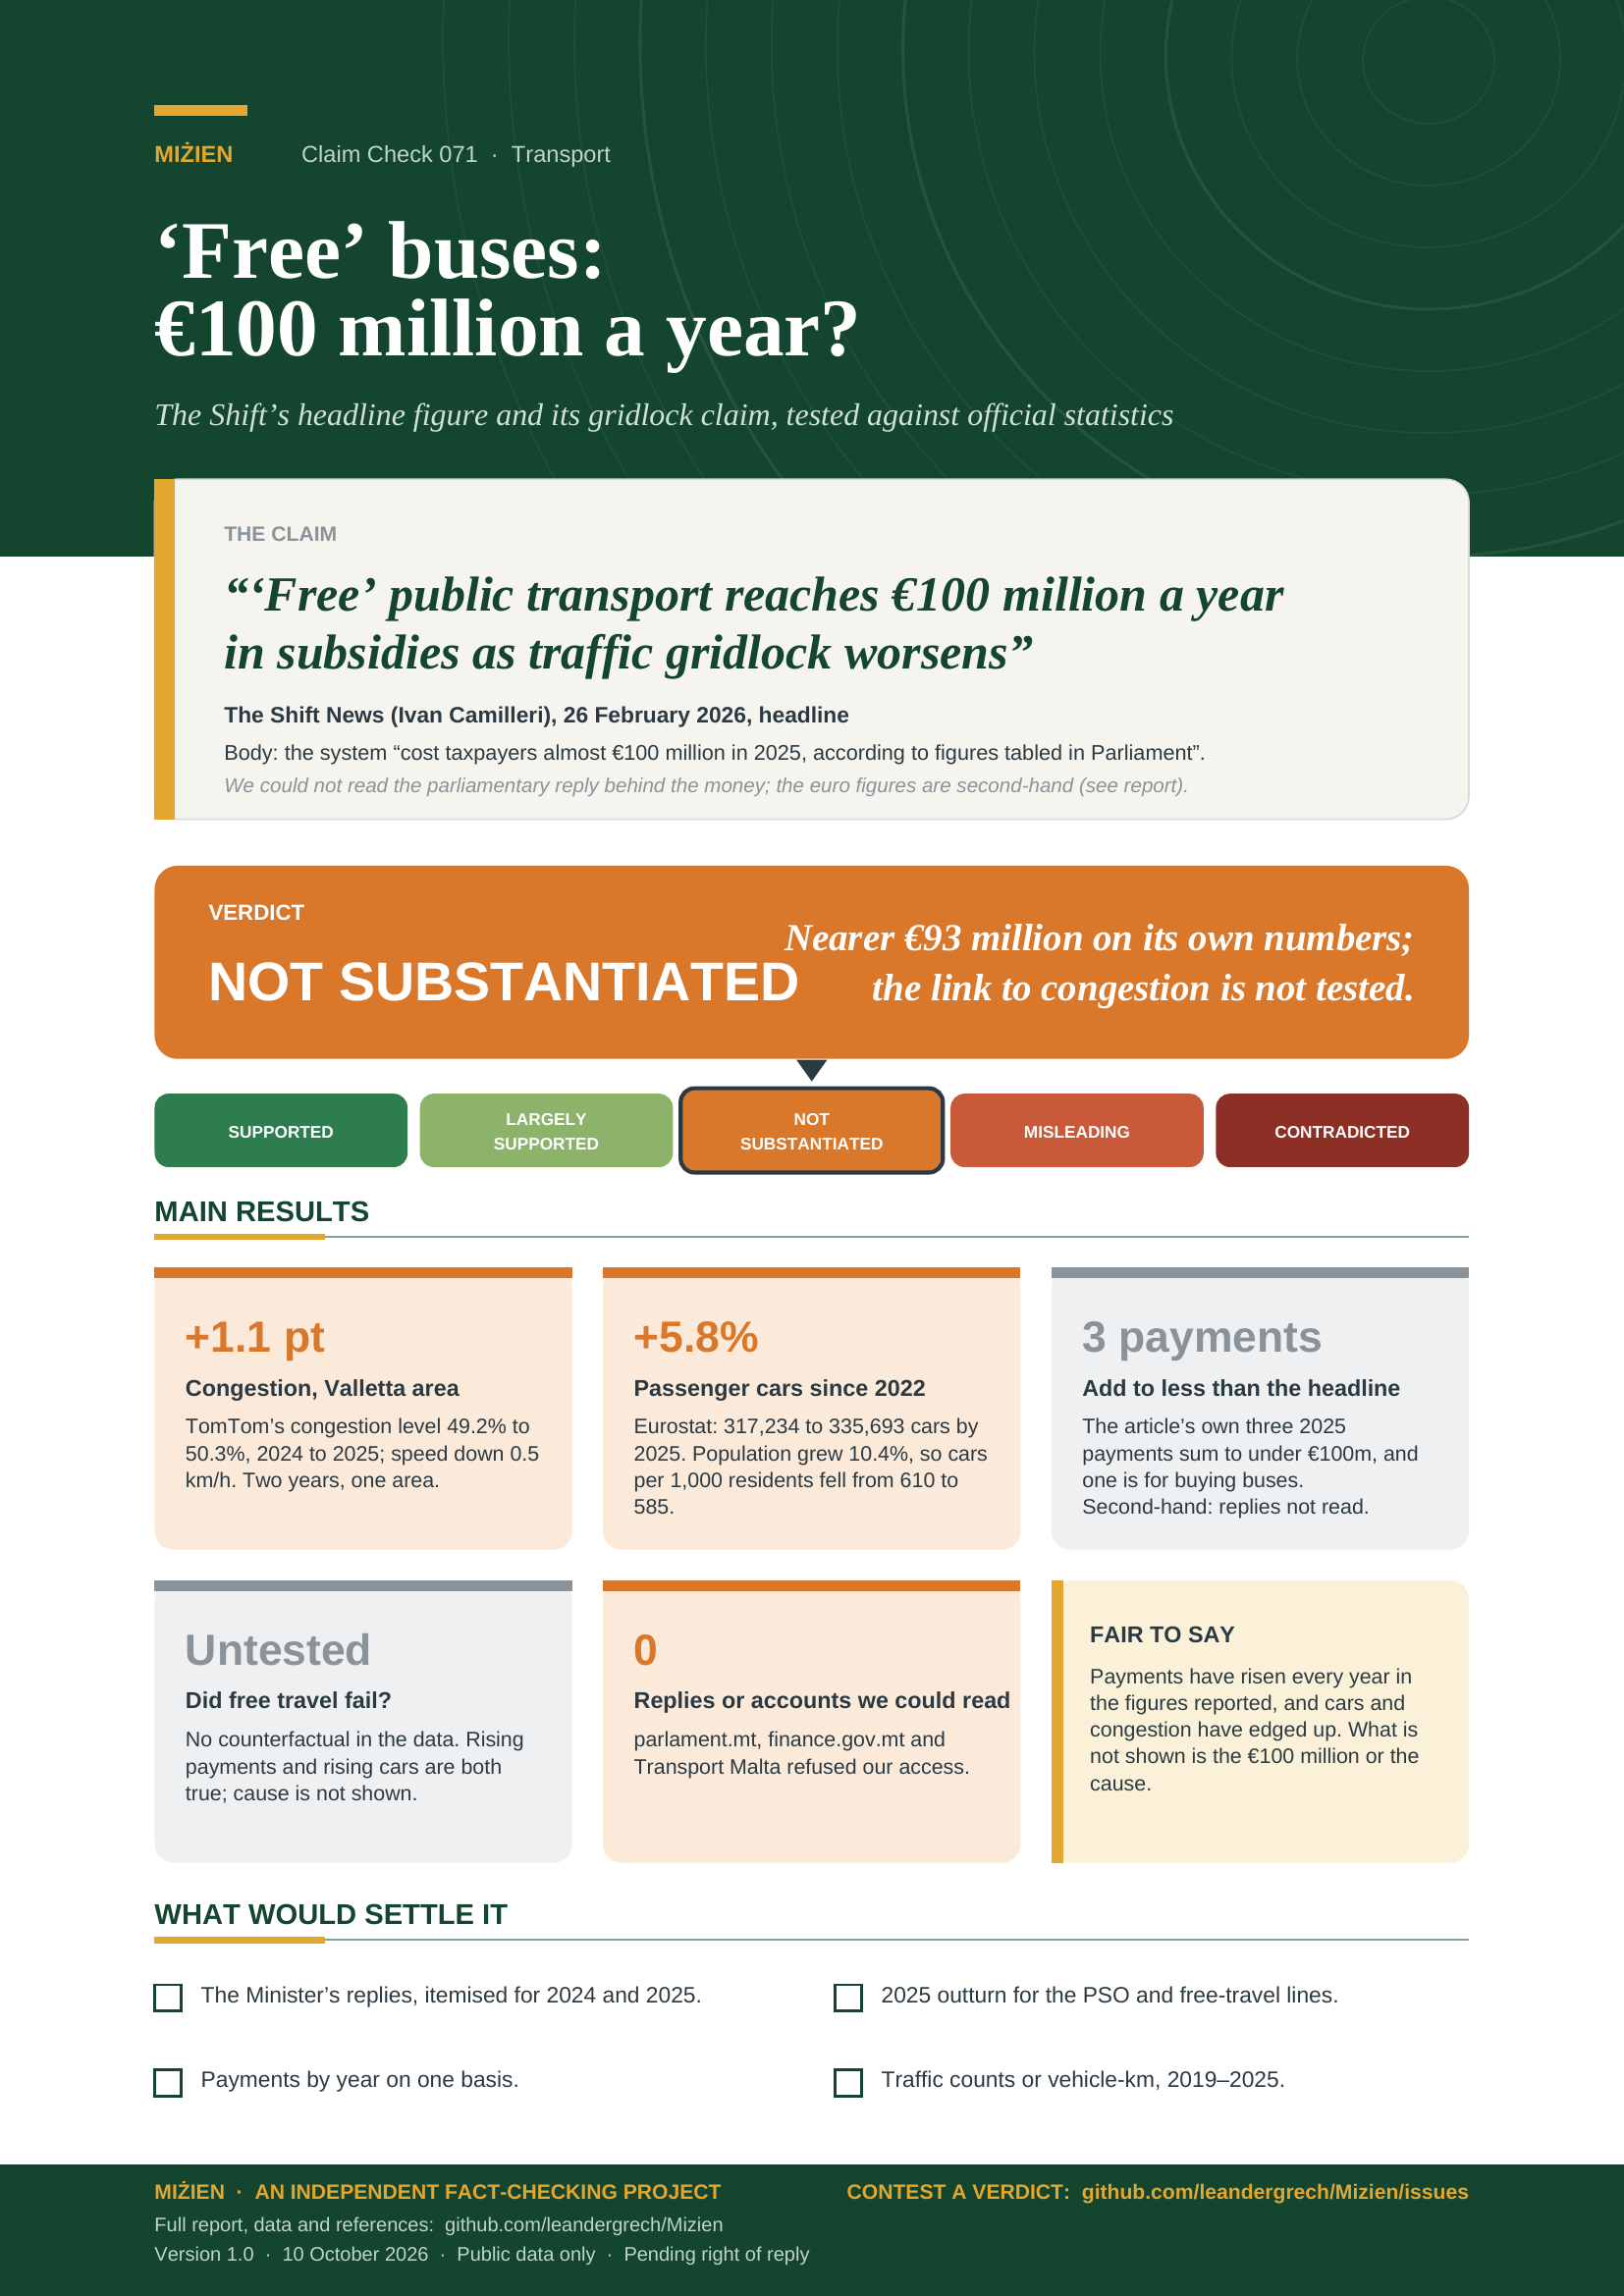
‘Free’ buses: €100 million a year?
Testing The Shift’s figure for public-transport subsidies and its claim that gridlock is worsening
“‘Free’ public transport reaches €100 million a year in subsidies as traffic gridlock worsens”
The Shift News (Ivan Camilleri), 26 February 2026, headline.
Body text: the system “cost taxpayers almost €100 million in 2025, according to figures tabled in Parliament”.
Verdict: Not substantiated Reply not read; link to congestion untested
Version 1.0 · 10 October 2026
TL;DR
On 26 February 2026 The Shift News (Ivan Camilleri) headlined an article “‘Free’ public transport reaches €100 million a year in subsidies as traffic gridlock worsens”. Its first sentence says that Malta’s “‘free’ public transport system cost taxpayers almost €100 million in 2025, according to figures tabled in Parliament” [1]. The speaker is the newspaper, so its article is the wording we test. We checked the money, the congestion claim and the link the article draws between them.
- The headline rounds up its own figures. The article gives three 2025 payments: €59 million, €31.2 million and €3.2 million [1]. They sum to €93.4 million, 6.6% under €100 million, and €3.2 million of it is for buying buses. The body says “almost”; the headline says “reaches”.
- We could not read the parliamentary reply behind the money. The figures come from replies by the Transport Minister to the PN’s Chris Said. Newsbook reports the same document in Maltese [2 ◆]. The reply itself, the Financial Estimates and the operator’s accounts were not available to us, so every euro figure is second-hand ◆.
- Congestion is up a little; the evidence for “gridlock” is thin. TomTom’s index puts the Valletta area’s congestion level at 50.3% in 2025, 1.1 points above 2024, with mean speed down 0.5 km/h [5]. Eurostat counts 1.6% more passenger cars in 2025 and 5.8% more than in 2022, but cars per 1,000 residents fell from 610 to 585 [3, 4].
- The article’s link between the two is not tested. Nothing in the data we could read shows what congestion would have been without free buses. The comparison is a juxtaposition, not a finding.
- Supported
- Largely supported
- Not substantiated
- Misleading
- Contradicted
What would move the verdict up
A move up to Largely supported would need the parliamentary reply (or the Financial Estimates or the operator’s accounts) confirming a 2025 total close to €100 million, and a congestion series of more than two years that rises.
What would move it down
A reply showing a total well under €93 million, or a longer congestion series that is flat or falling, would lower it. A source showing the figure includes items outside the scheme would also count.
1 The claim and what we could verify
The claim record summarised the article as “‘free’ public transport now costs about EUR 100 million a year in subsidies while traffic gridlock worsens”. We rate the article’s own words. Quoted words below are the Shift’s, as printed; the Shift’s account of the Minister’s replies is the Shift’s paraphrase and is not in quotation marks.
| Source | What it says | Our access | Status |
|---|---|---|---|
| The Shift News, Ivan Camilleri, 26 Feb 2026 [1] | “‘Free’ public transport reaches €100 million a year in subsidies as traffic gridlock worsens” (headline). Body: the system “cost taxpayers almost €100 million in 2025, according to figures tabled in Parliament”; components €59 million (PSO concession), €31.2 million (Tallinja card) and €3.2 million (new buses); €84 million in 2024; “traffic congestion continues to worsen”. | Read in full, 10 Oct 2026. | The claim (quoted words) |
| Newsbook, Christine Mamo, 27 Feb 2026 (Maltese) [2] | Reports the same document and the same figures (“kważi €100 miljun”, “almost €100 million”); adds that on average 35 vehicles a day are added to the roads. | Read in full. | Outlet report ◆ |
| Business Now, 18 Apr 2024 [6]; The Shift, 10 Feb 2024 [7] | Payments to Malta Public Transport: €36.3 million (2021), €42.8 million (2022), €69.4 million (2023, from information tabled in Parliament); Budget 2024 allocation €49 million (PSO) + €25 million (free-ride scheme). | Read in full. | Outlet reports ◆ |
| Eurostat road_eqs_carmot, demo_gind [3, 4] | Passenger cars at 31 December and population on 1 January for Malta, 2019–2025. | Downloaded 10 Oct 2026 (data/cc-071/). | Primary (official statistics) |
| TomTom Traffic Index, Valletta [5] | Annual congestion level and mean speed for the Valletta metro area, 2025 and the previous year. | Page data read 10 Oct 2026. | Primary (commercial dataset) |
2 Method
Questions. (A) Is the 2025 figure close to €100 million? (B) Has the payment risen year on year since free travel began? (C) Is traffic congestion worsening? (D) Have car numbers and car use gone on increasing? (E) Does the data show that the spending has failed to ease congestion, as the article’s framing implies?
Evidence. For A and B we added the components the Shift reports and compared them with the earlier payments reported by Business Now and the Shift (calc.py; data/cc-071/checks.csv, subsidy_series.csv). For C we read TomTom’s annual congestion level for the Valletta metro area. For D we took Eurostat’s count of passenger cars and the population on 1 January, and computed cars per 1,000 residents with both on the same year (Eurostat’s own rate uses the next 1 January; ours is like for like across years).
Limits. The euro figures rest on outlet reports of a document we did not read. TomTom’s index measures one metropolitan area, in two years that we could read, and is a commercial product; its “congestion level” is the extra travel time against free-flow conditions. Eurostat counts the stock of cars, not how much they are driven.
Grades. Eurostat counts are grade C (official statistics); TomTom is grade C (a documented commercial dataset, not audited); outlet reports of tabled figures are grade D. Verdicts follow Appendix A.
3 What the evidence shows
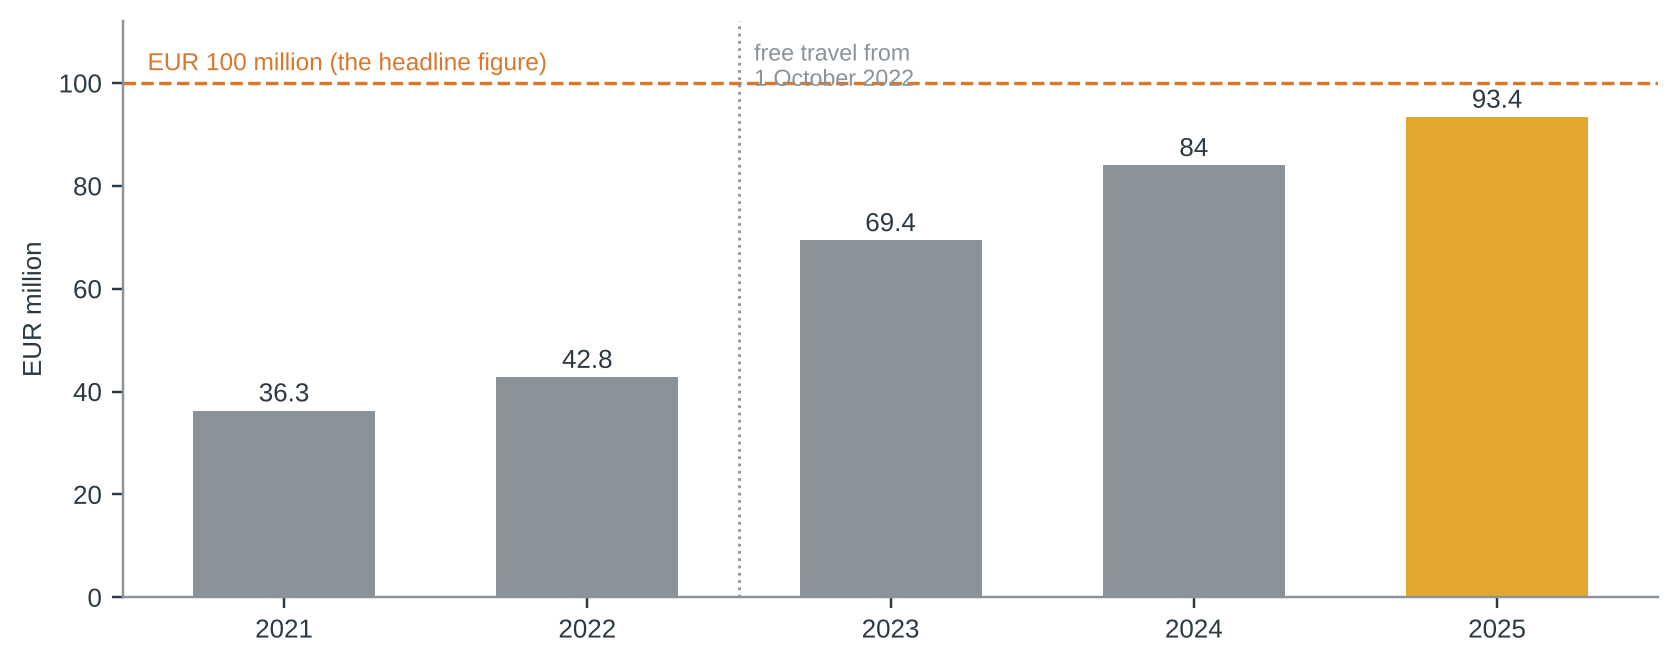
The money. The article’s three 2025 payments sum to €93.4 million (59.0 + 31.2 + 3.2). Operating payments alone, the concession fee and the Tallinja card, come to €90.2 million; the €3.2 million for buses is investment. The sum is 6.6% under €100 million and 11.2% above the €84 million the article gives for 2024 (calc.py). The earlier payments reported by Business Now were €36.3 million (2021), €42.8 million (2022) and €69.4 million (2023). If those series are on the same basis, payments have risen every year, and the 2025 sum is 34.6% above 2023. They may not be on the same basis: the 2023 figure is described as payments to the operator, the 2025 total as subsidies. The Shift’s “highest annual subsidy yet” is consistent with these numbers ◆.
Congestion. TomTom’s index for the Valletta metro area gives an annual average congestion level of 50.3% in 2025 against 49.2% in 2024, a rise of 1.1 percentage points, with mean speed of 27.6 km/h against 28.1 km/h [5]. That is a small, one-year rise in a single area. We read only those two years on TomTom’s page, so we cannot say whether it extends a longer trend. The article itself gives no congestion figure; its basis is “transport experts” and the rise in car numbers.
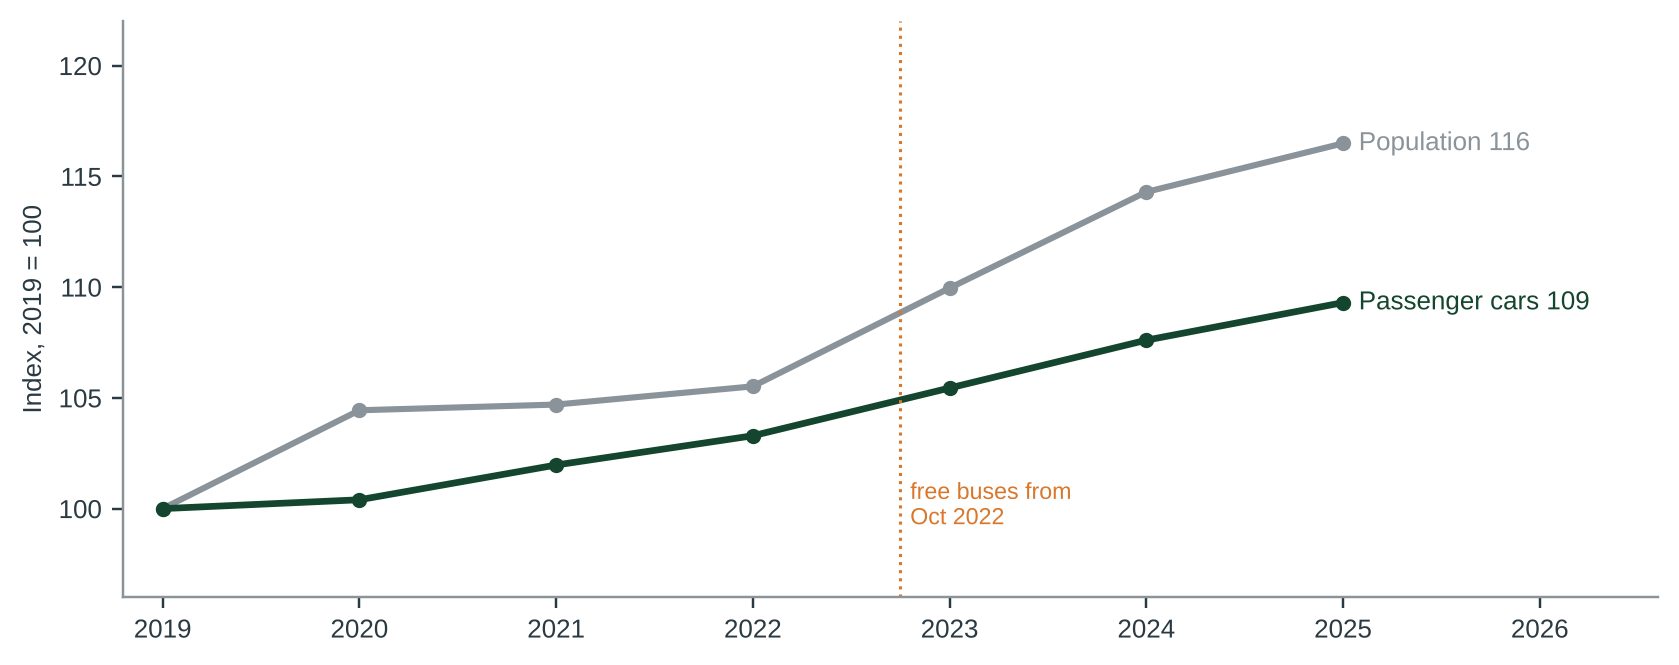
Cars. Eurostat counts 335,693 passenger cars at the end of 2025, 1.6% more than a year earlier and 5.8% more than at the end of 2022, the year free travel began [3]. Over 2019–2022 the stock grew 3.3% in three years. Population grew faster, by 10.4% from 1 January 2022 to 1 January 2025 [4], so cars per 1,000 residents fell from 610 to 585 on our like-for-like ratio. More cars on the roads, yes; more cars per person, no. Eurostat does not measure vehicle-kilometres, so “private car use” is not something we could test.
4 Where the evidence points different ways
Has free travel failed to ease congestion?
NOT SETTLEDTHE ARTICLE’S FRAMING
The article says that “vehicle imports and private car use have continued to increase” and that experts saw “no measurable reduction in congestion” [1]. In our data the car stock is up 5.8% since 2022 and TomTom’s congestion level is up 1.1 points in 2025 [3, 5].
WHAT ELSE THE DATA SHOW
Business Now reports bus passengers rose from 49.6 million in 2022 to 67.3 million in 2023, from a Transport Malta release we did not read ◆ [6]. Population grew 10.4% since 2022 and cars per 1,000 residents fell [3, 4]. More people using buses and fewer cars per person are compatible with congestion that is still rising, because the population is larger.
5 Testing the claim
| Sub-claim | Said by | What the evidence shows | Rating |
|---|---|---|---|
| A. The system cost “almost €100 million in 2025” (headline: “reaches €100 million a year”) | The Shift [1] | The article’s own components sum to €93.4 million, 6.6% under €100 million; €3.2 million is bus investment. The parliamentary reply was not read; Newsbook reports the same document ◆ [2]. | UNVERIFIED |
| B. Payments are the highest yet and still rising | The Shift [1] | €36.3m, €42.8m, €69.4m, €84m, €93.4m for 2021–2025 as reported ◆ [1, 6]; bases may differ. Consistent with the article; not verified at source. | CONSISTENT |
| C. “Traffic congestion continues to worsen” | The Shift [1] | TomTom Valletta-area congestion level 49.2% to 50.3% (+1.1 points), speed down 0.5 km/h; two years only, one area [5]. | PARTLY SUPPORTED |
| D. “Vehicle imports and private car use have continued to increase” | The Shift [1] | Passenger cars +1.6% in 2025, +5.8% since 2022 [3]; but cars per 1,000 residents fell 610 to 585 [3, 4]. Imports and car use not measured by us. | NEEDS CONTEXT |
| E. The spending has brought “no measurable reduction in congestion” (the article’s framing) | The Shift’s experts [1] | No counterfactual and no congestion series that straddles October 2022 in the sources we could read. Not tested. | NOT TESTED |
6 Verdict and requests for evidence
The figure is close to €93 million on the article’s own numbers, not €100 million, and we could not read the reply behind it; congestion is only slightly up and the link to free travel is not tested. Confidence: low.
Why. (1) The headline figure is stronger than the components under it, and the body’s “almost” is the more defensible wording. (2) Every euro figure rests on outlet reports of tabled replies, which we could not check at source. (3) Cars and one congestion index have edged up, but population grew faster, and the data in hand contain no counterfactual for the implied failure of the scheme. The rating applies to the claim as worded, which joins a spending figure to a trend in a single headline. It says nothing about the journalists’ motives, and the direction of the payments, upward each year, is consistent with every source we read. Confidence is low because the central figure is second-hand.
Evidence we are asking for
- From the Ministry (or Parliament): the text of the replies to Chris Said’s questions on payments to Malta Public Transport for 2024 and 2025, itemised.
- From the Ministry for Finance: the 2025 outturn and 2026 estimate for the public service obligation and free-travel lines.
- From Malta Public Transport or Transport Malta: payments received by year, with passenger numbers, on one consistent basis.
- From Transport Malta: vehicle-kilometre or traffic-count series for 2019–2025 on the main corridors.
7 Limitations
- The 2025 and 2024 payments, and the 2021–2023 series, are known only through the Shift, Newsbook and Business Now ◆. We did not read any parliamentary reply, budget document or account.
- The series in Figure 1 may mix bases (payments to the operator against subsidies as the Shift defines them). We did not verify what the Minister’s reply counts as a subsidy.
- TomTom’s index is for the Valletta metro area, not for Malta as a whole; we read its 2025 and previous-year values only. Sources conflict on earlier years in search summaries, which we do not use.
- Eurostat’s car count is a stock at 31 December; it does not measure how far cars are driven, so “car use” is untested. The 2025 values are the latest Eurostat release (6 Oct 2026) and may be revised.
- The Shift says there were 542,000 valid Tallinja cards “by the end of 2024” in 2026, and its 10 Feb 2024 article gave the same number for the end of the year before. We did not rate this.
- Newsbook’s figure of 35 vehicles a day (all vehicle types) was not tested; our passenger-car figure is 14 a day net in 2025.
- We rate the Shift’s wording. We did not rate its statements that few Maltese nationals are believed to use the buses or that experts questioned value for money.
References
- [1] Camilleri I. (26 Feb 2026). ‘Free’ public transport reaches €100 million a year in subsidies as traffic gridlock worsens. The Shift News. https://theshiftnews.com/2026/02/26/free-public-transport-reaches-e100-million-a-year-in-subsidies-as-traffic-gridlock-worsens/
- [2] Mamo C. (27 Feb 2026). Nefqa ta’ €100 miljun fis-sena għal trasport pubbliku b’xejn. Newsbook ◆ (outlet’s report of the parliamentary reply). https://newsbook.com.mt/nefqa-ta-e100-miljun-fis-sena-ghal-trasport-pubbliku-bxejn/
- [3] Eurostat. Passenger cars, by type of motor energy and size of engine (road_eqs_carmot), Malta, total. Retrieved 10 Oct 2026. https://doi.org/10.2908/ROAD_EQS_CARMOT
- [4] Eurostat. Population change – demographic balance and crude rates at national level (demo_gind), Malta, population on 1 January. Retrieved 10 Oct 2026. https://doi.org/10.2908/DEMO_GIND
- [5] TomTom. Traffic Index: Valletta traffic report, annual congestion level and mean speed, Valletta metro area. Read 10 Oct 2026. https://www.tomtom.com/traffic-index/city/valletta/
- [6] Fenech R. (18 Apr 2024). Government shells out close to €70 million to national bus operator Malta Public Transport in 2023. Business Now ◆. https://businessnow.mt/government-shells-out-close-to-e70-million-to-national-bus-operator-malta-public-transport-in-2023/
- [7] The Shift Team (10 Feb 2024). Tal-linja costing taxpayers €250 each in subsidies. The Shift News. https://theshiftnews.com/2024/02/10/tal-linja-costing-taxpayers-e250-each-in-subsidies/
- [8] Miżien. Calculation script and outputs: tools/cc-071-report/calc.py; data/cc-071/checks.csv, subsidy_series.csv, cars_population.csv, tomtom_valletta.csv.
Appendix A: series standards and verdict scale
Every investigation in this series follows the same rules so that verdicts are comparable and challengeable.
| Verdict | Meaning |
|---|---|
| SUPPORTED | Evidence consistently backs the claim as stated. |
| LARGELY SUPPORTED | Backed by the evidence, with minor caveats that do not change the substance. |
| NOT SUBSTANTIATED | Stated more strongly than the evidence offered or available allows. May be true in some conditions but has not been shown. |
| MISLEADING | Omits material facts so that the overall impression is inaccurate, even if individual statements are defensible. |
| CONTRADICTED | The available evidence points against the claim. |
Confidence
High: multiple independent lines of evidence agree. Moderate: evidence is relevant but incomplete or indirect. Low: evidence is thin, second-hand or conflicting.
Evidence grades
A experiment · B observational study with a control or gradient · C review, guidance, statute text or official statistics · D assertion or anecdote. ◆ marks a source known only second-hand.
Standards
- Quote the speaker, not the headline, with outlet and date, and link the original where possible.
- Separate the claim from the evidence offered for it, and say who made which statement.
- Grade the evidence and show differing views side by side where the evidence is unsettled.
- State what we could not access or verify, and what would change the verdict either way.
- Ask for the missing evidence in specific, answerable requests.
- Offer a right of reply where a check finds a claim Not substantiated, Misleading or Contradicted (or a pledge Not measurable, Off track or Missed), before wider circulation, and append responses.
- Correct errors openly with a version number and change log.
- Whistle-blow only on evidence: a verdict of Misleading or Contradicted requires documents or data that can be shown, not inference.
- Check every side. Government, opposition, NGOs and developers are held to the same standard.
Appendix B: revision log
| Version | Date | Change |
|---|---|---|
| 1.0 | 10 Oct 2026 | First issue. Verdict Not substantiated (low confidence); pending right of reply. |
Sources and archived copies
-
'Free' public transport reaches EUR 100 million a year in subsidies as traffic gridlock worsens, The Shift News, 26 Feb 2026.
Original · fetched and fingerprinted 2026-10-10; no public snapshot yet
Primary: the article is the claim (the speaker is the outlet). Read in full 10 Oct 2026. Its figures come from replies to PQs by Chris Said, not read. -
Nefqa ta’ €100 miljun fis-sena għal trasport pubbliku b’xejn, Newsbook, 27 Feb 2026.
Original · Archived copy
Outlet report of the same tabled document (second-hand). Read in full.
Right of reply
The body concerned has not yet been asked to reply. Its response will be published here, beside the verdict.
Connections
How this claim relates to the others: who made it, the themes it shares with other claims, and the patterns it shows. A connection is a reason to read two checks side by side. It does not make either one right or wrong. How connections are found.
Who made it
Other claims by The Shift News 2
Linked directly 3
Claims that share a theme with this one. A theme is a cause, a mechanism, a target or a way of presenting figures that the editors have found in several claims; its strength says how close the link is.
Transport, air and climate Shared driver · Strong
Fleet growth links traffic claims, air quality and emissions. The climate report names transport and buildings as the lagging sectors.
Two steps away 3
Not linked to this claim directly, but linked to a claim that is. These are found by following the links, not chosen by the editors, so they are looser: they show where one theme meets another.
- CC-008 Flyovers and congestion (Not substantiated)through Transport, air and climateCC-069Transport, air and climate or Transport, air and climateCC-072Transport, air and climate or Transport, air and climateCC-115Transport, air and climate
- CC-109 EU: transport is 48% of effort-sharing emissions (Largely supported)through Transport, air and climateCC-072Transport, air and climate or Transport, air and climateCC-115Transport, air and climate
- CC-110 EU: 37.7% of new cars zero-emission (Supported)through Transport, air and climateCC-072Transport, air and climate
Three steps away 17
One step further again. At this distance a connection says more about how the themes fit together than about this claim.
- CC-001 Upper Barrakka concrete (Not substantiated)through Transport, air and climateCC-069Transport, air and climateCC-008Sealed soil and concrete
- CC-002 Comino tree compensation (Largely supported)through Transport, air and climateCC-069Transport, air and climateCC-008Sealed soil and concrete
- CC-003 Per-capita emissions vs 2030 projection (Misleading)through Transport, air and climateCC-069Transport, air and climateCC-008Transport, air and climate
- CC-004 'Strong progress' in waste separation (Not substantiated)through Transport, air and climateCC-069Transport, air and climateCC-008Waste and construction
- CC-007 Within EU limits vs WHO guideline (Largely supported)through Transport, air and climateCC-069Transport, air and climateCC-008Transport, air and climate
- CC-010 Tree-planting counts (Largely supported)through Transport, air and climateCC-069Transport, air and climateCC-008Replanting as currency
- CC-012 Ta' Qali gravel and grass (Contradicted)through Transport, air and climateCC-069Transport, air and climateCC-008Sealed soil and concrete
- CC-016 Shore-to-ship: 90% less harbour pollution (Misleading)through Transport, air and climateCC-069Transport, air and climateCC-008Transport, air and climate
- CC-017 Land reclamation outside the Freeport (Not substantiated)through Transport, air and climateCC-069Transport, air and climateCC-008Waste and construction
- CC-019 830,000 m2 of land lost in five years (Not substantiated)through Transport, air and climateCC-069Transport, air and climateCC-008Sealed soil and concrete
- CC-021 Malta-Gozo tunnel traffic (not yet checked)through Transport, air and climateCC-069Transport, air and climateCC-008Transport, air and climate
- CC-026 EU's largest rise in emissions (Largely supported)through Transport, air and climateCC-072Transport, air and climateCC-110Transport, air and climate
- CC-031 Gozo, first climate-neutral region (Largely supported)through Transport, air and climateCC-072Transport, air and climateCC-109Shared emissions figures
- CC-056 Central Link: 'only 254 trees' (not yet checked)through Transport, air and climateCC-069Transport, air and climateCC-008Replanting as currency
- CC-075 Seventh in the EU for cars (Misleading)through Transport, air and climateCC-072Transport, air and climateCC-110Transport, air and climate
- CC-076 36 more vehicles a day (Supported)through Transport, air and climateCC-069Transport, air and climateCC-008Transport, air and climate
- CC-094 Commission: Malta to emit more in 2030 than in 2005 (Supported)through Transport, air and climateCC-072Transport, air and climateCC-1092030 carbon target
Similar wording
Claims whose own words overlap with this one, with the words they share. Found by comparing the wording of the claims, not their verdicts; a lead to read them together, not a finding.
- CC-115 Chamber: congestion cost EUR 770m, 3.4% of GDP (Not substantiated)shares: cost, traffic, congestion
Timeline
What was said, what was published before and after it, and each step of this check, in date order. Statements and sources carry the date they were published. The steps of the check carry the date the research was done, from the check's research log. Other statements by the same body on the same topic show whether a position was repeated, changed or corrected.
2024
- 18 April 2024 Reported Government shells out close to EUR 70 million to national bus operator Malta Public Transport in 2023, Business Now
2026
- 26 February 2026 The statement The Shift News (this claim)
- 26 February 2026 Reported 'Free' public transport reaches EUR 100 million a year in subsidies as traffic gridlock worsens, The Shift News
- 26 February 2026 Reported 'Free' public transport reaches EUR 100 million a year in subsidies as traffic gridlock worsens, The Shift News
- 27 February 2026 Reported Nefqa ta' EUR 100 miljun fis-sena ghal trasport pubbliku b'xejn, Newsbook
- 4 October 2026 Added to the claims to check
- 10 October 2026 Check started Worker B took the claim. The Shift article read in full; Newsbook (Maltese), Business Now and the Shift 2024 article read.
- 10 October 2026 Exact wording found Verbatim found: the speaker is The Shift News, so its article is the wording (headline and first sentence quoted). The record text paraphrased it as "about EUR 100 million" and is restated. Figures come from PQ replies we could not read (parlament.mt 403).
- 10 October 2026 Note Research: Eurostat road_eqs_carmot and demo_gind; TomTom Valletta page data (2025 and previous-year block); payments series from outlet reports (second-hand). Not found: PQ text, Financial Estimates 2026 and Budget Speech 2026 (finance.gov.mt 403), Transport Malta (403), Wayback (reset). Log in literature/CC-071/notes.md.
- 10 October 2026 Version 1.0: first issue First issue. Verdict Not substantiated (low confidence); pending right of reply. Verdict in this version: Not substantiated, low confidence.
- 10 October 2026 Evidence reviewed
2027
- 10 October 2027 Coming up: Evidence review due Each finished check is reviewed against new evidence within a year.
Every change to this claim's record is public: history of the record.
Download the report and flyer