CC-022 · Climate & Energy · Electricity & grid
'Lowest electricity burden in the EU'
Largely supported Moderate confidence Draft: no right of reply needed
Parts of this claim
The claim is split into parts that are tested separately, as in the report below. Each part has its own number.
- CC-022A Lowest price in PPS, 2024-S2Confirmed by Eurostat for the standard household band (2,500–4,999 kWh), the one the release uses; not the lowest in other bands [2].
- CC-022B Third-lowest nominal price; comparison figuresConfirmed [2].
- CC-022C Prices stable since 2020−0.2% vs EU +35% [2].
- CC-022D Lowest “burden” on familiesTrue for price. Against income, 2nd of 27 for a typical and a low-income household; on actual bills, 5th of 26 (Section 4). The subsidy cost is not counted [4].
Claim Check 022 · Climate and energy
The lowest electricity burden in the EU?
Testing a ministry claim about household electricity prices against Eurostat and the IMF
“…the burden on Maltese families is the lowest in the EU, at 14.33 PPS per 100kWh.”
Ministry for the Environment, Energy and Public Cleanliness, 6 May 2025.
Based on Eurostat figures for the second half of 2024.
Verdict: Largely supported Lowest on price, second against income; subsidy cost left out
Version 1.2 · 5 October 2026
TL;DR
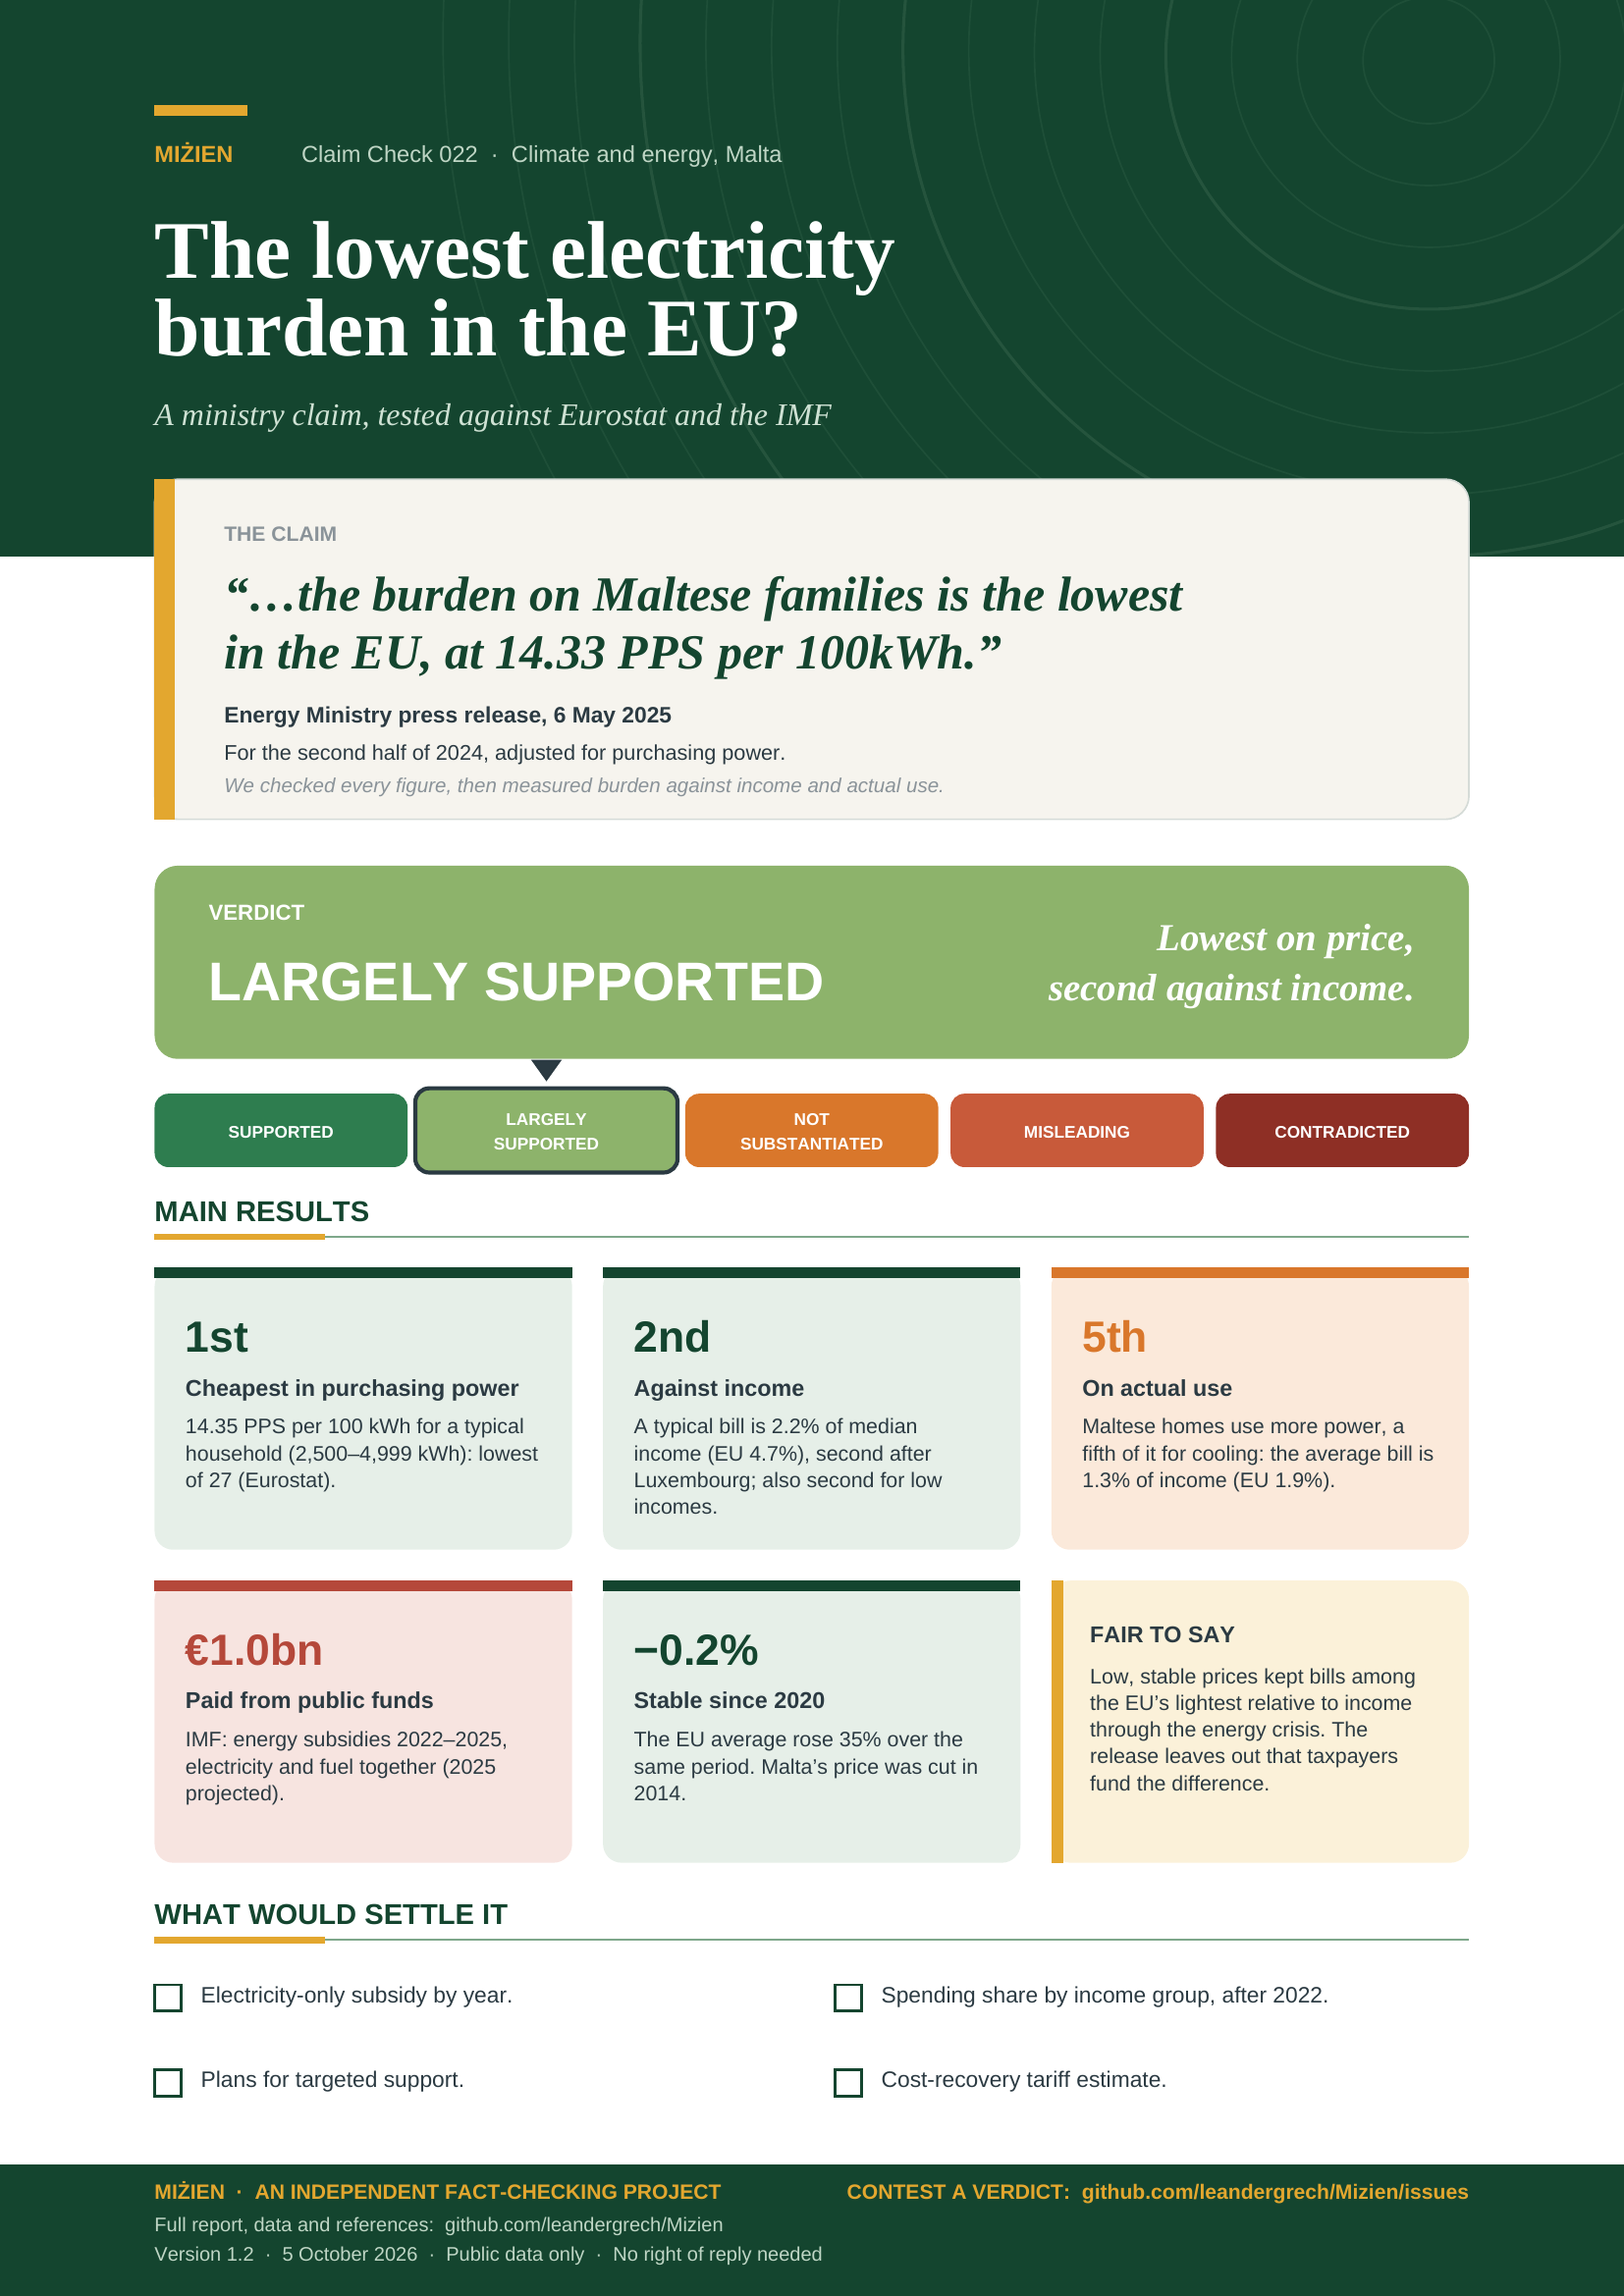
On 6 May 2025 the Energy Ministry said that “Malta has the lowest electricity prices for domestic consumers in the European Union when measured in terms of purchasing power standards”, and that “the burden on Maltese families is the lowest in the EU”. Every figure matches Eurostat, but burden is measured by price alone. Measured against income, a typical Maltese bill is 2.2% of median income against 4.7% in the EU: the second lowest, after Luxembourg. On households’ actual use it is the fifth lowest. Prices are held down by public subsidies that the release does not mention.
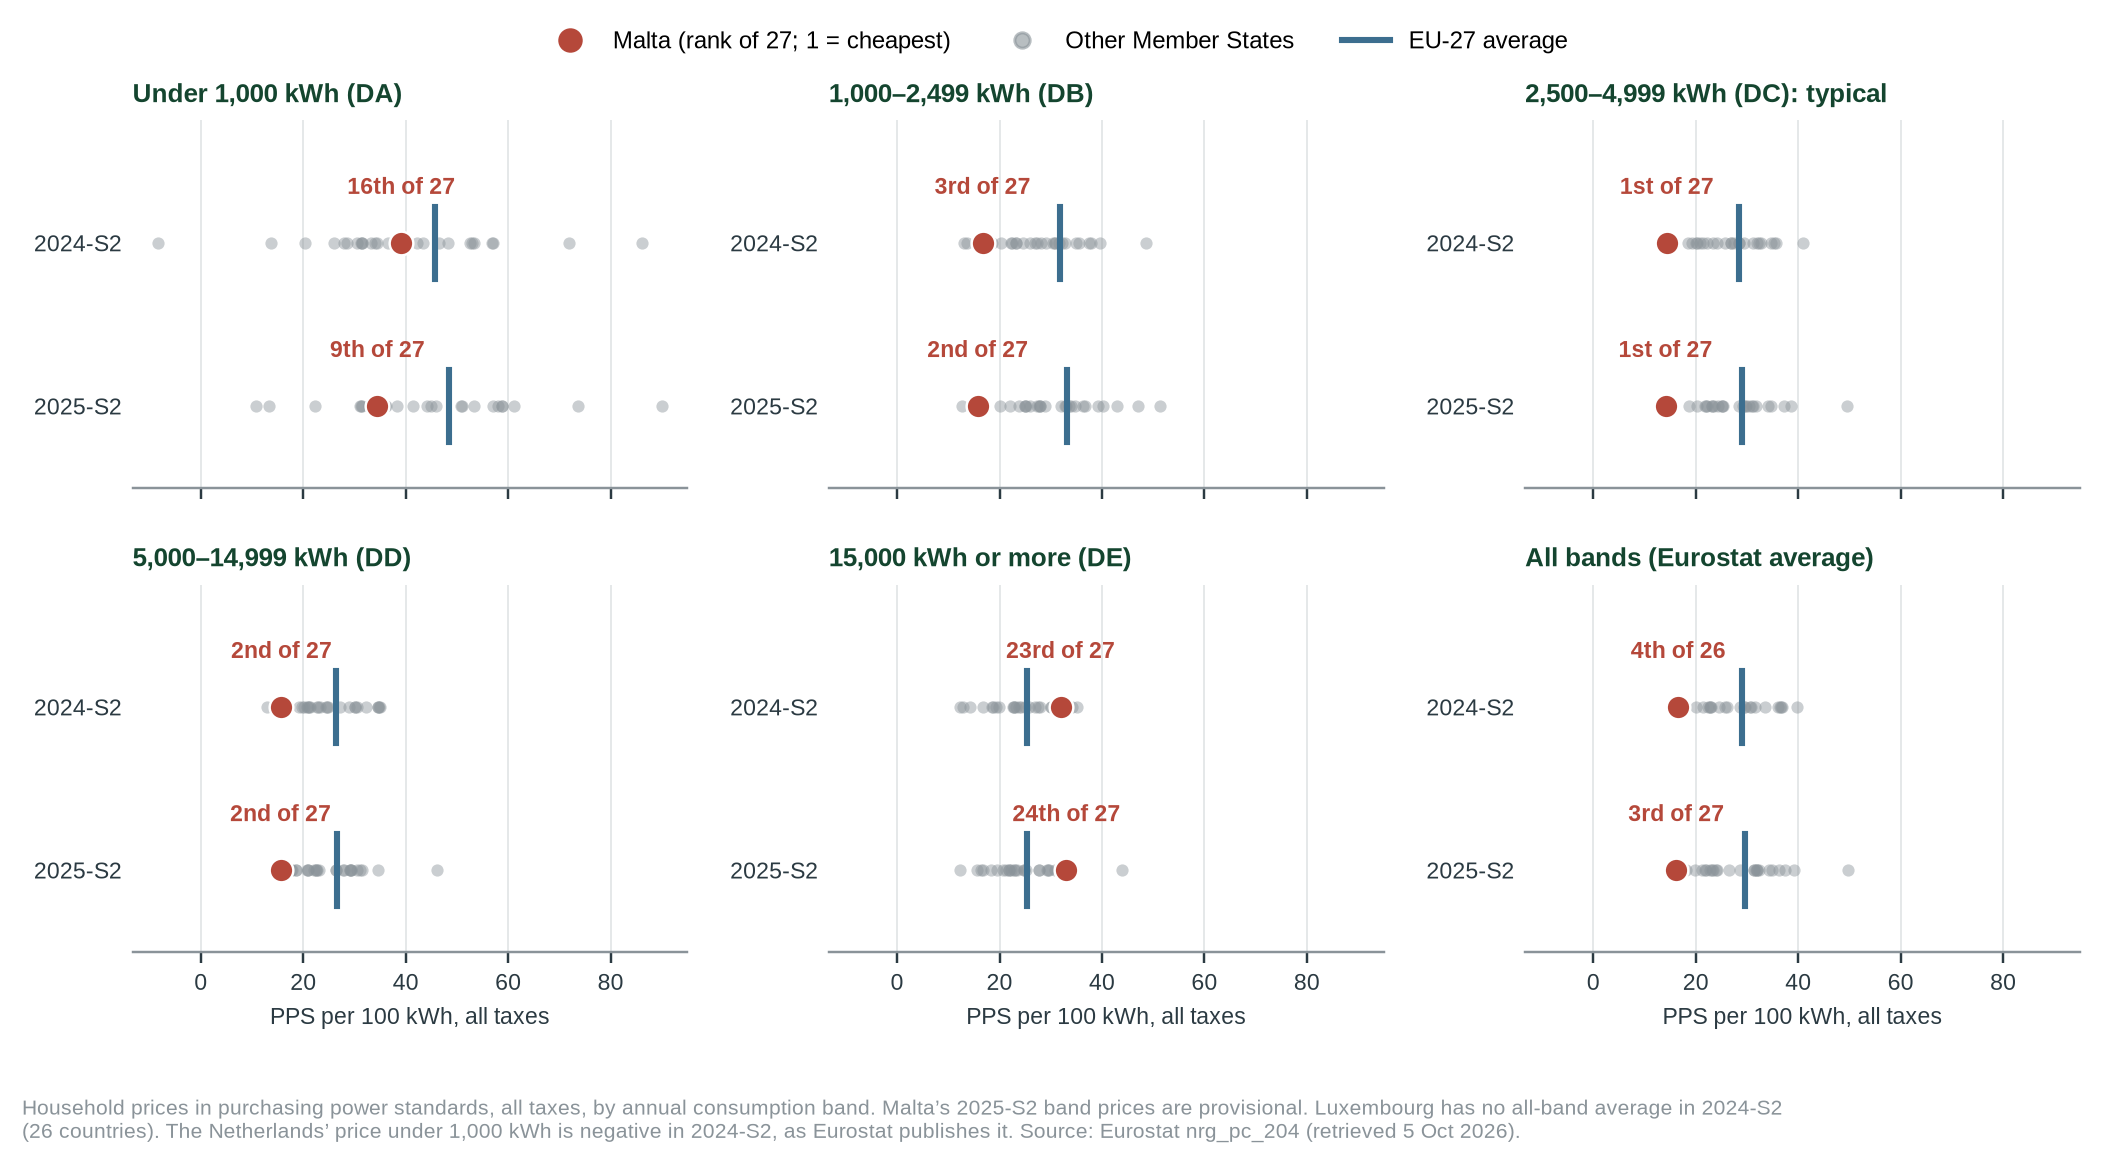
- Every figure checks out. For a typical household (2,500–4,999 kWh a year), Malta’s 14.35 PPS per 100 kWh in 2024-S2 is the lowest of 27 and EUR 0.130 the third lowest in euros. In other consumption bands Malta ranks 2nd to 23rd (Figure 2).
- Against income, second. A typical bill (3,750 kWh) takes 2.2% of median income (EU 4.7%) and 3.5% of a low income at the 20th percentile (EU 7.3%): second lowest both times, after Luxembourg (Figure 4).
- On actual use, fifth. Maltese homes use more electricity than most (4,617 kWh a year, 21st of 27), a fifth of it for cooling. The average household’s bill is 1.3% of its disposable income (EU 1.9%), fifth lowest of 26.
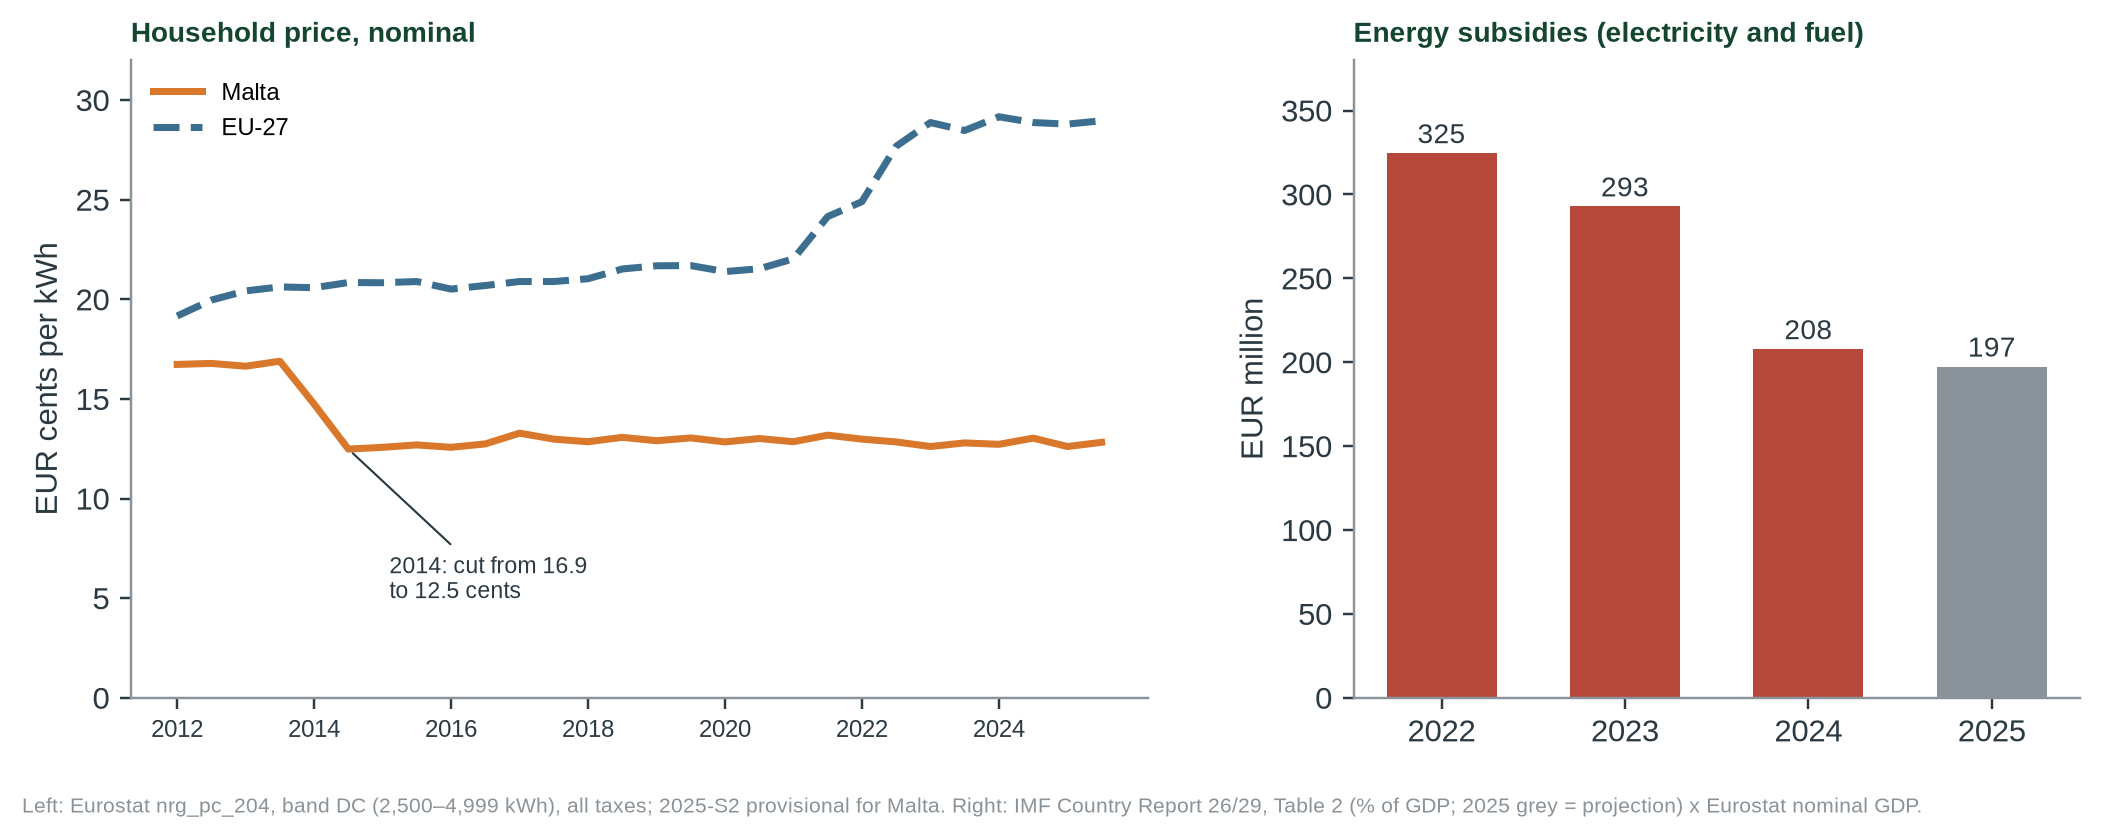
- The price is held down with public money. Malta’s price was cut from EUR 0.169 to 0.125 per kWh in 2014 and has barely moved since; the EU average rose 35% after 2020. The IMF puts energy subsidies (electricity and fuel) at about EUR 1 billion in 2022–2025.
- Fewer struggle than the EU average, but not the fewest. 4.5% of people are in arrears on utility bills (EU 7.0%; 9th of 27) and 7.6% cannot keep the home adequately warm (EU 8.8%; 17th of 27).
- Verdict: largely supported (moderate confidence). The price comparison is accurate, and Malta’s burden is among the EU’s lowest on every measure we tried, but the lowest only on price. The cost of keeping prices low, borne by public finances, is left out.
- Supported
- Largely supported
- Not substantiated
- Misleading
- Contradicted
What would move the verdict up
Household Budget Survey results after 2022 showing the lowest share of spending on electricity in the EU, with the subsidy cost shown alongside.
What would move it down
Evidence that subsidy costs fall on households through other bills, or newer data placing Malta lower on the income-based measures.
IN THIS REPORT
1 The claim
The press release by the Ministry for the Environment, Energy and Public Cleanliness was read in full [1].
| What was said | Access |
|---|---|
| “Malta has the lowest electricity prices for domestic consumers in the European Union when measured in terms of purchasing power standards (PPS)… for the second half of 2024.” | Read in full |
| “…third-lowest nominal electricity price… at €0.131 per unit… the burden on Maltese families is the lowest in the EU, at 14.33 PPS per 100kWh.” Czech Republic 41.00, Cyprus 35.70, Germany 35.23 PPS. | Read in full |
| “This is clear confirmation that our policy is working for the benefit of the people.” (Minister Miriam Dalli) | Read in full |
2 Method
Eurostat household electricity prices (band DC, 2,500–4,999 kWh a year, all taxes) for all EU countries, 2019–2025, in euros and purchasing power standards, with the other consumption bands and Malta’s price since 2012 for comparison [2]; Eurostat energy-poverty indicators [3]; energy subsidies from the IMF’s 2025 Article IV report [4], converted to euros with Eurostat GDP. To test “burden” against income and use (Section 4) we added Eurostat income distribution (EU-SILC) [6], household electricity use and consumption by band [7], household numbers [8], household disposable income [9] and the 2020 Household Budget Survey [10], all retrieved on 5 October 2026 with their status flags. Numbers are recomputed by tools/cc-022-report/calc.py and burden.py. Official statistics and assessments are grade C.
3 What the data show
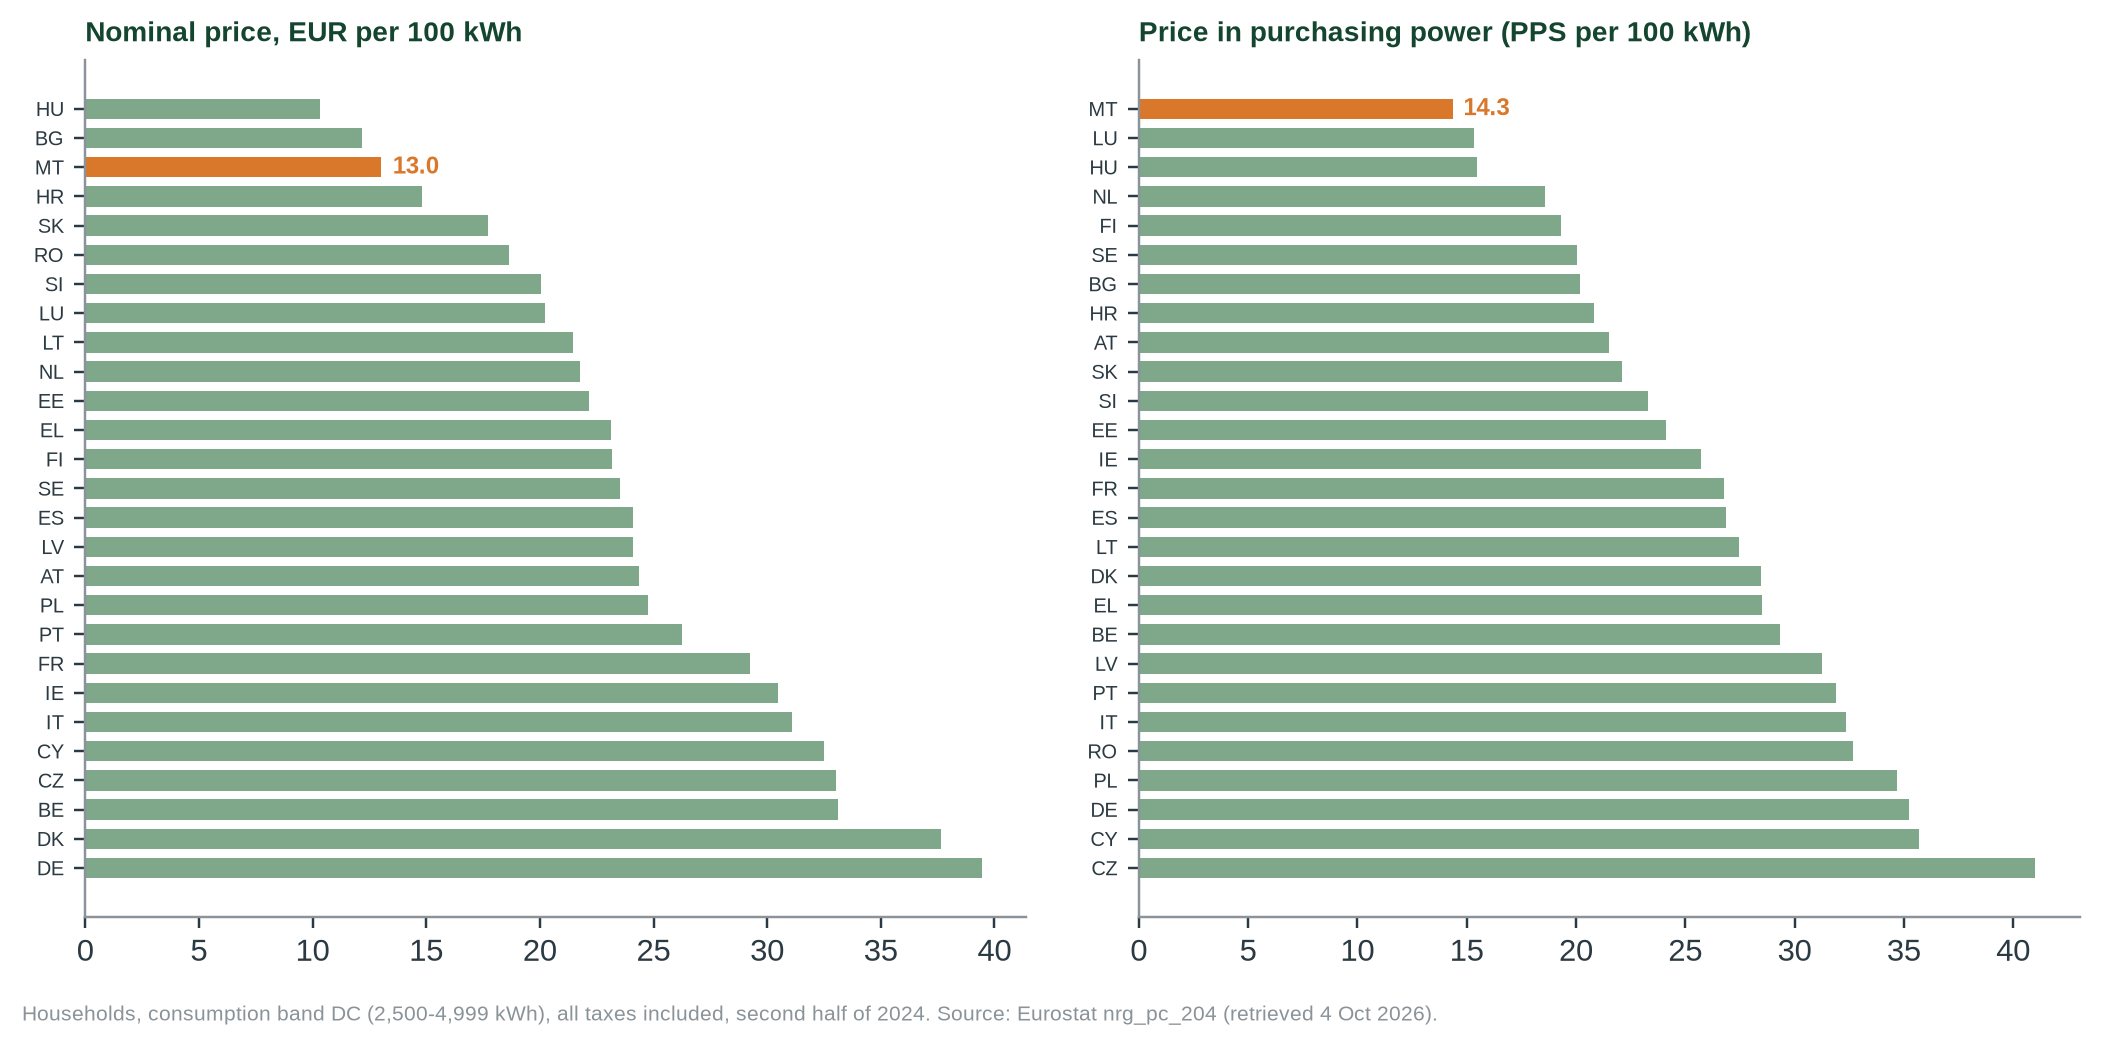
Malta is cheapest only in this standard band, which the release uses (Figure 2). In 2024-S2 it ranked 3rd in the band below (1,000–2,499 kWh) and 2nd in the band above (5,000–14,999 kWh), but 16th for the smallest users (under 1,000 kWh) and 23rd of 27 for the largest (15,000 kWh or more), and 4th of 26 on Eurostat’s all-band average. In 2025-S2 the pattern is the same: 9th, 2nd, 1st, 2nd and 24th, and 3rd of 27 on the average [2]. For the largest users Malta’s price per unit is more than double the typical one (31.9 against 14.35 PPS per 100 kWh in 2024-S2); in 19 of the 27 states it is lower for them.
| Indicator | Claim | Eurostat / IMF | Grade |
|---|---|---|---|
| Malta, PPS per 100 kWh, 2024-S2, band 2,500–4,999 kWh | 14.33, lowest | 14.35, lowest of 27 | C |
| Malta, nominal price, 2024-S2 | EUR 0.131, third lowest | EUR 0.1303, third lowest | C |
| Czechia / Cyprus / Germany, PPS | 41.00 / 35.70 / 35.23 | 41.00 / 35.70 / 35.23 | C |
| Price change 2020-S1 → 2025-S2 | “remained stable” | Malta −0.2%; EU +35.4% | C |
| Energy subsidies (electricity and fuel), 2022–2025 | not mentioned | EUR 325m, 293m, 208m, 197m (2025 projected) | C |
| Unable to keep home warm, 2025 | – | 7.6% (EU 8.8%); 17th of 27 | C |
| Arrears on utility bills, 2025 | – | 4.5% (EU 7.0%); 9th of 27 | C |
All values in data/cc-022/checks.csv.
4 What “burden” means: price, income and use
The release is titled “Maltese households with lowest burden”, and the minister calls the result “clear confirmation that our policy is working” [1]. A price in purchasing power standards corrects for how expensive a country is in general. It does not take account of what households earn, or of how much electricity they use: a cheap unit can still add up to a heavy bill for a household that uses a lot or earns little. We therefore measured burden four more ways, all from Eurostat, and ranked the 27 Member States on each (1 = lowest burden):
- Typical bill against median income: 3,750 kWh a year (the middle of the typical band) at the 2024 band price, all taxes, as a share of median equivalised net income from EU-SILC 2025, which measures 2024 income [2, 6].
- The same bill against a low income: the 20th percentile, the top of the poorest fifth [6].
- The average household’s actual bill: household electricity use divided by the number of households, priced at the average of the band prices weighted by consumption, as a share of households’ gross disposable income per household [7–9]. Income comes from the national accounts here because EU-SILC publishes income per adult-equivalent, not per household.
- Electricity’s share of household spending in the 2020 Household Budget Survey, the latest, which predates the 2022 price shock [10].
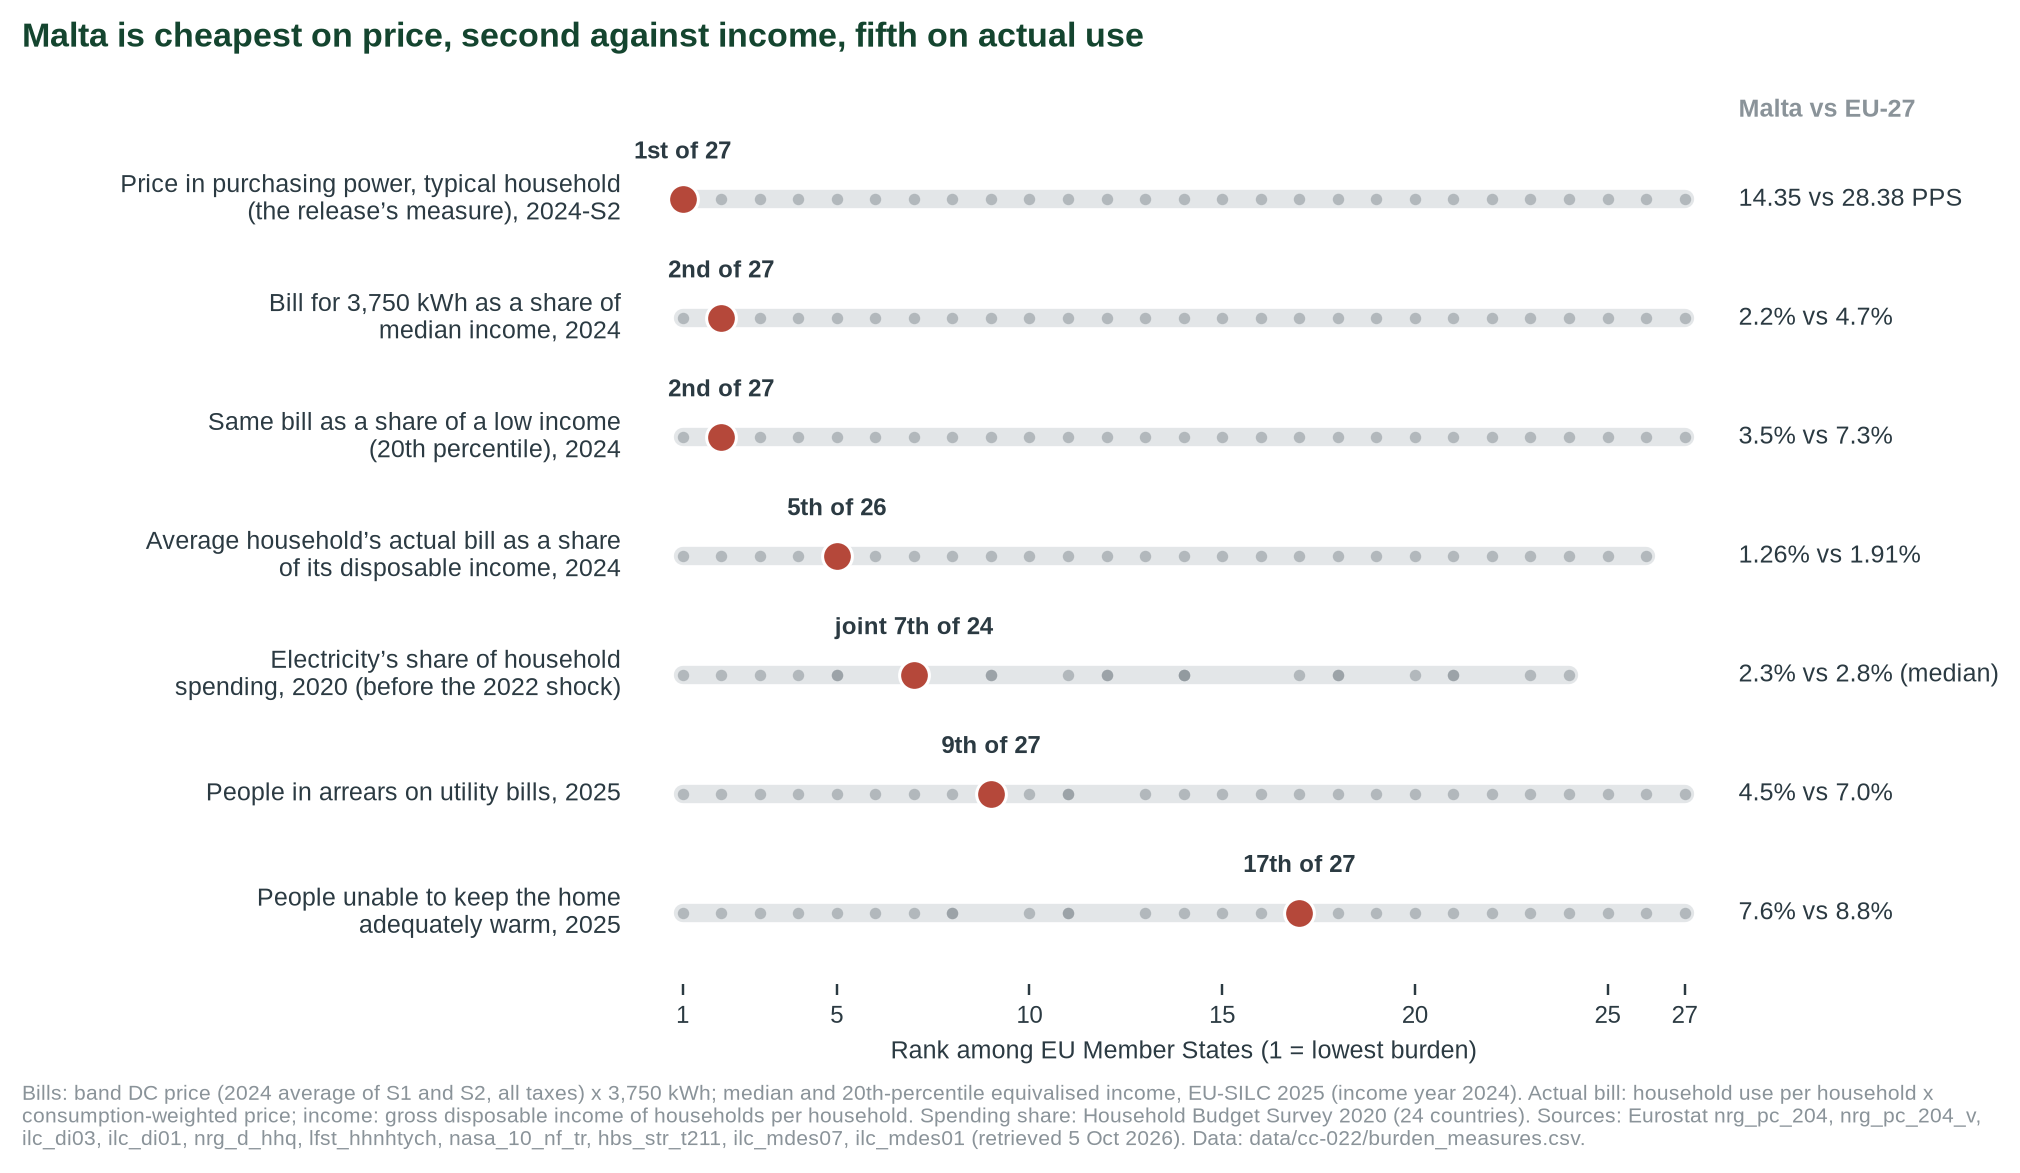
| Measure | Malta | EU-27 | Malta’s rank | Grade |
|---|---|---|---|---|
| Price in PPS per 100 kWh, typical household, 2024-S2 (the release’s measure) | 14.35 | 28.38 | 1st of 27 | C |
| Bill for 3,750 kWh as a share of median income, 2024 | 2.2% | 4.7% | 2nd of 27 (Luxembourg 1.5%) | C |
| Same bill as a share of the 20th-percentile income, 2024 | 3.5% | 7.3% | 2nd of 27 | C |
| Electricity use per household, 2024 | 4,617 kWh | 3,524 kWh | 21st of 27 | C |
| Average household’s annual bill, 2024 | €689 | €1,041 | 12th of 27 | C |
| Average bill as a share of disposable income per household, 2024 | 1.26% (p) | 1.91% | 5th of 26 | C |
| Electricity’s share of household spending, 2020 | 2.3% (e) | 2.8% (median of 24) | joint 7th of 24 | C |
| Arrears on utility bills, 2025: all / below 60% of median income | 4.5% / 9.2% | 7.0% / 16.8% | 9th / 7th of 27 | C |
| Unable to keep the home adequately warm, 2025: all / below 60% of median income | 7.6% / 10.9% | 8.8% / 19.6% | 17th / 9th of 27 | C |
| Home not comfortably cool in summer, 2012 (latest) | 35.4% | 21.4% | 25th of 27 | C |
Ranks: 1 = lowest burden or fewest people affected. (p) provisional; (e) estimated (Eurostat flags). The average bill is household use per household times the consumption-weighted price; Bulgaria has no household income in the national accounts, hence 26. All inputs and results: data/cc-022/eurostat_burden_inputs.csv and burden_measures.csv.
Does “lowest burden” hold?
On the release’s own measure, yes. Against income, Malta comes second, after Luxembourg, for a typical household and for a low-income one; the result is the same at 2,500 or 5,000 kWh, with 2023 incomes and with 2025 prices. For the average household’s actual bill Malta is fifth of 26, level with Slovakia. Before the 2022 shock, six other states spent a smaller share of household budgets on electricity (Malta joint seventh of 24, with Belgium). On every measure Malta’s burden is well below the EU average and among the lowest in the EU. It is the lowest only on the price measure the release used.
Use matters. Maltese households use more electricity than most: 4,617 kWh a year, 21st of 27 (EU 3,524). In 2024 a fifth of it went on space cooling (19.5%; EU 3.1%) and a quarter on water heating (25.8%; EU 11.4%) [7]. A low price per unit therefore adds up to a larger bill than the price ranking suggests: €689 a year for the average household, 12th lowest of 27, against €1,041 in the EU.
Who struggles. Fewer people in Malta than in the EU as a whole are behind on utility bills (4.5% against 7.0%) or unable to keep the home warm (7.6% against 8.8%), but these rates place Malta 9th and 17th of 27, not first [3]. Among people below 60% of median income the rates are about half the EU’s. Summer comfort was last measured in 2012, when 35.4% of people in Malta said their home was not comfortably cool, against 21.4% in the EU (25th of 27) [11]; Eurostat publishes no later figure.
5 Where the evidence points different ways
Q1 Is the burden on families the lowest in the EU?
ON PRICE YES; ON INCOME 2NDEVIDENCE FOR THE CLAIM'S IMPRESSION
For a typical household (2,500–4,999 kWh), price adjusted for purchasing power is the lowest in the EU. Against income a typical bill is the second lowest (2.2% of median income; EU 4.7%), and fewer Maltese than average struggle to pay bills or heat their homes.
EVIDENCE AGAINST
PPS adjusts for general price levels, not for income or use. Against income Luxembourg is lower; on households’ actual bills Malta is fifth of 26, because Maltese homes use more electricity than most; on keeping warm it is 17th of 27 (Section 4).
Q2 Is it confirmation that the policy works?
INCOMPLETEEVIDENCE FOR THE CLAIM'S IMPRESSION
Prices stayed flat through the 2022 energy shock, protecting households.
EVIDENCE AGAINST
The stability is paid for through public finances: the IMF puts energy subsidies, for electricity and fuel together, at about EUR 1 billion in 2022–2025, with 2025 projected [4]; the IMF recommends replacing untargeted subsidies with cost-recovery tariffs and targeted support.
6 Testing the claim
| Sub-claim | What the evidence shows | Rating |
|---|---|---|
| A. Lowest price in PPS, 2024-S2 | Confirmed by Eurostat for the standard household band (2,500–4,999 kWh), the one the release uses; not the lowest in other bands [2]. | SUPPORTED |
| B. Third-lowest nominal price; comparison figures | Confirmed [2]. | SUPPORTED |
| C. Prices stable since 2020 | −0.2% vs EU +35% [2]. | SUPPORTED |
| D. Lowest “burden” on families | True for price. Against income, 2nd of 27 for a typical and a low-income household; on actual bills, 5th of 26 (Section 4). The subsidy cost is not counted [4]. | LARGELY SUPPORTED |
7 Verdict and requests for evidence
Every figure is accurate; the cost of keeping prices low is left out. Confidence: moderate.
Why. The statistical claims match Eurostat exactly. The word “burden” and the minister’s conclusion rest on price alone. Measured against income, Malta’s burden is the second lowest in the EU, after Luxembourg, and the fifth lowest on households’ actual bills: among the lowest on every measure, but the lowest only on the price the release used. Fixed electricity and fuel prices are financed by public subsidies the IMF puts at about EUR 1 billion over 2022–2025 (electricity and fuel together; 2025 projected). These qualify the claim without contradicting it. Confidence is moderate because the income comparisons combine survey income (EU-SILC), national-accounts income and labour-force household counts, and several inputs are provisional.
Evidence we are asking for
- The electricity-only subsidy to Enemalta by year, separate from fuel.
- Household spending on electricity as a share of income, by income group, after 2022 (the latest EU Household Budget Survey is from 2020).
8 Limitations
- The IMF subsidy series covers electricity and fuel; 2025 is a staff projection.
- The income measures combine sources with different bases: EU-SILC income is per adult-equivalent while a bill is per household; national-accounts income includes non-profit institutions and imputed items and is higher than survey income; household numbers come from the Labour Force Survey. They rank countries under stated assumptions rather than give exact burdens. Malta’s 2024 household income is provisional, and Malta and Slovakia are 0.003 points apart on the actual-bill measure.
- The 2024 bill is matched to EU-SILC 2025, which measures 2024 income; with EU-SILC 2024 (2023 income) Malta’s ranks are unchanged.
- The spending share is from 2020, before the 2022 price shock; summer comfort was last measured in 2012.
- The comparison uses band DC (2,500–4,999 kWh), a typical household; Malta is not the cheapest in the other bands (Section 3).
- The release gives 14.33 PPS; Eurostat’s current figure is 14.35. We did not keep the data as published in May 2025, so we cannot say whether this reflects a revision; the ranking is the same.
References
- [1] Ministry for the Environment, Energy and Public Cleanliness (6 May 2025). Electricity prices in the EU: Maltese households with lowest burden. PR250746en. https://www.gov.mt/en/Government/DOI/Press%20Releases/Pages/2025/05/06/pr250746en.aspx
- [2] Eurostat. nrg_pc_204, electricity prices for household consumers; retrieved 4 Oct 2026 (other consumption bands and Malta’s series since 2012 retrieved 5 Oct 2026). https://ec.europa.eu/eurostat/databrowser/view/nrg_pc_204/default/table
- [3] Eurostat. ilc_mdes01, ilc_mdes07; retrieved 4 Oct 2026. https://ec.europa.eu/eurostat/databrowser/view/ilc_mdes01/default/table
- [4] International Monetary Fund (2026). Malta: 2025 Article IV Consultation. Country Report 26/29, Table 2 and para. on energy subsidies. doi:10.5089/9798229038249.002. https://www.imf.org/-/media/files/publications/cr/2026/english/1mltea2026001-source-pdf.pdf
- [5] MiŻien. Data and calculations: data/cc-022/; tools/cc-022-report/.
- [6] Eurostat. ilc_di03 (mean and median equivalised net income) and ilc_di01 (distribution of income by quantiles), EU-SILC 2024 and 2025; retrieved 5 Oct 2026. https://ec.europa.eu/eurostat/databrowser/view/ilc_di03/default/table
- [7] Eurostat. nrg_d_hhq (household energy consumption by end use) and nrg_pc_204_v (household electricity consumption by band), 2024; retrieved 5 Oct 2026. https://ec.europa.eu/eurostat/databrowser/view/nrg_d_hhq/default/table
- [8] Eurostat. lfst_hhnhtych (private households, Labour Force Survey), 2024; retrieved 5 Oct 2026. https://ec.europa.eu/eurostat/databrowser/view/lfst_hhnhtych/default/table
- [9] Eurostat. nasa_10_nf_tr (gross disposable income, households and NPISH, S14_S15), 2024; retrieved 5 Oct 2026. https://ec.europa.eu/eurostat/databrowser/view/nasa_10_nf_tr/default/table
- [10] Eurostat. hbs_str_t211 (structure of consumption expenditure, Household Budget Survey 2020); retrieved 5 Oct 2026. https://ec.europa.eu/eurostat/databrowser/view/hbs_str_t211/default/table
- [11] Eurostat. ilc_hcmp03 (dwelling not comfortably cool during summer, EU-SILC 2012 module) and ilc_mdes07 (arrears on utility bills by poverty status); retrieved 5 Oct 2026. https://ec.europa.eu/eurostat/databrowser/view/ilc_hcmp03/default/table
Appendix A: series standards and verdict scale
Every investigation in this series follows the same rules so that verdicts are comparable and challengeable.
| Verdict | Meaning |
|---|---|
| SUPPORTED | Evidence consistently backs the claim as stated. |
| LARGELY SUPPORTED | Backed by the evidence, with minor caveats that do not change the substance. |
| NOT SUBSTANTIATED | Stated more strongly than the evidence offered or available allows. May be true in some conditions but has not been shown. |
| MISLEADING | Omits material facts so that the overall impression is inaccurate, even if individual statements are defensible. |
| CONTRADICTED | The available evidence points against the claim. |
Confidence
High: multiple independent lines of evidence agree. Moderate: evidence is relevant but incomplete or indirect. Low: evidence is thin, second-hand or conflicting.
Evidence grades
A experiment · B observational study with a control or gradient · C review, guidance or official statistics · D assertion or anecdote.
Standards
- Quote the speaker, not the headline, with outlet and date, and link the original where possible.
- Separate the claim from the evidence offered for it, and say who made which statement.
- Grade the evidence and show differing views side by side where the evidence is unsettled.
- State what we could not access or verify, and what would change the verdict either way.
- Ask for the missing evidence in specific, answerable requests.
- Offer a right of reply where a check finds a claim Not substantiated, Misleading or Contradicted (or a pledge Not measurable, Off track or Missed), before wider circulation, and append responses.
- Correct errors openly with a version number and change log.
- Whistle-blow only on evidence: a verdict of Misleading or Contradicted requires documents or data that can be shown, not inference.
- Check every side. Government, opposition, NGOs and developers are held to the same standard.
Appendix B: revision log
| Version | Date | Change |
|---|---|---|
| 1.0 | 4 Oct 2026 | First issue. Right of reply to the Energy Ministry not yet sent. |
| 1.1 | 5 Oct 2026 | Corrections. (1) “Lowest in the EU” now says it holds for the standard household band (2,500–4,999 kWh) (TL;DR, tile, Figure 1 caption, table, Q1, sub-claim A, flyer, thumbnail); added one sentence on the other bands (2024-S2: 3rd, 2nd, 16th, 23rd of 27; 4th of 26 on the all-band average). (2) “Tariffs have been frozen since 2014” (no source) → Eurostat’s series: EUR 0.169 (2013-S2) to 0.125 per kWh (2014-S2), then 0.125–0.133 to 2025-S2. (3) The IMF’s EUR 1 billion is now described as energy subsidies for electricity and fuel together, with 2025 projected: Figure 2 caption “what that stability cost” → “energy subsidies as the IMF reports them”; “tariff freeze is financed by” → “fixed electricity and fuel prices are financed by” (TL;DR, Q2, Why, table, tile, flyer). (4) “Eurostat revised 14.33 to 14.35” → difference noted without asserting a revision. (5) IMF reference: DOI added. Verdict and confidence unchanged. |
| 1.2 | 5 Oct 2026 | Upgrade: (1) New Section 4 tests “burden” against income and use (Eurostat; Figure 4 and a table): typical bill 2.2% of median income (EU 4.7%), 2nd of 27 after Luxembourg; 3.5% of a 20th-percentile income, 2nd; average household’s actual bill 1.26% of disposable income, 5th of 26; spending share 2.3% in 2020, joint 7th of 24; arrears 9th and keeping warm 17th of 27; summer comfort 2012 (25th). (2) New Figure 2: Malta’s price and rank in every consumption band, 2024-S2 and 2025-S2. (3) Figure 3 (was 2) now starts in 2012 and shows the 2014 tariff cut. (4) TL;DR, key points, tiles, Q1, sub-claim D text, Why, Limitations, references and flyer updated; fairness note added. Verdict, confidence and sub-claim ratings unchanged. |
| 1.2 | 5 Oct 2026 | Maintainer decision (5 Oct 2026): verdict kept as Largely supported; confidence lowered from High to Moderate, because the income-based measures in Section 4 mix survey and national-accounts sources and some inputs are provisional. |
| 1.2 | 5 Oct 2026 | Maintainer decision (5 Oct 2026): a right of reply is sought only where a check finds a claim Not substantiated, Misleading or Contradicted, so this check needs none; cover, page footer and flyer now say “no right of reply needed”. |
Sources and archived copies
-
Electricity prices in the EU: Maltese households with lowest burden, Ministry for the Environment, Energy and Public Cleanliness, 6 May 2025.
Original · not yet archived
The claim. Read in full 4 Oct 2026 in a browser.
Right of reply
Not needed: this check finds the claim supported. A right of reply is sought when a check finds a claim Not substantiated, Misleading or Contradicted.
Connections
How this claim relates to the others: who made it, the themes it shares with other claims, and the patterns it shows. A connection is a reason to read two checks side by side. It does not make either one right or wrong. How connections are found.
Who made it
Other claims by Ministry for the Environment 7
- CC-003 Per-capita emissions vs 2030 projection (Misleading)
- CC-004 'Strong progress' in waste separation (Not substantiated)
- CC-010 Tree-planting counts (Largely supported)
- CC-027 Power cuts: heat, not generation (not yet checked)
- CC-029 First offshore wind farm (Largely supported)
- CC-048 Sea urchins recovering (not yet checked)
- CC-051 'Over 30% of our seas protected' (Misleading)
Linked directly 5
Claims that share a theme with this one. A theme is a cause, a mechanism, a target or a way of presenting figures that the editors have found in several claims; its strength says how close the link is.
Selective-metric pattern Rhetorical pattern · Pattern, not causal
A favourable metric is cited while the regulator-relevant metric looks worse. Useful for tagging, not for implying a common cause.
Energy subsidies Shared driver · Weak (indicative)
Claims about what energy support costs and what it shields: the lowest-electricity-burden claim, the Finance Minister's EUR 400 million a year (2026-27), and the EEA ranking of fossil-fuel subsidies by share of GDP. They rest on different definitions of subsidy. CC-095 (10 Oct 2026) set them side by side: the IMF figures used in CC-022 and the Government's own 2023 figure fit Eurostat's COFOG fuel-and-energy subsidies, while the Commission database's 2023 entries for Malta used in CC-113 equal the October 2022 budget allocation (EUR 595m), 2.5 times the Government's later 2023 figure (EUR 242.5m, energy and food).
Two steps away 6
Not linked to this claim directly, but linked to a claim that is. These are found by following the links, not chosen by the editors, so they are looser: they show where one theme meets another.
- CC-003 Per-capita emissions vs 2030 projection (Misleading)through Selective-metric patternCC-0252030 carbon target
- CC-024 Renewables target for 2030 (Not substantiated)through Energy subsidiesCC-124Renewables delivery
- CC-026 EU's largest rise in emissions (Largely supported)through Selective-metric patternCC-025Selective-metric pattern
- CC-029 First offshore wind farm (Largely supported)through Energy subsidiesCC-124Renewables delivery
- CC-114 PN: only EU state with rising emissions intensity (Misleading)through Selective-metric patternCC-025Selective-metric pattern
- CC-119 Council: renewables 17.2% of energy, almost all solar (not yet checked)through Energy subsidiesCC-124Renewables delivery
Three steps away 11
One step further again. At this distance a connection says more about how the themes fit together than about this claim.
- CC-004 'Strong progress' in waste separation (Not substantiated)through Selective-metric patternCC-0252030 carbon targetCC-003Selective-metric pattern
- CC-007 Within EU limits vs WHO guideline (Largely supported)through Selective-metric patternCC-0252030 carbon targetCC-003Transport, air and climate
- CC-008 Flyovers and congestion (Not substantiated)through Selective-metric patternCC-0252030 carbon targetCC-003Transport, air and climate
- CC-010 Tree-planting counts (Largely supported)through Selective-metric patternCC-0252030 carbon targetCC-003Selective-metric pattern
- CC-011 Ten minutes' walk to green space (pledge: Not measurable)through Selective-metric patternCC-0252030 carbon targetCC-0032030 carbon target
- CC-016 Shore-to-ship: 90% less harbour pollution (Misleading)through Selective-metric patternCC-0252030 carbon targetCC-003Transport, air and climate
- CC-021 Malta-Gozo tunnel traffic (not yet checked)through Selective-metric patternCC-0252030 carbon targetCC-003Transport, air and climate
- CC-031 Gozo, first climate-neutral region (Largely supported)through Selective-metric patternCC-025Selective-metric patternCC-026Shared emissions figures
- CC-094 Commission: Malta to emit more in 2030 than in 2005 (Supported)through Selective-metric patternCC-0252030 carbon targetCC-0032030 carbon target
- CC-109 EU: transport is 48% of effort-sharing emissions (Largely supported)through Selective-metric patternCC-0252030 carbon targetCC-0032030 carbon target
- CC-110 EU: 37.7% of new cars zero-emission (Supported)through Selective-metric patternCC-025Selective-metric patternCC-026Transport, air and climate
Similar wording
Claims whose own words overlap with this one, with the words they share. Found by comparing the wording of the claims, not their verdicts; a lead to read them together, not a finding.
- CC-095 EUR 400m to keep bills low (Not substantiated)shares: prices, electricity, eur
Timeline
What was said, what was published before and after it, and each step of this check, in date order. Statements and sources carry the date they were published. The steps of the check carry the date the research was done, from the check's research log. Other statements by the same body on the same topic show whether a position was repeated, changed or corrected.
2025
- 6 May 2025 The statement Ministry for the Environment, Energy and Public Cleanliness (this claim)
- 6 May 2025 Statement published Electricity prices in the EU: Maltese households with lowest burden, Government of Malta (DOI)
- 22 July 2025 Later statement by Ministry for the Environment on Climate & Energy CC-029 First offshore wind farm (Largely supported)
- 13 November 2025 Later statement by Ministry for the Environment on Climate & Energy CC-003 Per-capita emissions vs 2030 projection (Misleading)
2026
- February 2026 Evidence published Malta: 2025 Article IV Consultation (IMF CR 26/29), energy subsidies, International Monetary Fund
- 2026 Evidence published nrg_pc_204: Electricity prices for household consumers, Eurostat
- 21 July 2026 Later statement by Miriam Dalli on Climate & Energy CC-027 Power cuts: heat, not generation (not yet checked)
- 4 October 2026 Added to the claims to check
- 4 October 2026 Version 1.0: first issue First issue. Right of reply to the Energy Ministry not yet sent.
- 5 October 2026 Version 1.2 Upgrade: (1) New Section 4 tests “burden” against income and use (Eurostat; Figure 4 and a table): typical bill 2.2% of median income (EU 4.7%), 2nd of 27 after Luxembourg; 3.5% of a 20th-percentile income, 2nd; average household’s actual bill 1.26% of disposable income, 5th of 26; spending share 2.3% in 2020, joint 7th of 24; arrears 9th and keeping warm 17th of 27; summer comfort 2012 (25th). (2) New Figure 2: Malta’s price and rank in every consumption band, 2024-S2 and 2025-S2. (3) Figure 3 (was 2) now starts in 2012 and shows the 2014 tariff cut. (4) TL;DR, key points, tiles, Q1, sub-claim D text, Why, Limitations, references and flyer updated; fairness note added. Verdict, confidence and sub-claim ratings unchanged. Maintainer decision (5 Oct 2026): verdict kept as Largely supported; confidence lowered from High to Moderate, because the income-based measures in Section 4 mix survey and national-accounts sources and some inputs are provisional. Maintainer decision (5 Oct 2026): a right of reply is sought only where a check finds a claim Not substantiated, Misleading or Contradicted, so this check needs none; cover, page footer and flyer now say “no right of reply needed”. Verdict in this version: Largely supported, moderate confidence.
- 5 October 2026 Evidence reviewed
- 5 October 2026 Version 1.1: corrections Corrections. (1) “Lowest in the EU” now says it holds for the standard household band (2,500–4,999 kWh) (TL;DR, tile, Figure 1 caption, table, Q1, sub-claim A, flyer, thumbnail); added one sentence on the other bands (2024-S2: 3rd, 2nd, 16th, 23rd of 27; 4th of 26 on the all-band average). (2) “Tariffs have been frozen since 2014” (no source) → Eurostat’s series: EUR 0.169 (2013-S2) to 0.125 per kWh (2014-S2), then 0.125–0.133 to 2025-S2. (3) The IMF’s EUR 1 billion is now described as energy subsidies for electricity and fuel together, with 2025 projected: Figure 2 caption “what that stability cost” → “energy subsidies as the IMF reports them”; “tariff freeze is financed by” → “fixed electricity and fuel prices are financed by” (TL;DR, Q2, Why, table, tile, flyer). (4) “Eurostat revised 14.33 to 14.35” → difference noted without asserting a revision. (5) IMF reference: DOI added. Verdict and confidence unchanged. all corrections
2027
- 5 October 2027 Coming up: Evidence review due Each finished check is reviewed against new evidence within a year.
Every change to this claim's record is public: history of the record.
Download the report and flyer