CC-075 · Transport · Cars & traffic
Seventh in the EU for cars
Misleading Moderate confidence Draft: right of reply pending
Parts of this claim
The claim is split into parts that are tested separately, as in the report below. Each part has its own number.
- CC-075A Malta has 585 cars per 1,000 inhabitantsRight for 2022 in data revised after January 2024: 585, no flag; rebuilt from 317,234 cars and 542,051 people [2–4]. Eurostat’s January 2024 release had about 602 [6].
- CC-075B Ranked number seven, between Germany and PolandSeventh of 27 for 2022 in today’s data, between Germany 587 (b) and Poland 584 (i) [2]. In the January 2024 release Malta was sixth and Poland 11th [6].
- CC-075C Presented as current: dataset “as of 2023”, Malta “is ranked” seventhThe article gives conflicting year signals (dataset “as of 2023”, graphic “up to the year 2022”) and states the rank in the present tense. Eurostat had published 2023 figures by 25 Jul 2024: Malta about 575, 12th [13]. Separately, in today’s revised data Malta is 11th for 2023 [2].
- CC-075D Italy top at 682, Latvia lowest at 409Italy 682 matches today’s 2022 data (684 in January 2024); Latvia is lowest in every version (406 now, 414 then) [2, 6].
- CC-075E “Approximately 1 car for every 2 people”585 per 1,000 is one car for every 1.71 people [2]; the rounding understates the rate.
- CC-075F 246 km² of land; among the highest car density in Europe246 km² is Malta island; the country has 313 km² of land [5]. With 1,014 cars per km² of land Malta is first in the EU, 3.9 times the Netherlands [3, 5].
Claim Check 075 · Statistics and EU data
Is Malta seventh in the EU for cars per person?
Testing a media report of Eurostat’s passenger-car figures against the data and its dates
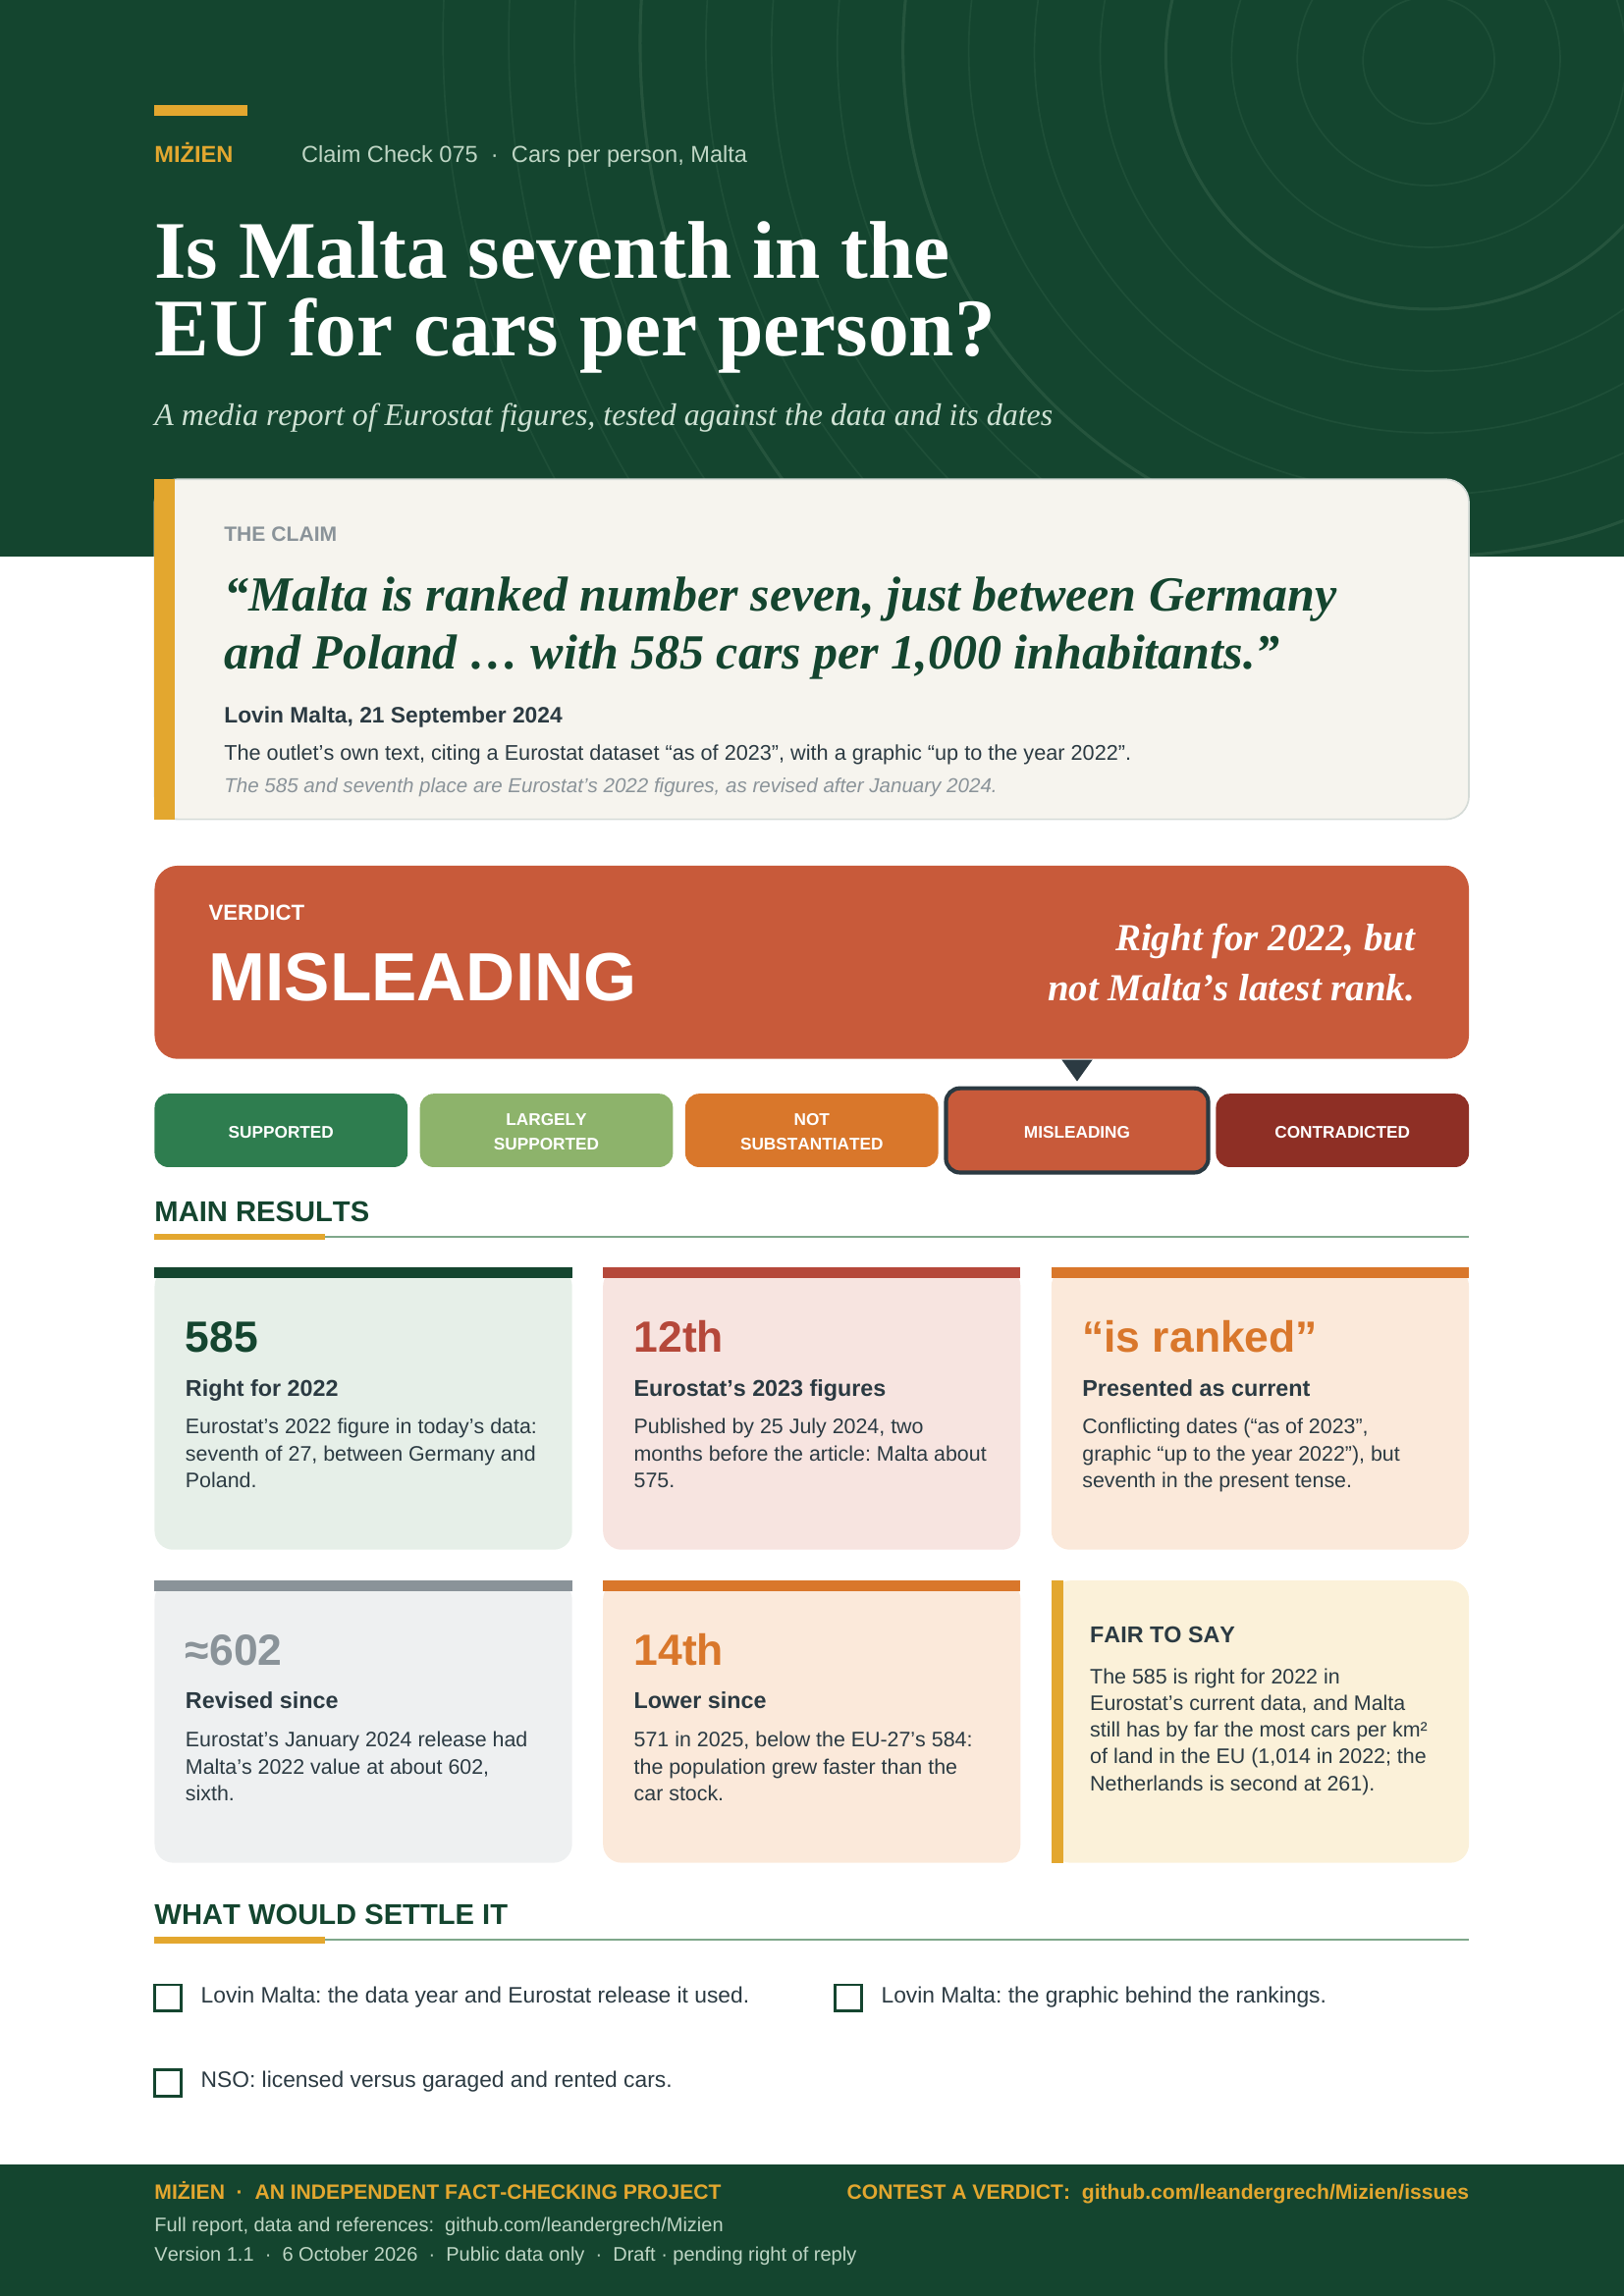
“Malta is ranked number seven, just between Germany and Poland … with 585 cars per 1,000 inhabitants.”
Lovin Malta (J. Darmanin), 21 September 2024.
The outlet’s own text, citing Eurostat; conflicting dates (“as of 2023”, graphic “up to 2022”).
Verdict: Misleading A 2022 rank presented as current; 2023 figures put Malta 12th
Version 1.1 · 6 October 2026
TL;DR
On 21 September 2024 Lovin Malta wrote that Eurostat had “shared a dataset … as of 2023” on passenger cars per 1,000 inhabitants, and that “according to the statistics Malta is ranked number seven, just between Germany and Poland respectively, with 585 cars per 1,000 inhabitants.” We tested the figure and the rank against Eurostat’s data, and against what Eurostat had published by the date of the article.
- The figure is right for 2022, in revised data. Eurostat’s current data give Malta 585 in 2022, seventh of 27, between Germany (587) and Poland (584) [2]. Eurostat’s own release of January 2024 had Malta’s 2022 value at about 602, sixth [6, 14]; it was revised later.
- Eurostat’s newer figures put Malta 12th. By 25 July 2024, about two months before the article, Eurostat had published 2023 figures for all 27 Member States: Malta about 575, 12th; EU 571. That version of Eurostat’s article was online on the day the article appeared [13].
- The article gives conflicting year signals and presents seventh as current. It calls Eurostat’s dataset “as of 2023” but says its graphic illustrates the rankings “up to the year 2022”, and it says Malta “is ranked number seven” in the present tense. It does not mention Eurostat’s already-published 2023 figures, which put Malta about 12th.
- Lower since. In today’s revised data Malta is 11th for 2023 and 14th for 2025 (571, below the EU-27’s 584) [2]: its population has grown faster than its car stock [3, 4]. Side remarks: 585 per 1,000 is one car per 1.7 people, not per two; 246 km² is Malta island.
- Verdict: misleading (moderate confidence). The 2022 figure is defensible, but seventh in the present tense, with conflicting dates and no mention of the 2023 figures, gives an inaccurate picture. Moderate, not high, because readers may read the dates differently.
- Supported
- Largely supported
- Not substantiated
- Misleading
- Contradicted
What would move the verdict up
Evidence that Eurostat’s 2023 figures were not public on 21 September 2024 (its article history shows they were from 23 July), or that the graphic the article relied on (not found) labelled the 585 and the rank as 2022 where readers saw them, so that the dates were not conflicting for readers.
What would move it down
None foreseen: the 585 and seventh place are right for 2022, so the figures themselves cannot be shown false; only how they are presented is in question.
IN THIS REPORT
1 The claim and what we could verify
The claim is Lovin Malta’s own text, read in full on 6 October 2026 on the page and through the site’s WordPress interface (post dated 21 September 2024) [1]. Lovin Malta is a news outlet and is the speaker here; the sentences below are its words, not quotations of anyone else. The article names Eurostat as the source of the dataset and a graphic by Paula Lago via The European Correspondent as the source of the rankings. We could not find the graphic (section 10).
| What Lovin Malta says | Where | Access |
|---|---|---|
| Eurostat “shared a dataset detailing the unit of cars per thousand residents in each European country as of 2023”; a graphic “better illustrated these rankings up to the year 2022” | Paragraphs 1–2 [1] | Read in full; graphic not found |
| “according to the statistics Malta is ranked number seven, just between Germany and Poland respectively, with 585 cars per 1,000 inhabitants” | Paragraph 3 [1] | Read in full |
| Italy the “top-ranker … at a whopping 682”; Latvia lowest “with only 409 per 1,000” | Paragraph 2 [1] | Read in full |
| “approximately 1 car for every 2 people”; “with just 246 square kilometres of land, Malta is also up there among the countries with the highest car density in Europe” | Paragraph 4 [1] | Read in full |
The headline is “Malta Ranked Number Seven On Eurostat’s ‘Passenger Cars Per 1,000 Inhabitants’ Dataset”. The claim record’s summary (seventh in the EU, 585 per 1,000) matches the article; we rate the article’s own sentences, which add the neighbours (Germany, Poland) and give conflicting year signals: the dataset is “as of 2023” but the graphic runs “up to the year 2022”, and the sentence with the 585 and the rank carries no year of its own.
2 Method
Question. Was Malta seventh in the EU with 585 passenger cars per 1,000 inhabitants, between Germany and Poland; for which year; was that Malta’s latest rank when the article appeared; and are the article’s other figures right?
Evidence. This claim is statistical. On 6 October 2026 we downloaded through Eurostat’s API the rate (road_eqs_carhab, updated 30 July 2026) [2], the stock of passenger cars (road_eqs_carmot) [3], the population on 1 January (demo_gind) [4] and land area (reg_area3) [5], for every country and year, keeping Eurostat’s flags. The API serves only current data, so for what Eurostat had published before the article we used Eurostat’s own publications: its release of 17 January 2024 with its chart [6], and the revision history of its article “Passenger cars in the EU”, read through the site’s MediaWiki interface, with the charts each version showed [13, 14]. Eurostat’s charts were read by pixel measurement, calibrated on their gridlines and checked against the values Eurostat prints in the text (all within 1.2 cars per 1,000). Everything is recomputed by tools/cc-075-report/ from data/cc-075/ [12]. Crossref and OpenAlex were searched for peer-reviewed work on car ownership in Malta; one comparative study was read in full [9]. Malta’s National Statistics Office (NSO) and Transport Malta refused scripted access, so their figures are second-hand (◆) [10, 11].
Grades. Official statistics and reviews are grade C under our scale. Verdicts follow the five-point scale in Appendix A.
3 What the indicator measures
Eurostat’s “motorisation rate” is the number of passenger cars per 1,000 inhabitants [7]. A passenger car is a road motor vehicle designed to seat no more than nine people including the driver (category M1). Privately owned and company cars, taxis, private hire cars, shared cars and rented cars are included; light utility vehicles, buses and minibuses are not [7].
How the rate is built. We could not open Eurostat’s methodology page for this dataset (section 10), so we rebuilt the rate. Dividing each country’s car stock at 31 December [3] by its population on 1 January of the following year [4] reproduces Eurostat’s 2022 value for all 27 Member States, within one car per 1,000 [12]. For Malta: 317,234 cars at the end of 2022 and 542,051 people on 1 January 2023 give 585.2.
Registered or licensed? Eurostat collects these figures from national authorities through a questionnaire shared with the ITF and UNECE; collection methods are “not harmonised at EU level”, and vehicle registers “may include very old vehicles without signs of life” [7, 8]. For Malta, NSO publishes the stock of licensed motor vehicles. Its release for the end of 2022 is reported to give 424,904 licensed vehicles, 74.7% of them passenger cars, about 317,400 ◆ [10]; Eurostat’s 317,234 lies within the rounding range (317,191–317,616). NSO’s quarterly figures also count vehicles “taken off the road” (garaged, resold or scrapped) ◆ [11]. This suggests that Malta’s Eurostat figure is the licensed stock; we could not read NSO’s release to confirm it. Rented cars are in the numerator and residents only in the denominator [4, 7]; we found no readable count of rented cars in Malta’s stock.
4 What Eurostat had published by 21 September 2024
Eurostat released the 2022 figures on 17 January 2024. Its chart in that release, and the chart in its article “Passenger cars in the EU” at the time, put Malta sixth at about 602 [6, 14]. In July 2024 Eurostat updated the article with data extracted that month: from 23 July its text gives 2023 values (Italy 694, EU 571), and from 25 July its Figure 3 charts 2023 for all 27 Member States [13]. That version (revision 647912, saved 19 August 2024) stayed online until 5 November 2024, so it was Eurostat’s published picture on 21 September 2024 [13]. In it Malta is 12th, at about 575, behind France (about 578) and ahead of Austria (about 566) (Figure 1). The same version’s Table 2 gives Malta’s car stock as 317,234 for 2022 and 323,852 for 2023, the same as today’s data [3, 13].
| Eurostat publication | Date | Year shown | Malta | Rank (EU-27) | Source |
|---|---|---|---|---|---|
| News release and chart; article Figure 3 | 16–17 Jan 2024 | 2022 | about 602 | 6th | [6, 14] |
| Article “Passenger cars in the EU”, revision 647912 (live 19 Aug – 5 Nov 2024) | text 23 Jul, chart 25 Jul 2024 | 2023 | about 575 | 12th | [13] |
| Lovin Malta article | 21 Sep 2024 | “2023” and “2022” | 585 | “number seven” | [1] |
| Database today (updated 30 Jul 2026) | — | 2022 / 2023 / 2025 | 585 / 575 / 571 | 7th / 11th / 14th | [2] |
“About” values are read from Eurostat’s charts by pixel measurement (data/cc-075/chart_reads.csv); they match every value Eurostat prints in the accompanying text within 1.2 cars per 1,000. Malta’s gap to its neighbours in the 2023 chart (about 3 and 8) is larger than that error.
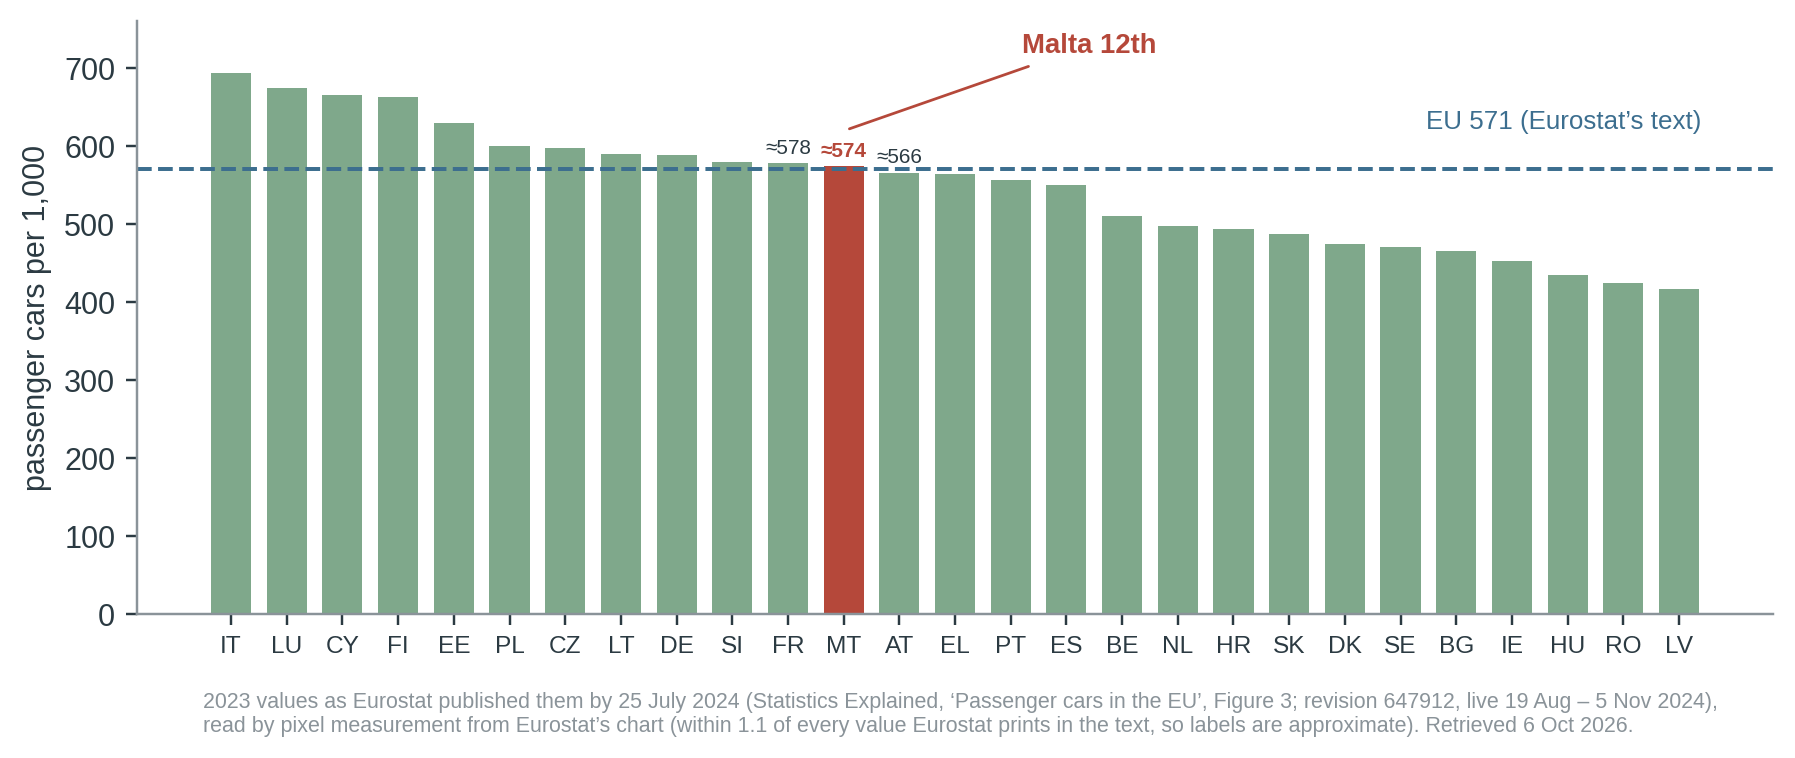
So the article’s 585 and seventh place are the 2022 column of data revised after January 2024: the 2022 value Eurostat first released was about 602 (sixth), and when the article appeared Eurostat’s published 2023 figures put Malta 12th. The article gives conflicting year signals (dataset “as of 2023”, graphic “up to the year 2022”) and states the rank in the present tense.
5 What the data show now
| Indicator | Malta | Comparison | Source | Grade |
|---|---|---|---|---|
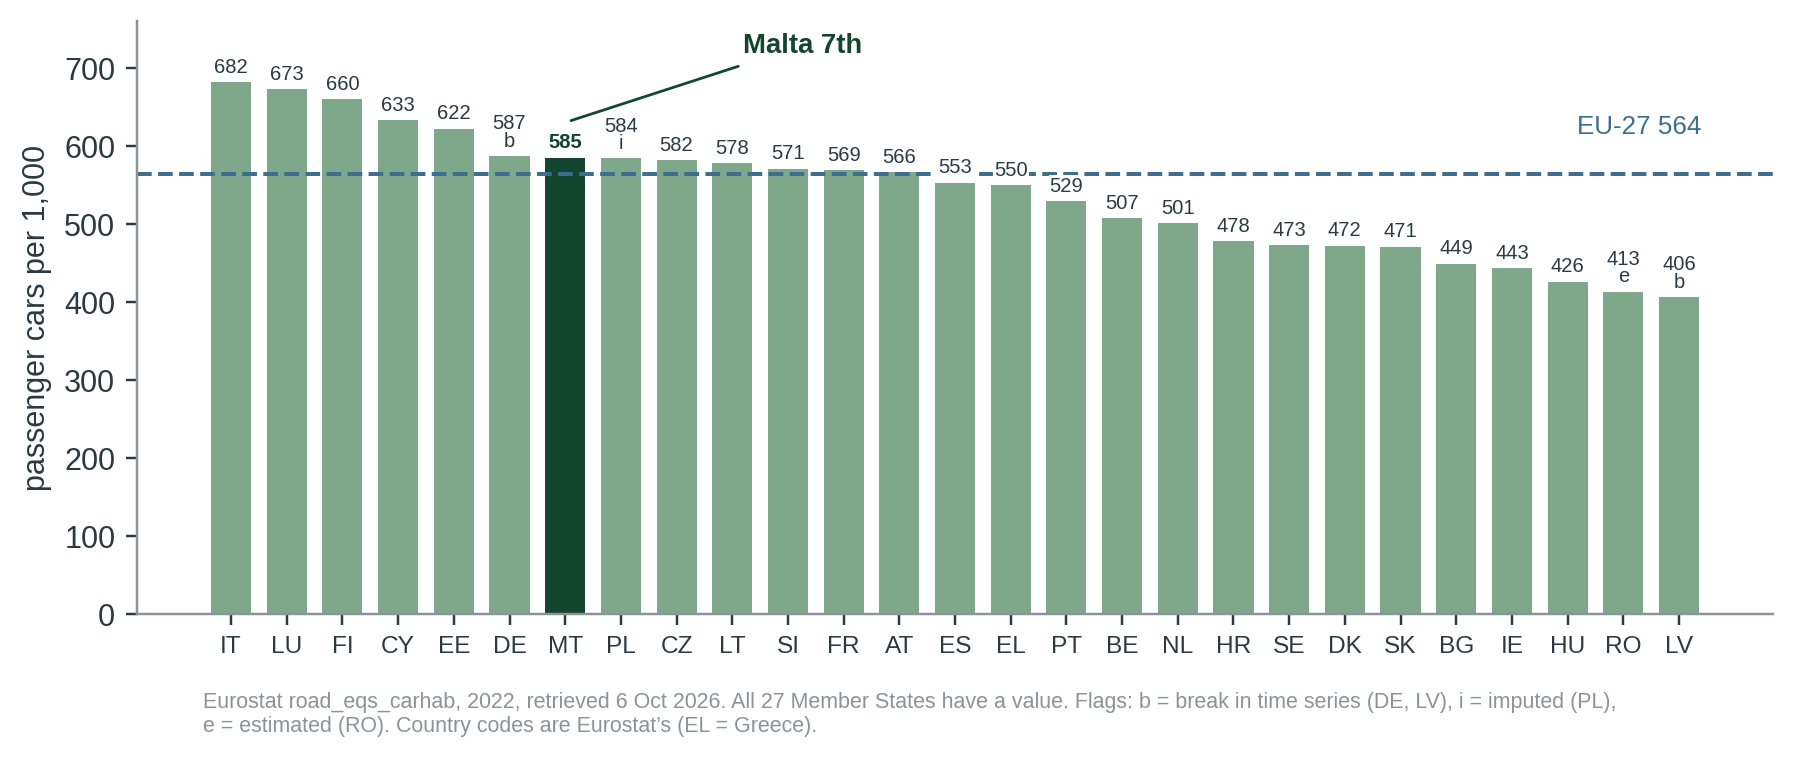
| Passenger cars per 1,000 inhabitants, 2022 (today’s data) | 585 (no flag) | EU-27 564 | Eurostat [2] | C |
| Rank among the EU-27, 2022 (today’s data) | 7th of 27 | Germany 587 (b), Poland 584 (i) | Eurostat [2] | C |
| Rank among all 41 countries in the dataset, 2022 | 9th | Liechtenstein 773, Iceland 611 (i) higher | Eurostat [2] | C |
| Rank, 2024 / 2025 (today’s data) | 13th / 14th | Malta 576 / 571; EU-27 577 / 584 | Eurostat [2] | C |
| Car stock at 31 Dec 2022 vs NSO licensed passenger cars | 317,234 | about 317,400 ◆ | Eurostat [3]; NSO [10] | C |
Flags: b = break in time series, i = imputed. All values in data/cc-075/checks.csv [12]. Malta’s values carry no flag in any year. Earlier published versions: section 4.
Malta’s rank over time
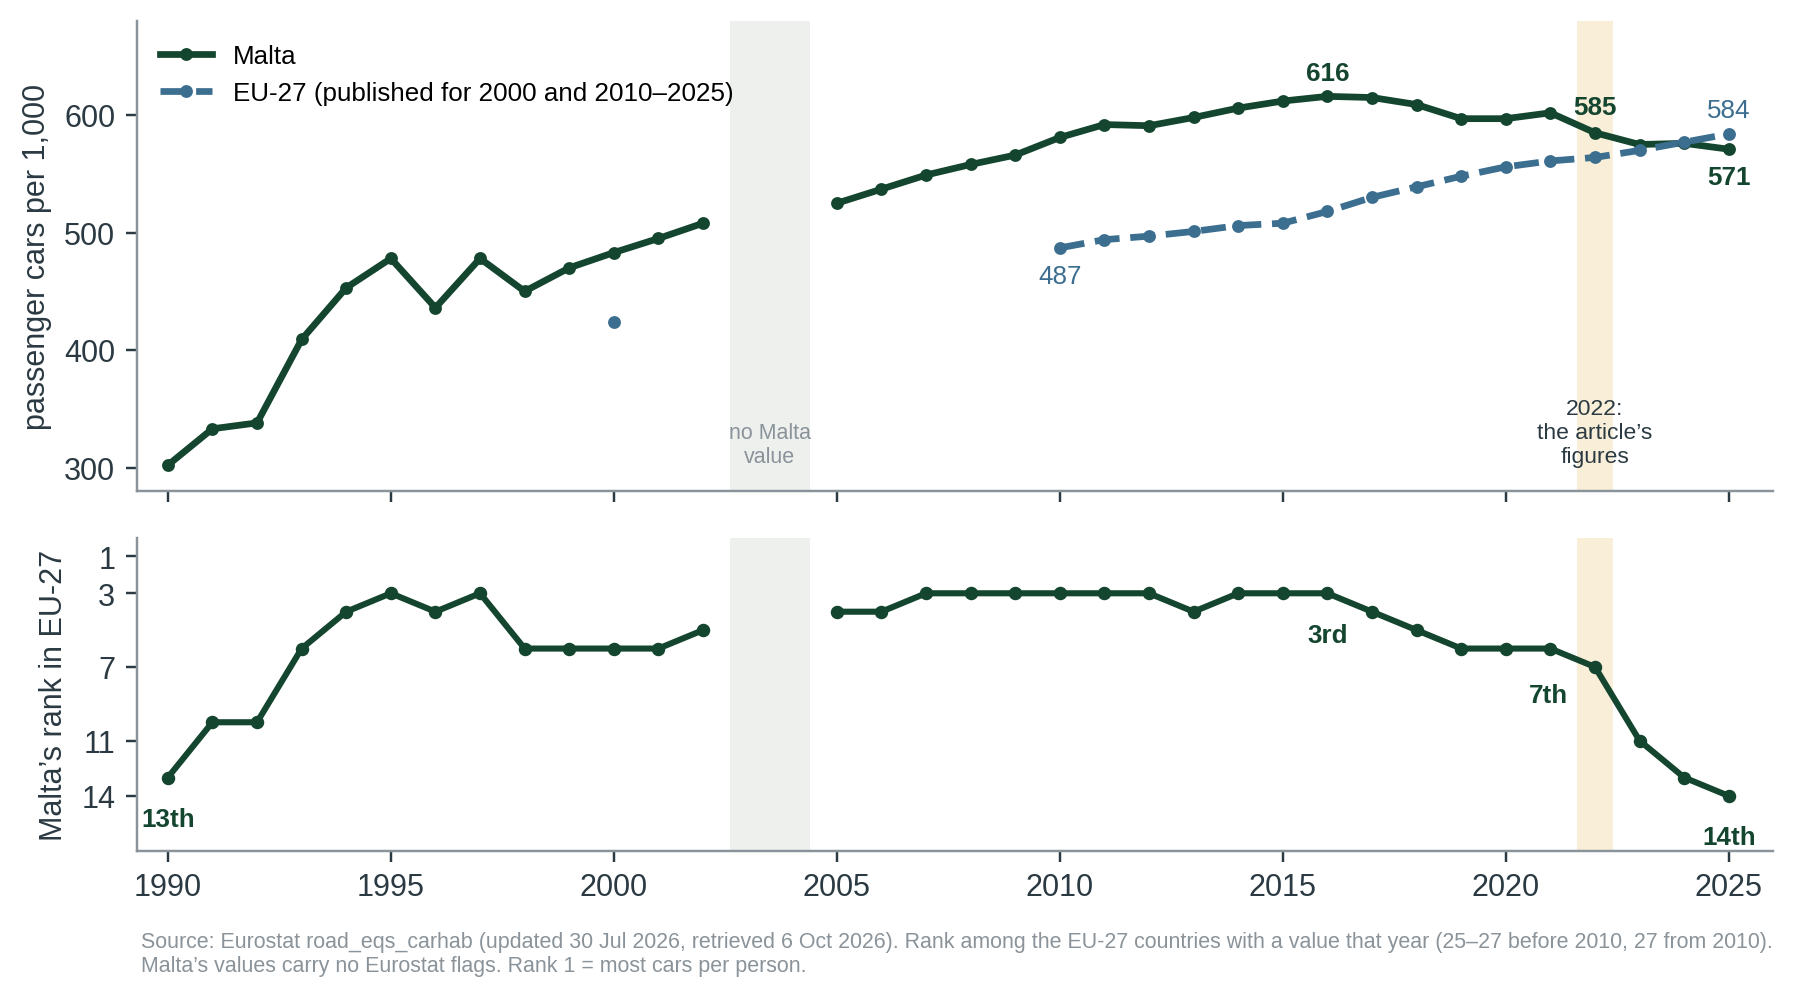
In today’s data Malta’s rate rose from 302 in 1990 to a peak of 616 in 2016, and has drifted down since. Its rank in the EU-27 was third in eleven years (1995, 1997, 2007–2012 and 2014–2016), seventh in 2022 and 14th in 2025, when it fell 13 cars per 1,000 below the EU-27 value (Figure 3) [2]. A 2010 comparative study of four island states described Malta’s car ownership as then “the highest in the European Union” [9]; it used a different measure and earlier data, and in Eurostat’s current series Malta was third in those years.
6 Population growth and car density
The fall in the rate is a population effect. Malta’s passenger car stock grew every year from 2006 to 2025 [3]: by 6,618 in 2023, 6,632 in 2024 and 5,209 in 2025. Its population grew faster: from the end of 2012 to the end of 2025 the car stock rose 34.5% (249,612 to 335,693) and the population 39.6% (421,464 to 588,254) [3, 4]. In 2022 alone the stock rose 1.3% and the population 4.2%, which is why today’s data show the rate dropping from 602 (2021) to 585 (2022); from 2022 to 2025 the population grew 8.5% and the car stock 5.8% [3, 4].
Two different 602s. Eurostat’s January 2024 release gave Malta about 602 for 2022 (read from its chart) [6, 14]. Today’s data give 602 for 2021 and 585 for 2022 [2]. The numbers coincide, but they are values for different years: the 2022 value was revised from about 602 to 585 after January 2024. The car stock is not where the revision lies as far as we can see: the table in Eurostat’s July 2024 version gives 317,234 for 2022, the same as today’s data [3, 13]. Dividing that stock by 602 implies a population of about 527,000, against 542,051 on 1 January 2023 in today’s data [4]. So if the stock was the same in January 2024, the revision is in the population denominator; we did not retrieve the January 2024 stock or population, so the cause of the revision is not identified [12].
Measured per km² of land instead of per person, Malta is far ahead of every other Member State: 1,014 passenger cars per km² in 2022 against 261 in the Netherlands, the next highest, and 1,073 in 2025 [3, 5]. The article’s 246 km² is Malta island (245 km² of land in Eurostat’s data); the whole country, including Gozo and Comino, has 313 km² [5]. The article’s sentence (Malta “up there among the countries with the highest car density”) holds on either area.
7 Where the evidence points different ways
Q1 Was “seventh” Malta’s standing when the article appeared?
NO: 2023 FIGURES PUT MALTA 12THEVIDENCE FOR THE CLAIM'S IMPRESSION
585 and seventh place are right for 2022 in Eurostat’s revised data [2], and the article dates its graphic “up to the year 2022”.
EVIDENCE AGAINST
Eurostat’s article, in the version online from 19 August to 5 November 2024, gave 2023 figures for all 27 Member States, with Malta 12th at about 575 [13]. The Lovin Malta article calls the dataset “as of 2023” but its graphic “up to the year 2022”, and states the rank in the present tense.
Comparability. Eurostat publishes and ranks these rates side by side [6, 7], and Malta’s values carry no flag, but collection methods are “not harmonised at EU level” and registers may hold cars with no “signs of life” [7]. Revisions also move places: after January 2024 Malta’s 2022 value went from about 602 to 585 and Poland’s from about 571 to 584 [2, 6]. Places 6 to 9 in 2022 are within five cars per 1,000 (Germany 587, Malta 585, Poland 584, Czechia 582). Exact positions are fragile, a further reason to give the year and the version of the data with a rank.
8 Testing the claim
Each statement in the article, rated on its own; the verdict (section 9) weighs them together.
| Sub-claim | What the evidence shows | Rating |
|---|---|---|
| A. Malta has 585 cars per 1,000 inhabitants | Right for 2022 in data revised after January 2024: 585, no flag; rebuilt from 317,234 cars and 542,051 people [2–4]. Eurostat’s January 2024 release had about 602 [6]. | ACCURATE (2022, REVISED DATA) |
| B. Ranked number seven, between Germany and Poland | Seventh of 27 for 2022 in today’s data, between Germany 587 (b) and Poland 584 (i) [2]. In the January 2024 release Malta was sixth and Poland 11th [6]. | ACCURATE (2022, REVISED DATA) |
| C. Presented as current: dataset “as of 2023”, Malta “is ranked” seventh | The article gives conflicting year signals (dataset “as of 2023”, graphic “up to the year 2022”) and states the rank in the present tense. Eurostat had published 2023 figures by 25 Jul 2024: Malta about 575, 12th [13]. Separately, in today’s revised data Malta is 11th for 2023 [2]. | OUT OF DATE WHEN PUBLISHED |
| D. Italy top at 682, Latvia lowest at 409 | Italy 682 matches today’s 2022 data (684 in January 2024); Latvia is lowest in every version (406 now, 414 then) [2, 6]. | LARGELY ACCURATE |
| E. “Approximately 1 car for every 2 people” | 585 per 1,000 is one car for every 1.71 people [2]; the rounding understates the rate. | LOOSELY WORDED |
| F. 246 km² of land; among the highest car density in Europe | 246 km² is Malta island; the country has 313 km² of land [5]. With 1,014 cars per km² of land Malta is first in the EU, 3.9 times the Netherlands [3, 5]. | LARGELY ACCURATE |
The figure and rank (A, B) reproduce from Eurostat’s data for 2022, but only from the version revised after January 2024. How they are presented (C) is the problem: the article reports them as Malta’s current standing when Eurostat’s published 2023 figures put Malta 12th. The side remarks (D–F) are right in direction: Latvia’s figure differs by data version, “1 car for every 2 people” understates Malta’s rate, and 246 km² is the main island, though Malta leads the EU on car density on either area.
9 Verdict and requests for evidence
The 2022 figure is right in revised data, but the article presents seventh in the present tense, with conflicting dates, when Eurostat’s 2023 figures, published two months earlier, put Malta about 12th. Confidence: moderate.
Why. (1) Malta’s 585 and seventh place, between Germany and Poland, match Eurostat’s 2022 data as revised after January 2024; Eurostat’s January 2024 release had Malta sixth at about 602 [2, 6]. (2) By 23–25 July 2024 Eurostat had published 2023 figures for all 27 Member States, and the version of its article that showed them was online from 19 August to 5 November 2024: Malta about 575, 12th [13]. (3) The article calls the dataset “as of 2023” but its graphic “up to the year 2022”, and says “Malta is ranked number seven” in the present tense without mentioning the 2023 figures. Readers would take seventh as Malta’s latest standing; on Eurostat’s published figures it was not. Individual statements are defensible, but the omission makes the overall impression inaccurate, which is the scale’s definition of Misleading. (4) Confidence is moderate, not high. The facts are well documented: Eurostat’s dated revision history, the chart file with its upload time and checksum, the values in Eurostat’s text and our pixel reading all agree [12, 13]. What is open is interpretive: the article’s own dates conflict, and a reader who noticed “up to the year 2022” could fairly take seventh as a 2022 rank. The documents are listed in the claim record (evidence shown).
What this verdict does not say. It does not say the 585 figure is wrong (it is right for 2022 in today’s data), and it says nothing about intent: the graphic the article used may itself have been built from 2022 data. It assesses the article as published. It also says nothing about congestion, pollution or transport policy.
Evidence we are asking for
- From Lovin Malta: the graphic it used (Paula Lago, The European Correspondent), the data year and Eurostat release behind the 585 and the seventh place, and whether the article was checked against Eurostat’s 2023 figures.
- From NSO or Transport Malta: the stock of licensed passenger cars by year, the number of rented cars in it, and the number of registered but unlicensed (garaged) cars.
Right of reply. Under the project’s rule a reply is sought for a Misleading verdict. A right-of-reply letter to Lovin Malta will be drafted for the maintainer; any response will be appended and the verdict revisited. Until the reply deadline has passed, this draft verdict is shown only on Miżien’s own site.
10 Limitations
- Eurostat’s database serves only current data. What Eurostat had published earlier is shown through its Statistics Explained revisions and charts [13, 14] and its January 2024 release [6], not through a copy of the database itself. For September 2024 we saw only the Statistics Explained revision and its figure as published, not the database tables road_eqs_carhab and road_eqs_carmot, whose past vintages cannot be retrieved. The data year behind the article’s figures is not confirmed: the article’s own dates conflict.
- The earlier values are read from Eurostat’s charts by pixel measurement; they match every value Eurostat prints within 1.2 cars per 1,000. Malta’s 12th place in 2023 is read from the chart, about 3 cars per 1,000 behind France (about 578) and about 8 ahead of Austria, so 11th or 12th is within reading error; either is far from seventh.
- The cause of the revision of Malta’s 2022 value from about 602 to 585 is not identified (section 6): the January 2024 car stock and population were not retrieved.
- The graphic the article used (Paula Lago, The European Correspondent) was not found (the embedded Instagram post needs a login; web.archive.org reset every connection). Eurostat’s methodology page for road equipment returned “not found”, so the denominator was established by recomputation.
- NSO and Transport Malta refused scripted access. The licensed-vehicle figures [10, 11] are second-hand (◆); Newsbook’s passenger-car counts are internally inconsistent and are not used. No readable count of rented cars in Malta’s stock was found.
- Warren and Enoch [9] is a comparative study with data from the 2000s and a different measure; it is context only.
References
- [1] Darmanin J. (21 Sep 2024). Malta Ranked Number Seven On Eurostat’s ‘Passenger Cars Per 1,000 Inhabitants’ Dataset. Lovin Malta. (Read in full, 6 Oct 2026.) https://lovinmalta.com/malta/malta-ranked-number-seven-on-eurostats-passenger-cars-per-1000-inhabitants-dataset/
- [2] Eurostat. road_eqs_carhab Passenger cars – per thousand inhabitants; updated 30 Jul 2026, retrieved 6 Oct 2026, with flags. doi:10.2908/ROAD_EQS_CARHAB. https://ec.europa.eu/eurostat/databrowser/view/road_eqs_carhab/default/table?lang=en
- [3] Eurostat. road_eqs_carmot Passenger cars, by type of motor energy and size of engine (total); updated 1 Sep 2026, retrieved 6 Oct 2026, with flags. doi:10.2908/ROAD_EQS_CARMOT. https://ec.europa.eu/eurostat/databrowser/view/road_eqs_carmot/default/table?lang=en
- [4] Eurostat. demo_gind Population change – demographic balance and crude rates at national level (population on 1 January); updated 30 Sep 2026, retrieved 6 Oct 2026. https://ec.europa.eu/eurostat/databrowser/view/demo_gind/default/table?lang=en
- [5] Eurostat. reg_area3 Area by NUTS 3 region (land area); updated 22 Jan 2026, retrieved 6 Oct 2026. https://ec.europa.eu/eurostat/databrowser/view/reg_area3/default/table?lang=en
- [6] Eurostat (17 Jan 2024). Passenger cars per 1 000 inhabitants reached 560 in 2022. Eurostat news, with the chart “Motorisation rate of passenger cars in the EU, 2012 and 2022” (sha1 236d4565…). Read 6 Oct 2026. https://ec.europa.eu/eurostat/web/products-eurostat-news/w/ddn-20240117-1
- [7] Eurostat. Passenger cars in the EU. Statistics Explained; data extracted July 2026. Read 6 Oct 2026 (PDF). https://ec.europa.eu/eurostat/statistics-explained/index.php?title=Passenger_cars_in_the_EU
- [8] Eurostat. Transport equipment statistics. Statistics Explained; data extracted December 2025. Read 6 Oct 2026 (PDF). https://ec.europa.eu/eurostat/statistics-explained/index.php?title=Transport_equipment_statistics
- [9] Warren J.P., Enoch M.P. (2010). Island transport, car ownership and use: a focus on practices in Cuba, Malta, Mauritius and Singapore. Island Studies Journal 5(2):193–216. doi:10.24043/isj.244. (Full text read.) https://doi.org/10.24043/isj.244
- [10] ◆ National Statistics Office Malta (15 Feb 2023). Motor Vehicles: Q4/2022, News Release 023/2023. Not read (403); figures from a search summary. https://nso.gov.mt/wp-content/uploads/News2023_023.pdf
- [11] ◆ Balzan J. (30 Jul 2025). Over 450,000 licensed vehicles on Malta’s roads, NSO confirms. Newsbook (a report of NSO’s Q2/2025 release). Read 6 Oct 2026. https://newsbook.com.mt/en/over-450000-licensed-vehicles-on-maltas-roads-nso-confirms/
- [12] Miżien. Data and calculations: data/cc-075/; tools/cc-075-report/ (calc.py, read_charts.py).
- [13] Eurostat. Passenger cars in the EU. Statistics Explained, revision 647912 (saved 19 Aug 2024, replaced 5 Nov 2024; “Data extracted in July 2024”), with Figure 3 “Motorisation rate, 2023” (file uploaded 25 Jul 2024, sha1 7dd8b8d6…) and Table 2. Read through the MediaWiki API, 6 Oct 2026. https://ec.europa.eu/eurostat/statistics-explained/api.php?action=query&prop=revisions&revids=647912&rvprop=content|timestamp&rvslots=main&format=json
- [14] Eurostat. Passenger cars in the EU. Statistics Explained, revision 627098 (31 Jan 2024; “Data extracted in December 2023”), with Figure 3 “Motorisation rate, 2022” (file uploaded 16 Jan 2024, sha1 2eb4c04f…). Read through the MediaWiki API, 6 Oct 2026. https://ec.europa.eu/eurostat/statistics-explained/api.php?action=query&prop=revisions&revids=627098&rvprop=content|timestamp&rvslots=main&format=json
Appendix A: series standards and verdict scale
Every investigation in this series follows the same rules so that verdicts are comparable and challengeable.
| Verdict | Meaning |
|---|---|
| SUPPORTED | Evidence consistently backs the claim as stated. |
| LARGELY SUPPORTED | Backed by the evidence, with minor caveats that do not change the substance. |
| NOT SUBSTANTIATED | Stated more strongly than the evidence offered or available allows. May be true in some conditions but has not been shown. |
| MISLEADING | Omits material facts so that the overall impression is inaccurate, even if individual statements are defensible. |
| CONTRADICTED | The available evidence points against the claim. |
Confidence
High: multiple independent lines of evidence agree. Moderate: evidence is relevant but incomplete or indirect. Low: evidence is thin, second-hand or conflicting.
Evidence grades
A experiment · B observational study with a control or gradient · C review, guidance or official statistics · D assertion or anecdote. ◆ marks a source known only second-hand.
Standards
- Quote the speaker, not the headline, with outlet and date, and link the original where possible.
- Separate the claim from the evidence offered for it, and say who made which statement.
- Grade the evidence and show differing views side by side where the evidence is unsettled.
- State what we could not access or verify, and what would change the verdict either way.
- Ask for the missing evidence in specific, answerable requests.
- Offer a right of reply where a check finds a claim Not substantiated, Misleading or Contradicted (or a pledge Not measurable, Off track or Missed), before wider circulation, and append responses.
- Correct errors openly with a version number and change log.
- Whistle-blow only on evidence: a verdict of Misleading or Contradicted requires documents or data that can be shown, not inference.
- Check every side. Government, opposition, NGOs and developers are held to the same standard.
Appendix B: revision log
| Version | Date | Change |
|---|---|---|
| 1.0 | 6 Oct 2026 | First issue. Draft verdict Misleading (high confidence); pending right of reply. |
| 1.1 | 6 Oct 2026 | Corrections after the 6 Oct 2026 audit. The article gives conflicting year signals (“as of 2023”, graphic “up to the year 2022”), not “no year”; wording corrected throughout. Verdict stays Misleading; confidence lowered from high to moderate (readers’ reading of the conflicting dates). Clarified: the two “what would move the verdict” boxes; the 602 to 585 revision (section 6); right-of-reply sentence; limitations (database vintages not seen; 11th or 12th within reading error). Pending right of reply. |
Sources and archived copies
-
Malta Ranked Number Seven On Eurostat's 'Passenger Cars Per 1,000 Inhabitants' Dataset, Lovin Malta (J. Darmanin), 21 Sep 2024.
Original · Archived copy
The claim, in the outlet's own words. Read in full on 6 Oct 2026 (page and WordPress API, post 148257). Calls Eurostat's dataset 'as of 2023' and dates its graphic (Paula Lago, The European Correspondent) 'up to the year 2022'; the sentence with the 585 and the rank carries no year of its own. -
Passenger cars in the EU (Statistics Explained), revision 647912, Eurostat, 19 Aug 2024 (live until 5 Nov 2024).
Original · fetched and fingerprinted 2026-10-10; no public snapshot yet
What Eurostat had published on the article's date. 'Data extracted in July 2024'; Figure 3 'Motorisation rate, 2023' (all 27 Member States; Malta about 575, 12th); text Italy 694, EU 571. Read through the MediaWiki API on 6 Oct 2026. -
Passenger cars per 1 000 inhabitants reached 560 in 2022, Eurostat, 17 Jan 2024.
Original · fetched and fingerprinted 2026-10-10; no public snapshot yet
Eurostat's release of the 2022 figures; its chart puts Malta sixth at about 602 (later revised to 585). Read 6 Oct 2026. -
Passenger cars - per thousand inhabitants (road_eqs_carhab), Eurostat, updated 30 Jul 2026.
Original · Archived copy
Today's data, retrieved 6 Oct 2026 with flags; 2022 Malta 585, 7th; rebuilt from road_eqs_carmot and demo_gind.
Right of reply
The body concerned has not yet been asked to reply. Its response will be published here, beside the verdict.
Connections
How this claim relates to the others: who made it, the themes it shares with other claims, and the patterns it shows. A connection is a reason to read two checks side by side. It does not make either one right or wrong. How connections are found.
Who made it
Other claims by Lovin Malta 1
Linked directly 1
Claims that share a theme with this one. A theme is a cause, a mechanism, a target or a way of presenting figures that the editors have found in several claims; its strength says how close the link is.
Transport, air and climate Shared driver · Strong
Fleet growth links traffic claims, air quality and emissions. The climate report names transport and buildings as the lagging sectors.
Two steps away 4
Not linked to this claim directly, but linked to a claim that is. These are found by following the links, not chosen by the editors, so they are looser: they show where one theme meets another.
- CC-007 Within EU limits vs WHO guideline (Largely supported)through Transport, air and climateCC-110Selective-metric pattern
- CC-026 EU's largest rise in emissions (Largely supported)through Transport, air and climateCC-110Transport, air and climate
- CC-072 EUR 15m to take cars off the road (not yet checked)through Transport, air and climateCC-110Transport, air and climate
- CC-109 EU: transport is 48% of effort-sharing emissions (Largely supported)through Transport, air and climateCC-110Transport, air and climate
Three steps away 15
One step further again. At this distance a connection says more about how the themes fit together than about this claim.
- CC-003 Per-capita emissions vs 2030 projection (Misleading)through Transport, air and climateCC-110Selective-metric patternCC-007Transport, air and climate
- CC-004 'Strong progress' in waste separation (Not substantiated)through Transport, air and climateCC-110Selective-metric patternCC-007Selective-metric pattern
- CC-008 Flyovers and congestion (Not substantiated)through Transport, air and climateCC-110Selective-metric patternCC-007Transport, air and climate
- CC-010 Tree-planting counts (Largely supported)through Transport, air and climateCC-110Selective-metric patternCC-007Selective-metric pattern
- CC-016 Shore-to-ship: 90% less harbour pollution (Misleading)through Transport, air and climateCC-110Selective-metric patternCC-007Transport, air and climate
- CC-020 EP study: noise law not the cause (Largely supported)through Transport, air and climateCC-110Selective-metric patternCC-007Compliance-not-health pattern
- CC-021 Malta-Gozo tunnel traffic (not yet checked)through Transport, air and climateCC-110Selective-metric patternCC-007Transport, air and climate
- CC-025 Per-capita emissions down 44% since 2005 (Largely supported)through Transport, air and climateCC-110Transport, air and climateCC-026Selective-metric pattern
- CC-031 Gozo, first climate-neutral region (Largely supported)through Transport, air and climateCC-110Transport, air and climateCC-026Shared emissions figures
- CC-033 Delimara: 'much cleaner air' (not yet checked)through Transport, air and climateCC-110Selective-metric patternCC-007Compliance-not-health pattern
- CC-035 PM2.5 death rate down two-thirds (Largely supported)through Transport, air and climateCC-110Selective-metric patternCC-007Transport, air and climate
- CC-071 EUR 100m a year for free buses (Not substantiated)through Transport, air and climateCC-110Transport, air and climateCC-072Transport, air and climate
- CC-094 Commission: Malta to emit more in 2030 than in 2005 (Supported)through Transport, air and climateCC-110Transport, air and climateCC-1092030 carbon target
- CC-114 PN: only EU state with rising emissions intensity (Misleading)through Transport, air and climateCC-110Transport, air and climateCC-026Shared emissions figures
- CC-115 Chamber: congestion cost EUR 770m, 3.4% of GDP (Not substantiated)through Transport, air and climateCC-110Transport, air and climateCC-109Transport, air and climate
Timeline
What was said, what was published before and after it, and each step of this check, in date order. Statements and sources carry the date they were published. The steps of the check carry the date the research was done, from the check's research log. Other statements by the same body on the same topic show whether a position was repeated, changed or corrected.
2010
- 2010 Evidence published Island Transport, Car Ownership and Use: A Focus on Practices in Cuba, Malta, Mauritius and Singapore (Warren and Enoch), Island Studies Journal 5(2):193-216
2023
- 15 February 2023 Evidence published Motor Vehicles: Q4/2022 (News Release 023/2023), NSO Malta
2024
- 17 January 2024 Evidence published Passenger cars per 1 000 inhabitants reached 560 in 2022, Eurostat
- 17 January 2024 Evidence published Motorisation rate of passenger cars in the EU, 2012 and 2022 (chart in news release ddn-20240117-1), Eurostat
- 31 January 2024 Evidence published Passenger cars in the EU (Statistics Explained), revision 627098, with Figure 3 'Motorisation rate, 2022', Eurostat
- 6 May 2024 Evidence published Passenger cars per inhabitant remain stable in 2022, Eurostat
- 21 September 2024 The statement Lovin Malta (reporting Eurostat) (this claim)
- 21 September 2024 Reported Malta Ranked Number Seven On Eurostat's 'Passenger Cars Per 1,000 Inhabitants' Dataset, Lovin Malta
2025
- 21 May 2025 Evidence published Passenger cars per inhabitant stable in 2023, Eurostat
- 30 July 2025 Reported Over 450,000 licensed vehicles on Malta's roads, NSO confirms (J. Balzan), Newsbook
2026
- 30 September 2026 Evidence published Population change - demographic balance (demo_gind), Eurostat
- 4 October 2026 Added to the claims to check
- 6 October 2026 Check started Check started in the maintainer session. Eurostat road_eqs_carhab, road_eqs_carmot, demo_gind and reg_area3 downloaded through the dissemination API with flags; Eurostat news of 17 Jan 2024 and two Statistics Explained articles read; Crossref and OpenAlex searched (Warren and Enoch 2010 read in full).
- 6 October 2026 Exact wording found Verbatim wording found on the Lovin Malta page (21 Sep 2024), confirmed through its WordPress API. The figures match Eurostat's 2022 data as it stands today: 585, seventh of 27, between Germany (587) and Poland (584).
- 6 October 2026 Note Not reachable from this network: web.archive.org (connection reset), nso.gov.mt and transport.gov.mt (403), the European Correspondent graphic and the embedded Instagram post (login). NSO licensed-vehicle figures used second-hand only.
- 6 October 2026 Note Data vintage finding (after an independent review in the maintainer session). Eurostat's Statistics Explained article 'Passenger cars in the EU' read through its MediaWiki API: revision 647912 (saved 19 Aug 2024, live until 5 Nov 2024; 'Data extracted in July 2024') gives 2023 values from 23 Jul 2024 and charts them for all 27 Member States in Figure 3 (file uploaded 25 Jul 2024, sha1 7dd8b8d6...): Malta about 575, 12th (France about 578 above, Austria about 566 below; pixel reading within 1.1 of every value Eurostat prints). Eurostat's release of 17 Jan 2024 and the January 2024 Figure 3 had Malta's 2022 value at about 602, sixth, so the 585 is a later revision. The article presents the 2022 rank as current; verdict set to Misleading (high), pending right of reply from Lovin Malta. The draft's earlier verdict (Largely supported) was never published.
- 6 October 2026 Version 1.0: first issue First issue. Draft verdict Misleading (high confidence); pending right of reply (Lovin Malta).
- 6 October 2026 Version 1.1 1.1: corrections after the 6 Oct 2026 audit: year wording, confidence High to Moderate, what-would-move boxes, 602 to 585 explanation, reply sentence, limitations. Pending right of reply. Verdict in this version: Misleading, moderate confidence.
- 6 October 2026 Evidence reviewed
- 6 October 2026 Correction Wording on the year corrected. The article does not 'give no year': it calls Eurostat's dataset 'as of 2023' and says its graphic illustrates the rankings 'up to the year 2022'. Replaced 'no year given' (claim text, cover, TL;DR, sections 1, 4, 7 and 9, flyer) with the accurate finding: conflicting year signals, and seventh place in the present tense although Eurostat's already-published 2023 figures put Malta about 12th. Verdict stays Misleading; confidence lowered from High to Moderate (maintainer decision), because the interpretive question is what readers take from the conflicting dates. all corrections
- 6 October 2026 Clarification Both 'what would move the verdict' boxes rewritten (up no longer cites the article telling readers the year was 2022; down: none foreseen). Section 6 explains the two 602s: the January 2024 value for 2022 (about 602) equals today's 2021 value; the car stock is unchanged (317,234 in revision 647912 and today), so the revision is in the population denominator (implied about 527,000 against 542,051) or its cause is unidentified (January 2024 stock and population not retrieved); checks added to data/cc-075/checks.csv. Section 9: 'A letter ... has been drafted' replaced by 'will be drafted'. Limitations: only the Statistics Explained revision and figure were seen for September 2024, not the database tables; Malta's 2023 rank is read from the chart (about 3 per 1,000 behind France), so 11th or 12th is within reading error, either far from seventh. Status: pending right of reply. all corrections
2027
- 6 October 2027 Coming up: Evidence review due Each finished check is reviewed against new evidence within a year.

Every change to this claim's record is public: history of the record.
Download the report and flyer