CC-019 · Land & Trees · Land take & agriculture
830,000 m2 of land lost in five years
Not substantiated Moderate confidence Draft: right of reply pending
Parts of this claim
The claim is split into parts that are tested separately, as in the report below. Each part has its own number.
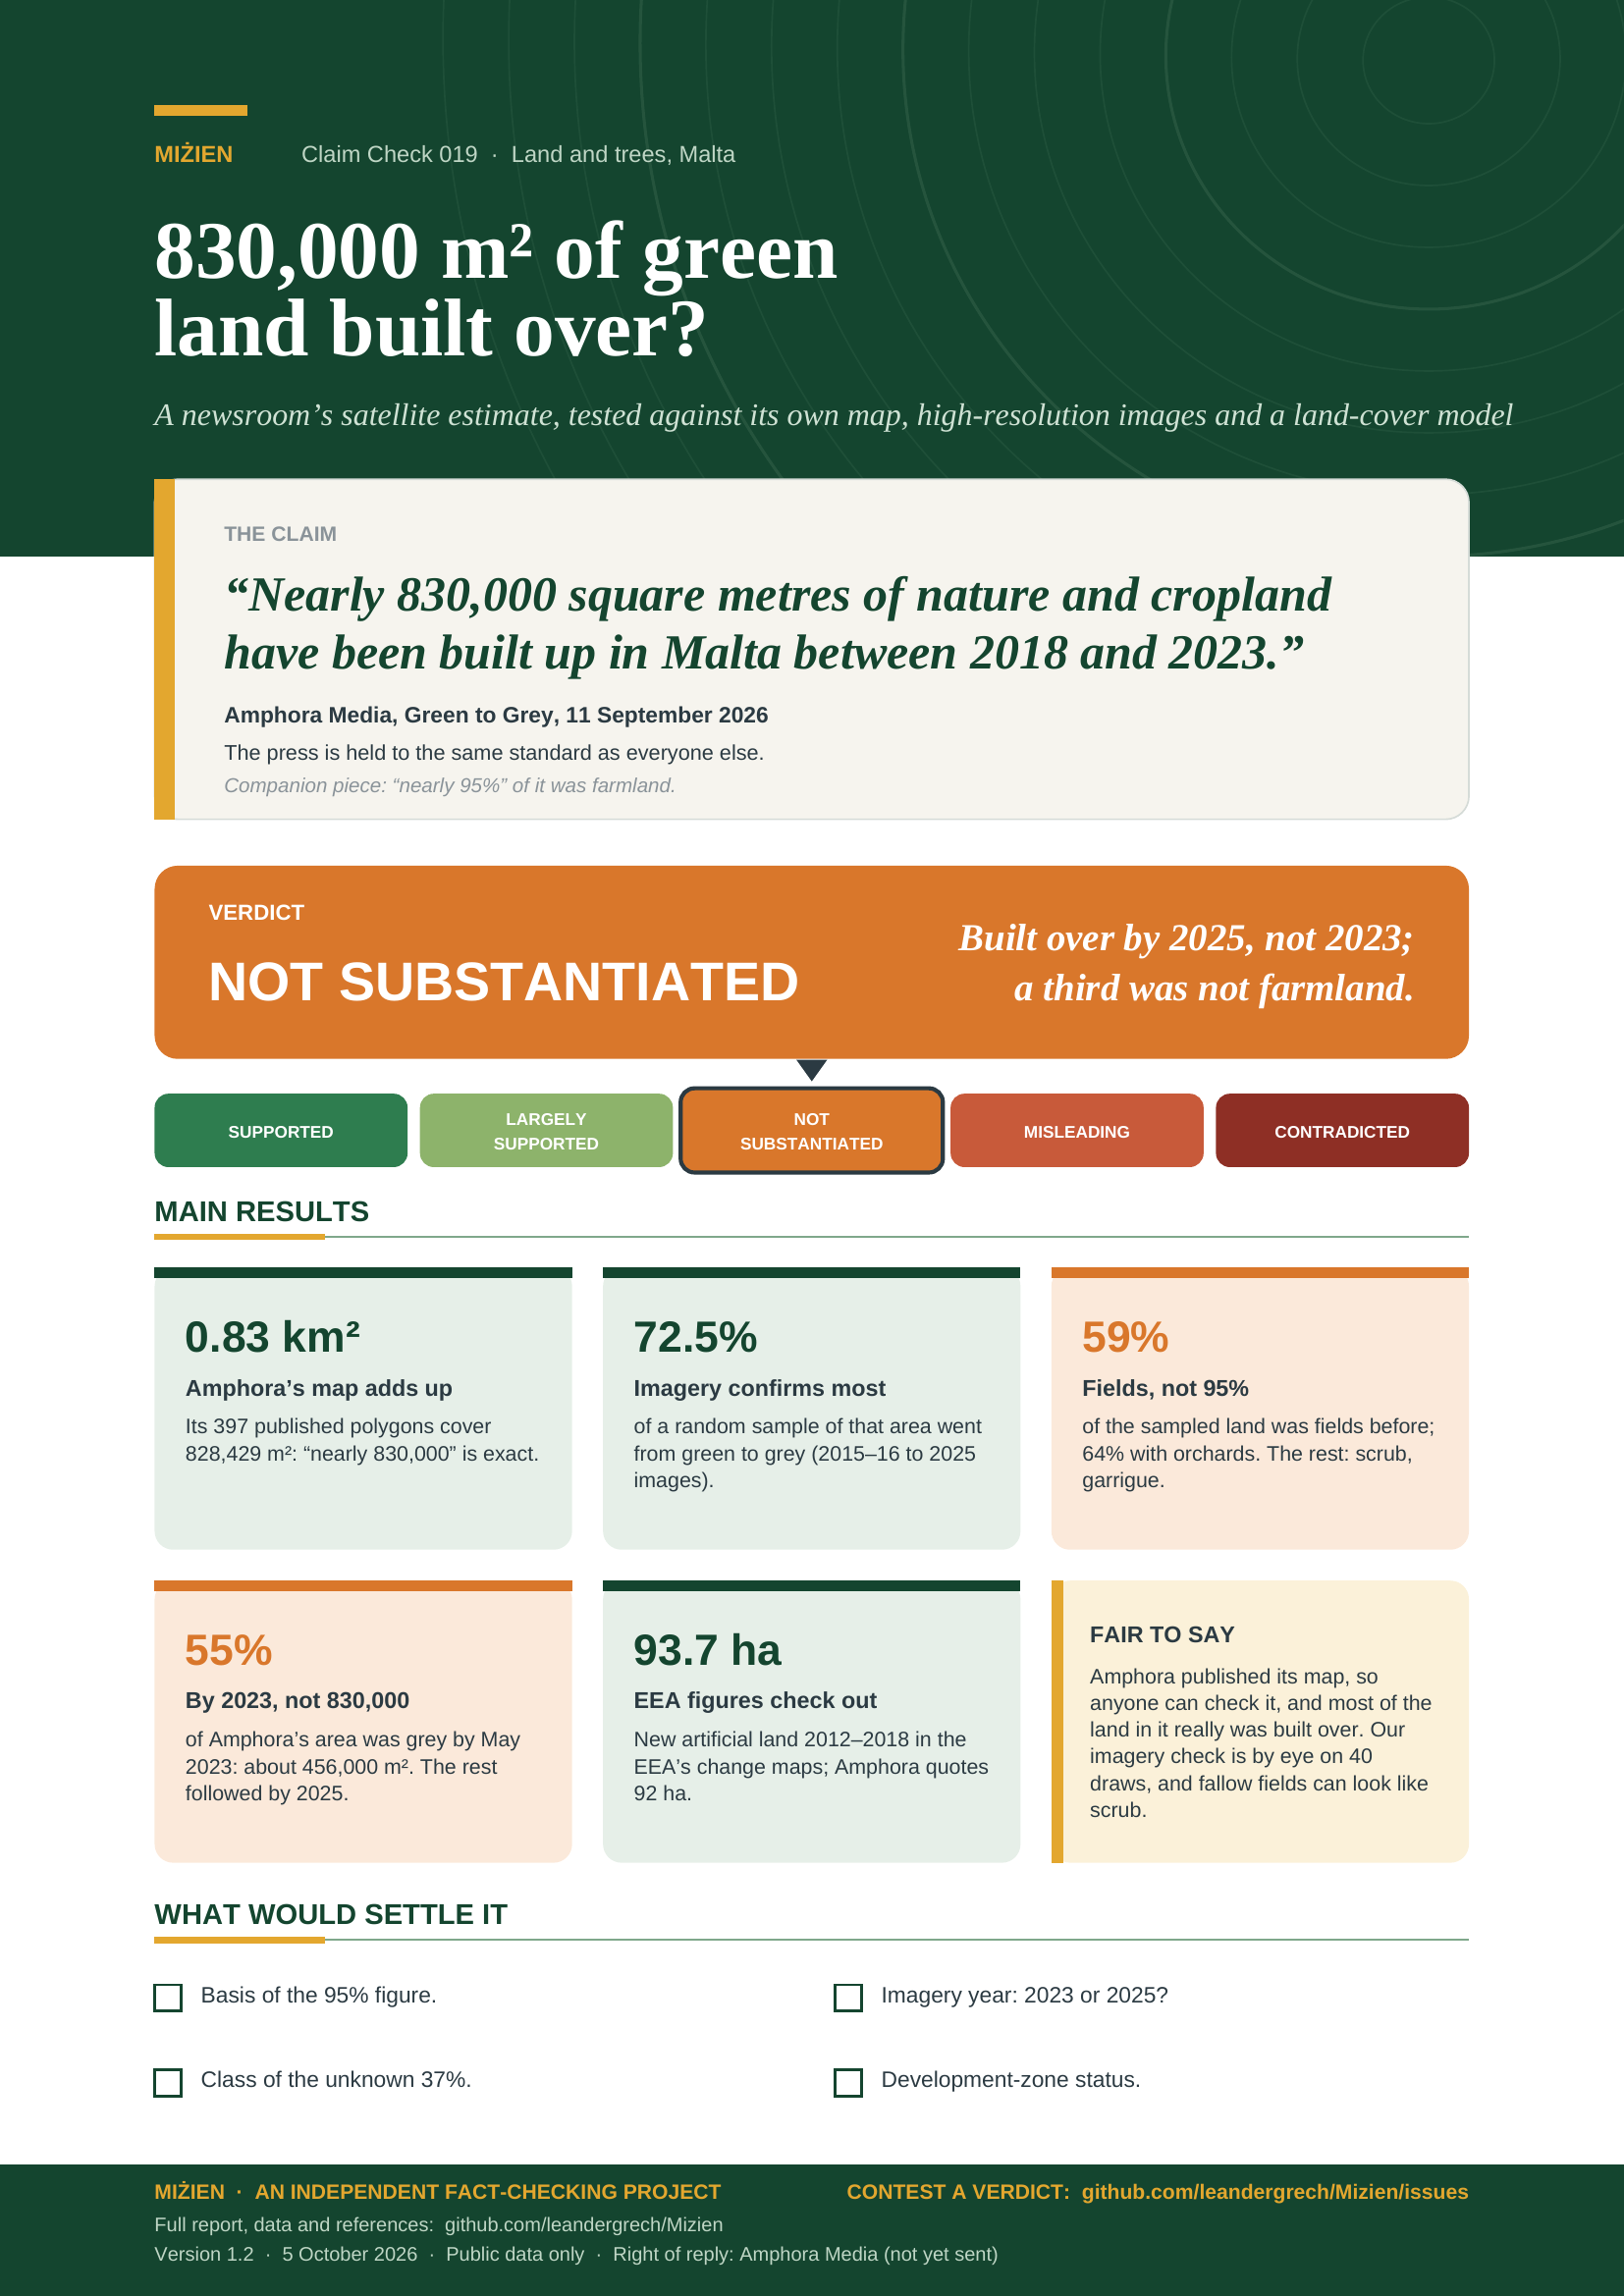
- CC-019A About 830,000 m² of green land built up 2018–2023Amphora’s polygons add up to 828,429 m² (two, 4,429 m², were sea in 2018). Imagery confirms green to grey for 72.5% of a random sample of the area (57–84%; about 600,000 m²), but only 55% by May 2023 (about 456,000 m²); 15% was being developed by September 2018. True for 2018–2025, not for the period stated.
- CC-019B 0.26% of land; comparisons (pitches, Comino, Manoel)Arithmetic checks out (Comino: 0.24 of the 3.5 km² often quoted, 0.30 of the OSM outline; Manoel: 2.7, not two).
- CC-019C Nearly 95% of take-up was farmlandCropland + grass = 96% of the area with a known 2018 class (our reading of the basis), but only if all grass is farmland; 37% has no class. In imagery, fields were 59% of the sampled land (43–73%), 64% with orchards; 36% was scrub or garrigue.
- CC-019D EEA figures and the 1.94 km² totalCORINE change maps: 20.6 ha (2006–12) and 93.7 ha (2012–18) [9]; EEA chart 0.91–0.94 km² [7]; sum correct.
Claim Check 019 · Land and trees
830,000 m² of green land built over?
Testing a newsroom’s satellite estimate of land lost to development in Malta against its own map, satellite images, an independent land-cover model and EEA data
“Nearly 830,000 square metres of nature and cropland have been built up in Malta between 2018 and 2023.”
Amphora Media, Green to Grey, 11 September 2026.
Companion piece: nearly 95% of the take-up was farmland.
Verdict: Not substantiated Mostly built over, but by 2025, not 2023; a third not farmland
Version 1.2 · 5 October 2026
TL;DR
In September 2026 Amphora Media, an investigative newsroom, reported that “nearly 830,000 square metres of nature and cropland have been built up in Malta between 2018 and 2023”, and that in “nearly 95% of the take-up, farmland rather than natural area was affected”. The press is held to the same standard as everyone else here. We checked the arithmetic, the map Amphora published, a random sample of it against high-resolution satellite images, an independent land-cover product and the EEA’s land-change maps.
- Amphora’s own map adds up. The 397 change polygons behind Amphora’s map cover 828,429 m², so “nearly 830,000” is exact; the headline’s “over” is not. The arithmetic and the EEA figures it quotes check out.
- Imagery confirms most of it, but by 2025, not 2023. In 40 random draws checked against satellite images, 72.5% of Amphora’s area (57–84%; about 600,000 m²) went from green to grey. Only 55% (about 456,000 m²) was grey by May 2023, the end of the stated period.
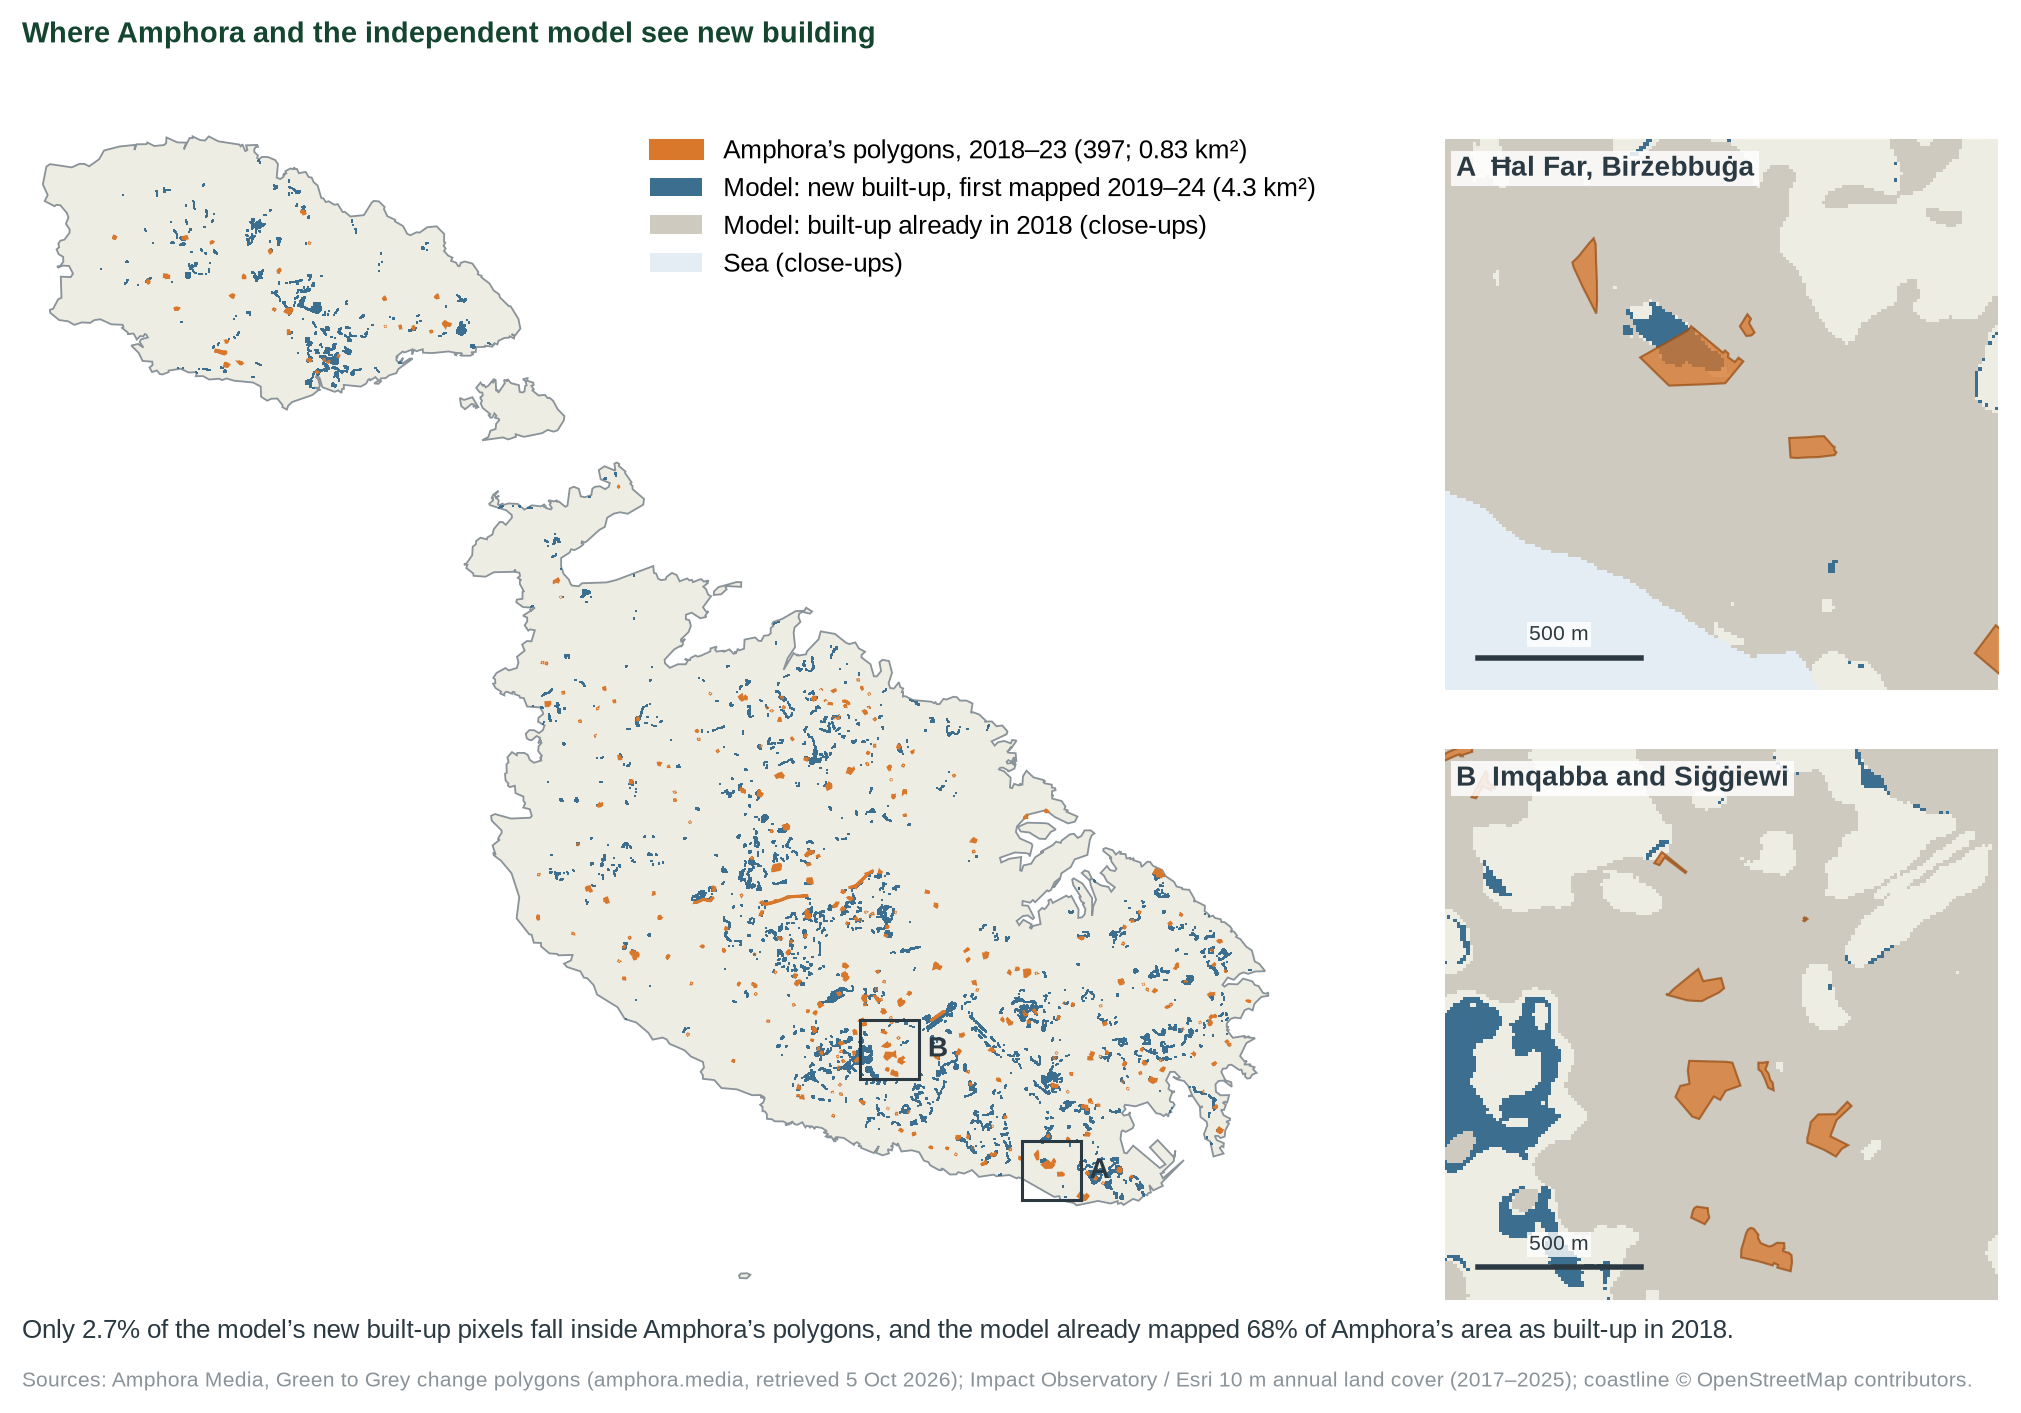
- An independent model gets these parcels wrong. Impact Observatory’s 10 m maps show 68% of Amphora’s area as built-up already in 2018, which the imagery contradicts; only 2–3% of the model’s new built-up land lies inside the polygons. It can neither confirm nor rule out 0.83 km².
- The 95% farmland share is overstated. Amphora’s own data reach 96% only by counting all “grass” as farmland and leaving out the 37% with no 2018 class. In our imagery sample, fields were 59% of the land before (64% with orchards).
- Verdict: not substantiated (moderate confidence). Most of the land Amphora mapped was built over, but by 2025, not 2023, and about a third was scrub and garrigue, not farmland.
- Supported
- Largely supported
- Not substantiated
- Misleading
- Contradicted
What would move the verdict up
Amphora restating the period as 2018–2025 and the farmland share near 60%.
What would move it down
A larger imagery sample confirming less than half of the area.
IN THIS REPORT
1 The claim and what we could verify
Amphora Media published the investigation on 11 September 2026 [1] with a companion piece on agricultural land the next day [2], in collaboration with Arena for Journalism in Europe and supported by The Malta Environment Foundation. We read both in full. The change polygons behind the article’s interactive map are a public file on Amphora’s website [8]; we downloaded it on 5 October 2026.
| What was said | Where | Access |
|---|---|---|
| “nearly 830,000 square metres of nature and cropland have been built up in Malta between 2018 and 2023” (headline: “over 830,000”) | Amphora [1] | Read in full |
| Total land loss 0.26%, “among the top 5 countries”; “a conservative estimate” | Amphora [1] | Read in full |
| EEA: 920,000 m² (2012–2018) and 190,000 m² (2006–2012); “at least 1.94 square kilometres” since 2006 | Amphora [1] | Checked [7, 9] |
| “in nearly 95% of the take-up, farmland rather than natural area was affected” | Amphora [2] | Read in full |
| The map: 397 change polygons, each with its 2018 class (Dynamic World) and its status (“Built / developed”) | Amphora [8] | Downloaded |
2 Method
Questions. Does Amphora’s map add up to 830,000 m², does independent data confirm the land it flags, are the comparisons right, and was the land mostly farmland?
Evidence. Amphora’s method [1] uses Google and WRI’s Dynamic World [3], with each flagged area checked by eye. We measured its published polygons in UTM 33N [8]; the file has no stated licence, so we do not redistribute it and record its SHA-256 instead. For an independent check we used a different model, Impact Observatory and Esri’s 10 m annual land cover [4, 5]: 2017–2023 through Microsoft Planetary Computer and, new in version 1.2, 2024 and 2025 from Esri’s image service [10], whose 2017–2023 maps are identical to the first set pixel for pixel. We laid Amphora’s polygons over these maps (pixel centres, with a 20 m tolerance as a check). The EEA’s CORINE Land Cover change maps [9] test the EEA figures. Island areas are from OpenStreetMap. At the maintainer’s request we also checked a random sample of Amphora’s polygons against high-resolution satellite imagery in Esri’s World Imagery Wayback archive [11, 12] (section 4). Scripts and data: tools/cc-019-report/ and data/cc-019/.
Grades. Satellite land cover is a direct, model-classified measurement (grade B), and so is our visual check of a random sample of imagery; CORINE and the EEA chart are official statistics (grade C). ◆ marks a source known second-hand.
3 How the satellite data work
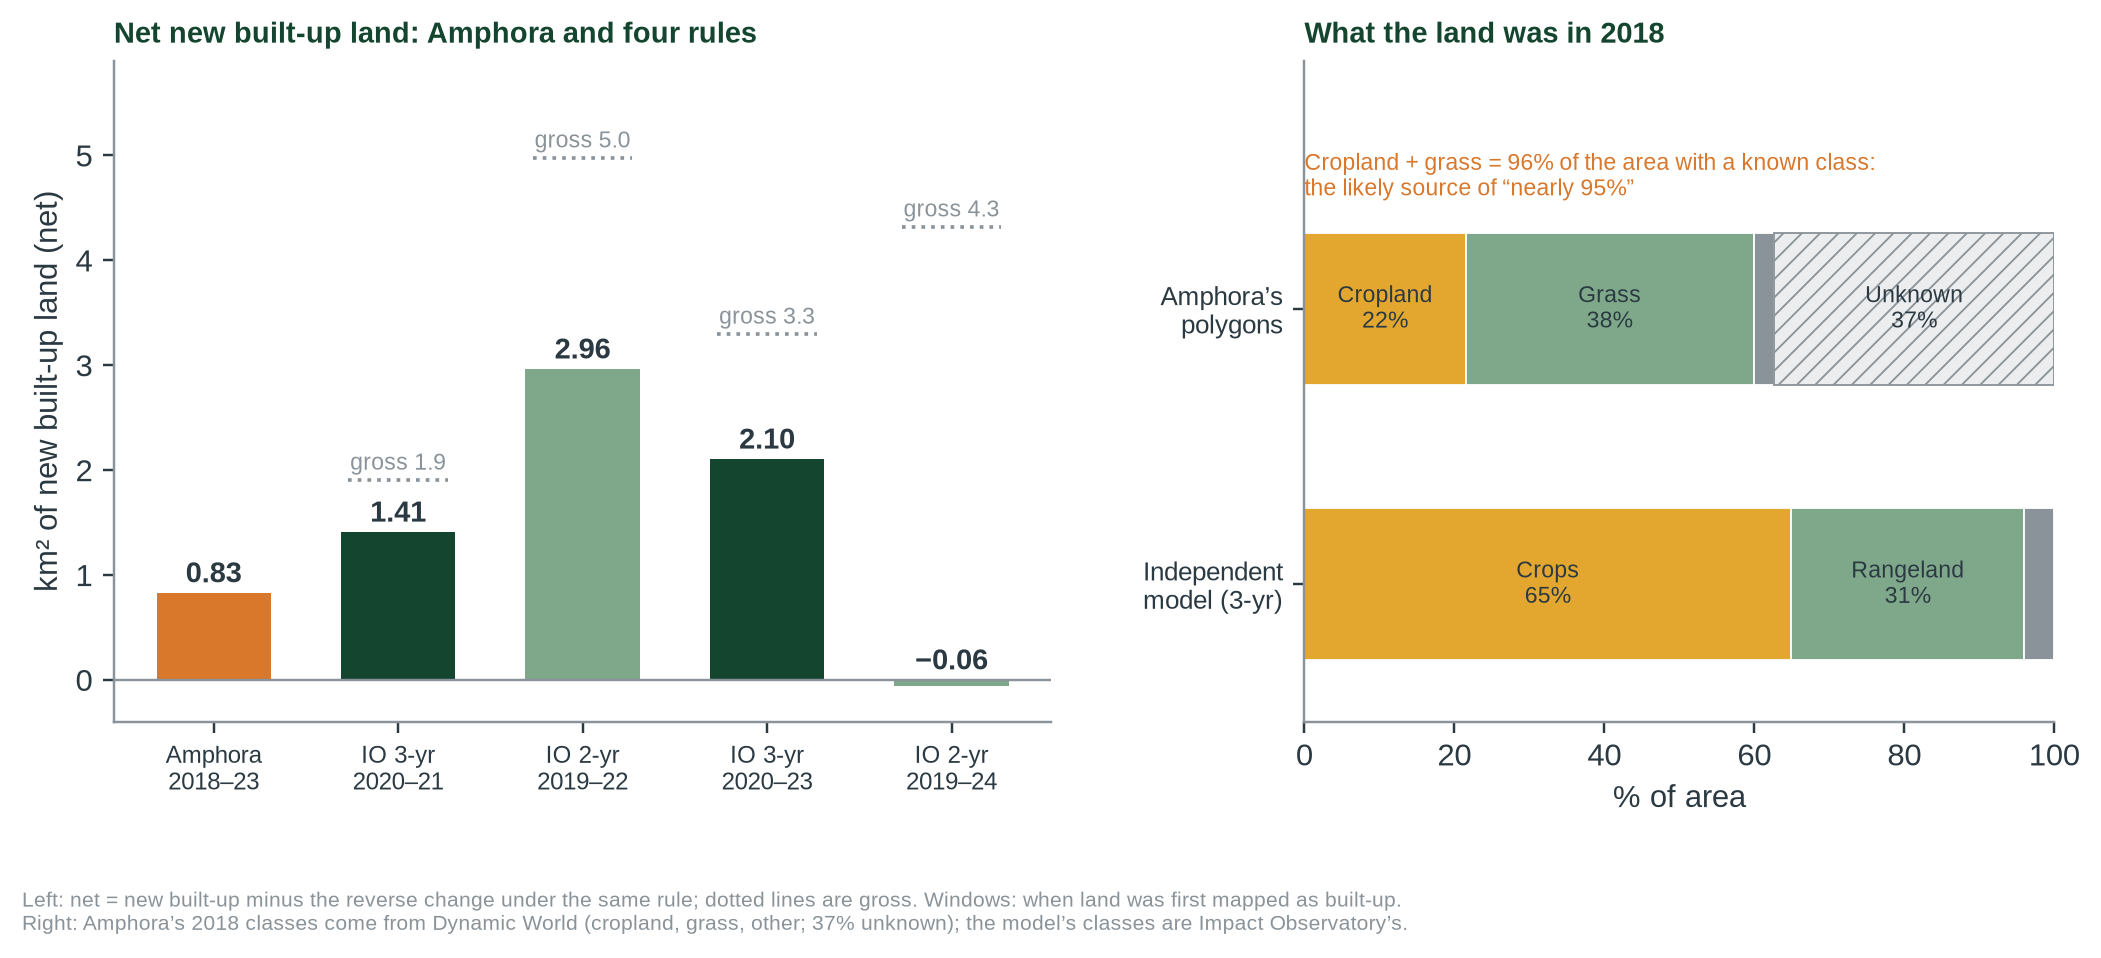
Both products classify every 10 m pixel with a deep-learning model trained on Sentinel-2 imagery [3, 4]. Single-year maps are noisy: in the Impact Observatory data Malta’s built-up area changes by 3 to 27 km² from one year to the next (−21 km² from 2023 to 2024, +23 km² from 2024 to 2025); the largest swing is over thirty times the 0.83 km² being measured. Comparing the 2018 and 2023 maps directly gives 24 km² of newly built-up pixels, or 18.9 km² net, which is not credible. We therefore counted only pixels that changed consistently: not built up in each of several early maps and built up in each of several later ones, and subtracted the reverse change as a gauge of noise. Each rule sees only land first mapped as built in a particular window: 2020–21 (3-year rule, maps 2017–19 against 2021–23), 2019–22 (2-year rule), and, with the 2024 and 2025 maps, 2020–23 and 2019–24. Amphora handled the same problem by checking each flagged area by eye, which removes false alarms but can miss developments, as it notes.
4 What the data show
| Check | Result | Amphora | Grade |
|---|---|---|---|
| Area of Amphora’s 397 polygons [8] | 828,429 m² | nearly (headline: over) 830,000 m² | – |
| 830,000 m² as a share of Malta’s land (314 km²) | 0.264% | 0.26% | C |
| In FIFA pitches; vs Comino; vs Manoel Island | 116; 0.24–0.30; 2.7 | 116; roughly a quarter; two | C |
| Cropland + grass, of the area with a known 2018 class [8] | 96% (95.3–95.7%) | nearly 95% farmland | – |
| Area with no 2018 class; polygons that were sea in 2018 [8] | 37%; 2 (4,429 m²) | – | – |
| Imagery: Amphora’s area confirmed green to grey, 40 draws [11] | 72.5% (57–84%) | – | B |
| Imagery: fields, share of the land before [11] | 59% (64% with orchards) | nearly 95% farmland | B |
| Amphora’s area already built-up in the 2018 map [5] | 68% (61% in all of 2017–19) | – | B |
| Amphora’s area the model maps as newly built [5] | 6–14% | – | B |
| Model’s new built-up land inside Amphora’s polygons [5] | 2–3% (5–7% within 20 m) | – | B |
| Model’s net new built-up, four rules [5, 10] | −0.06 to 2.96 km² | 0.83 km² | B |
| Model: new built-up was crops / rangeland / bare (3-year rule) | 65% / 31% / 4% | nearly 95% farmland | B |
| CORINE: new artificial land 2006–12 / 2012–18 [9] | 20.6 ha / 93.7 ha | 19 ha / 92 ha | C |
| EEA chart, land take 2012–18 [7] | 0.91–0.94 km²; highest of 39 | 0.92 km² | C |
| EEA 2006–12 + 2012–18 + Amphora 2018–23 | 1.94 km² | at least 1.94 km² | C |
All values in data/cc-019/checks.csv, amphora_classes.csv, amphora_io_overlap.csv and imagery_spotcheck_summary.csv. Comino: 0.30 of its 2.8 km² OpenStreetMap outline, 0.24 of the 3.5 km² often quoted. Amphora’s figures have no grade: they are the claim being tested.
Imagery spot-check of Amphora’s polygons
Method. We drew 40 points on Amphora’s 828,429 m² by systematic sampling with probability proportional to polygon area (random order and start, seed 20261005), so each draw stands for an equal slice of the area; they fell in 39 polygons. For each we laid the outline over Esri Wayback imagery [11] from before July 2018, 4 September 2018, 6 May 2023 and June to September 2025, dated from Esri’s metadata [12], and classed it by eye: confirmed if most of it was open or green before and built, paved, quarried, a yard or a construction site in 2025. The archive has no image of these spots from August 2016 to September 2018, so every “before” image dates from July 2015 to August 2016; where most of a polygon was already under construction, built or quarried by September 2018 we class it unclear. The imagery is not reproduced (Esri’s terms); the class and a note for every polygon are in data/cc-019/imagery_spotcheck.csv.
| Class (draws) | Share of Amphora’s area (95% interval) | What we saw |
|---|---|---|
| Confirmed (29) | 72.5% (57–84%) | Fields, scrub or garrigue before; buildings, roads, yards, quarry or works by 2025 |
| Partial (3) | 7.5% (3–20%) | Part already a yard or spoil before, or an unsealed boat yard after |
| Unclear (7) | 17.5% (9–32%) | 6 open in 2015–16 but mostly being developed by September 2018; 1 surface not visible |
| Already grey (1) | 2.5% (0–13%) | A graded development platform before 2016 |
| Still open (0) | 0% (0–9%) | None |
Result. 72.5% (57–84%) of the sampled area went from open or green land to built-up or grey; 76% if partial polygons count as half. Only one draw was already grey and none was still open. Counting only land that was mostly grey by May 2023, the article’s window, the share is 55% (40–69%): 17.5% of the area turned grey later, in line with the map file’s 2018–2025. Before the change, 59% (43–73%) of the sampled land was fields, cultivated or fallow, and 64% with orchards; the rest was scrub, garrigue or rough grass, often on vacant plots beside built-up land. Of the 15 sampled polygons Amphora classes as “grass”, 8 were fields and 7 scrub or garrigue.
What it means. More than half of the sampled area is confirmed, so by the maintainer’s rule, set before the check, confidence stays moderate. On what stood there before, the imagery sides with Amphora: the model maps 68% of this area as built-up in 2018, the imagery 2.5% (17.5% counting land being developed by September 2018). We did not check the model’s new built-up land outside Amphora’s polygons, so whether Amphora missed developments is untested. The farmland share is well below 95%, even at the top of its interval, unless scrub and rough grass are counted as farmland.
5 Where the evidence points different ways
Q1 Were 830,000 m² built over in 2018–2023?
BY 2025, NOT 2023EVIDENCE FOR THE CLAIM'S IMPRESSION
Amphora’s polygons add up to 828,429 m², and it says each area was checked by eye. In imagery, 72.5% of a random sample of that area (57–84%) went from open or green land to grey; only 2.5% was already grey. The model agrees that 88% of the area was built-up by 2023 and 92% by 2025.
EVIDENCE AGAINST
The model maps 68% of the area as built-up already in 2018, and only 2–3% of its own new built-up land lies inside Amphora’s polygons. In the imagery sample 15% of the area was already being developed by September 2018, and 17.5% turned grey only after May 2023.
Q2 Was 95% of it farmland?
OVERSTATEDEVIDENCE FOR THE CLAIM'S IMPRESSION
In Amphora’s own data, cropland and grass make up 96% of the area with a known 2018 class. Amphora may count grassland as farmland; it has not said. Abandoned fields can look like scrub from above.
EVIDENCE AGAINST
Dynamic World’s “grass” includes natural meadows and excludes plotted fields, which it calls crops [3]; 37% of the area has no 2018 class. In our imagery sample fields were 59% of the land before (43–73%), 64% with orchards; the rest was scrub, garrigue or rough grass.
Q3 Over or nearly 830,000?
HEADLINE ROUNDS UPEVIDENCE FOR THE CLAIM'S IMPRESSION
The text says “nearly”, and the polygons add up to 828,429 m².
EVIDENCE AGAINST
The headline says “over” 830,000.
6 Testing the claim
| Sub-claim | What the evidence shows | Rating |
|---|---|---|
| A. About 830,000 m² of green land built up 2018–2023 | Amphora’s polygons add up to 828,429 m² (two, 4,429 m², were sea in 2018). Imagery confirms green to grey for 72.5% of a random sample of the area (57–84%; about 600,000 m²), but only 55% by May 2023 (about 456,000 m²); 15% was being developed by September 2018. True for 2018–2025, not for the period stated. | PARTLY SUPPORTED |
| B. 0.26% of land; comparisons (pitches, Comino, Manoel) | Arithmetic checks out (Comino: 0.24 of the 3.5 km² often quoted, 0.30 of the OSM outline; Manoel: 2.7, not two). | SUPPORTED |
| C. Nearly 95% of take-up was farmland | Cropland + grass = 96% of the area with a known 2018 class (our reading of the basis), but only if all grass is farmland; 37% has no class. In imagery, fields were 59% of the sampled land (43–73%), 64% with orchards; 36% was scrub or garrigue. | NOT SUBSTANTIATED |
| D. EEA figures and the 1.94 km² total | CORINE change maps: 20.6 ha (2006–12) and 93.7 ha (2012–18) [9]; EEA chart 0.91–0.94 km² [7]; sum correct. | SUPPORTED |
7 Verdict and requests for evidence
Most of the land Amphora mapped was built over, but by 2025, not 2023, and about a third of it was scrub and garrigue, not farmland. Confidence: moderate.
Why. (1) The figure is the area of Amphora’s published polygons, and the arithmetic, comparisons and EEA figures are right. (2) Imagery of a random sample confirms green-to-grey change on 72.5% of the area (57–84%; about 600,000 m²) and finds almost none already built; the independent model’s contrary reading of 2018 does not hold on these parcels. (3) But the claim dates the change to 2018–2023, and only 55% of the area (40–69%; about 456,000 m², range 330,000–574,000) was grey by May 2023; 15% was already being developed by September 2018. That fits the map file’s 2018–2025. For the period stated, the figure is about 1.8 times too high. (4) The 95% farmland share is overstated: fields were 59% of the sampled land (43–73%), 64% with orchards, and 36% was scrub or garrigue. Two of the claim’s three numbers are stated more strongly than the evidence allows, which our scale calls Not substantiated: true for a longer period and on a broad reading of “farmland”, but not as worded. It is not Misleading: nothing material is left out; the numbers are overstated. Confidence is moderate: the classifications are ours, by eye, on 40 draws, and fallow fields can look like scrub.
Evidence we are asking for
- Amphora: the basis and period of the 95% farmland figure, and how “grass” was counted.
- Amphora: whether the polygons cover 2018–2023 or 2018–2025 (the map file says 2018–2025; in our sample 17.5% of the area turned grey after May 2023), and the 2018 class of the 162 polygons marked unknown.
- Anyone: imagery of Malta from 2017 to mid-2018, to date the 15% of the sampled area already being developed by September 2018; and a check for developments Amphora’s map missed.
8 Limitations
- Land-cover models misclassify pixels; our rules reduce but do not remove this.
- The imagery check is by eye, by us, on 40 draws in 39 polygons, so its 95% interval spans about ±13 points. The “before” images are from July 2015 to August 2016 and the next from 4 September 2018, so changes in between cannot be dated. Small polygons and unsealed yards are hard to judge, and fallow fields and scrub are hard to tell apart. The check does not look for developments Amphora missed.
- Amphora’s polygons are small (median 504 m², about five pixels); a 20 m tolerance raises the overlap only to 5–7%, so misalignment does not explain it.
- The persistence rules only see land first mapped as built in set windows (2019–24 at most), not exactly 2018–2023.
- Amphora’s map file gives its years as 2018–2025 and each polygon’s status as of 2025; the article says 2018–2023.
- CORINE maps only changes of 5 ha or more; every one of Amphora’s polygons (the largest is 3.3 ha) is below that.
- Built-up land includes roads, car parks and quarries as well as buildings; so does Amphora’s. Neither estimate says whether development was inside or outside the development zone.
- Class names differ between the two models; ‘rangeland’ in IO is not the same as ‘natural’.
References
- [1] Amphora Media (11 Sep 2026). Green To Grey: Malta lost over 830,000 square metres of land to development in five years. https://www.amphora.media/2026/09/green-to-grey-malta-land-loss-development-construction
- [2] Amphora Media (12 Sep 2026). Green to Grey: when development creeps up on agricultural land. https://www.amphora.media/2026/09/green-to-grey-development-agricutlural-land
- [3] Brown C.F. et al. (2022). Dynamic World, near real-time global 10 m land use land cover mapping. Scientific Data 9:251. doi:10.1038/s41597-022-01307-4. (Class definitions, Table 1, read.) https://doi.org/10.1038/s41597-022-01307-4
- [4] Karra K. et al. (2021). Global land use / land cover with Sentinel 2 and deep learning. IGARSS 2021, 4704–4707. doi:10.1109/IGARSS47720.2021.9553499. https://doi.org/10.1109/IGARSS47720.2021.9553499
- [5] Impact Observatory and Esri. 10 m Annual Land Use Land Cover (9-class) V2, 2017–2023; Microsoft Planetary Computer; retrieved 4 Oct 2026. https://planetarycomputer.microsoft.com/dataset/io-lulc-annual-v02
- [6] MiŻien. Data and calculations: data/cc-019/; tools/cc-019-report/.
- [7] European Environment Agency (2019, modified 2024). Country comparison: land take and land recultivation in EEA39 in the period 2012–2018 (in proportion of country area). Value read from the chart. https://www.eea.europa.eu/en/analysis/maps-and-charts/country-comparison-land-take-and
- [8] Amphora Media (2026). Green to Grey change polygons for Malta, malta-change.geojson (generated 30 Aug 2026; retrieved 5 Oct 2026; SHA-256 cf250ece…fcf320). Not redistributed. https://www.amphora.media/greentogrey/data/malta-change.geojson
- [9] European Environment Agency. CORINE Land Cover change layers 2006–2012 and 2012–2018 (CHA0612, CHA1218), discomap map service; queried 5 Oct 2026. https://image.discomap.eea.europa.eu/arcgis/rest/services/Corine
- [10] Impact Observatory, Microsoft and Esri. Sentinel-2 10m Land Cover time series, 2017–2025 (Esri Living Atlas image service); retrieved 5 Oct 2026. https://ic.imagery1.arcgis.com/arcgis/rest/services/Sentinel2_10m_LandCover/ImageServer
- [11] Esri. World Imagery Wayback, releases of 18 Jan 2018, 30 Oct 2019, 7 Mar 2024 and 26 Mar 2026 (imagery acquired Jul 2015–Aug 2016, 4 Sep 2018, 6 May 2023 and Jun–Sep 2025 by Maxar/Vantor satellites, 0.3–0.5 m); viewed 5 Oct 2026. Not reproduced. https://wayback.maptiles.arcgis.com/arcgis/rest/services/World_Imagery
- [12] Esri. World Imagery metadata layers for each Wayback release (acquisition date SRC_DATE, sensor, resolution); queried 5 Oct 2026. https://metadata.maptiles.arcgis.com/arcgis/rest/services
Appendix A: series standards and verdict scale
Every investigation in this series follows the same rules so that verdicts are comparable and challengeable.
| Verdict | Meaning |
|---|---|
| SUPPORTED | Evidence consistently backs the claim as stated. |
| LARGELY SUPPORTED | Backed by the evidence, with minor caveats that do not change the substance. |
| NOT SUBSTANTIATED | Stated more strongly than the evidence offered or available allows. May be true in some conditions but has not been shown. |
| MISLEADING | Omits material facts so that the overall impression is inaccurate, even if individual statements are defensible. |
| CONTRADICTED | The available evidence points against the claim. |
Confidence
High: multiple independent lines of evidence agree. Moderate: evidence is relevant but incomplete or indirect. Low: evidence is thin, second-hand or conflicting.
Evidence grades
A experiment · B observational study with a control or gradient, or direct measurement · C review, guidance or official statistics · D assertion or anecdote. ◆ marks a source known only second-hand.
Standards
- Quote the speaker, not the headline, with outlet and date, and link the original where possible.
- Separate the claim from the evidence offered for it, and say who made which statement.
- Grade the evidence and show differing views side by side where the evidence is unsettled.
- State what we could not access or verify, and what would change the verdict either way.
- Ask for the missing evidence in specific, answerable requests.
- Offer a right of reply where a check finds a claim Not substantiated, Misleading or Contradicted (or a pledge Not measurable, Off track or Missed), before wider circulation, and append responses.
- Correct errors openly with a version number and change log.
- Whistle-blow only on evidence: a verdict of Misleading or Contradicted requires documents or data that can be shown, not inference.
- Check every side. Government, opposition, NGOs and developers are held to the same standard.
Appendix B: revision log
| Version | Date | Change |
|---|---|---|
| 1.0 | 4 Oct 2026 | First issue. Right of reply to Amphora Media not yet sent. |
| 1.1 | 5 Oct 2026 | Corrections. (1) Periods of the independent estimates: “2018–2023” → land first mapped as built in 2020–21 (3-year rule) and 2019–22 (2-year rule), which is what the rules can detect (TL;DR, tile, sections 3, 4, 5 and 6, limitations, Figure 2 labels and caption). (2) Comino: “about 0.3 of Comino, as stated” → Amphora says “roughly a quarter”; 830,000 m² is 0.24 of the 3.5 km² often quoted and 0.30 of the 2.8 km² OpenStreetMap outline. (3) Simple comparison: “would give 24 km²” → 24 km² of newly built-up pixels, 18.9 km² net (now saved in data/cc-019/io_lulc_change.csv). (4) Year-to-year noise: “more than 15 km², twenty times the change” → 3 to 27 km², the largest over thirty times 0.83 km²; flyer “15 km² a year” → “up to 27 km² from year to year”. (5) The TL;DR now says the two estimates are not like for like. Verdict and confidence unchanged. |
| 1.2 | 5 Oct 2026 | Upgrade. (1) Amphora’s published change polygons [8] measured: 397 polygons, 828,429 m², so “nearly 830,000” is reproduced and the headline’s “over” is not. (2) Spatial cross-check with the independent model: “an independent measurement finds more, not less” and “plausible and conservative” → the model already maps 68% of Amphora’s area as built-up in 2018, 6–14% as new, and only 2–3% of its new built-up land lies inside Amphora’s polygons, so it neither confirms nor rules out the figure (TL;DR, tiles, sections 2–8, flyer). (3) The 2024 and 2025 maps added from Esri’s service (identical to the earlier maps for 2017–2023): net totals −0.06 to 2.96 km² by rule. (4) Sub-claim A “supported” → “plausible”; sub-claim C “not shown” → “needs context”: cropland + grass = 96% of the area with a known 2018 class (our reading of the basis of “nearly 95%”). (5) Sub-claim D: the 2006–2012 EEA figure checked with the CORINE change map (20.6 ha; 93.7 ha for 2012–2018). (6) New Figure 1 (Amphora’s polygons over the model’s new built-up land), replacing the map of new built-up pixels; Figure 2 redrawn with four rules and Amphora’s own 2018 classes. Verdict and confidence unchanged. |
| 1.2 | 5 Oct 2026 | Maintainer decision (5 Oct 2026): imagery spot-check of Amphora’s polygons, with confidence set by a rule fixed beforehand (moderate if more than half of the sampled area is confirmed, low otherwise). 40 draws by systematic sampling proportional to area (seed 20261005; 39 polygons) checked by eye against Esri World Imagery Wayback [11, 12] from 2015–16, 2018, 2023 and 2025: 72.5% of the sampled area confirmed green to grey (95% interval 57–84%), 7.5% partial, 2.5% already grey, 17.5% unclear (15% being developed by September 2018); 55% grey by May 2023; fields 59% of the land before (64% with orchards). Confidence: moderate. New subsection and table rows in section 4; TL;DR (key points, tiles, what would move the verdict), sections 2, 5 to 8 and the flyer updated; Q1 “plausible, unconfirmed” → “mostly confirmed”; Q2 “depends on definitions” → “overstated”; sub-claim A “plausible” → “largely supported”; sub-claim C “needs context” → “partly supported”. Verdict unchanged. |
| 1.2 | 5 Oct 2026 | Maintainer decision (5 Oct 2026): verdict changed from Largely supported to Not substantiated (moderate). Read as worded, the claim dates nearly 830,000 m² to 2018–2023; imagery puts about 456,000 m² (330,000–574,000) grey by May 2023 and about 600,000 m² by 2025. It says nearly 95% was farmland; fields were 59% (64% with orchards) and scrub or garrigue 36%. Sub-claim A “largely supported” → “partly supported”; C “partly supported” → “not substantiated”; Q1 retitled. TL;DR, tiles, what would move the verdict, verdict box, Why, flyer and claim.yml updated. A right of reply from Amphora Media is needed. |
Sources and archived copies
-
Green To Grey: Malta Lost Over 830,000 Square Metres Of Land To Development In Five Years, Amphora Media, Sep 2026.
Original · fetched and fingerprinted 2026-10-04; no public snapshot yet
Media claim; locate its data source and method. Read in full 4 Oct 2026 (print copy supplied by maintainer). -
Green to Grey: When Development Creeps Up On Agricultural Land, Amphora Media, Sep 2026.
Original · fetched and fingerprinted 2026-10-04; no public snapshot yet
Companion piece. Read in full 4 Oct 2026 (print copy supplied by maintainer). -
Green to Grey change polygons for Malta (malta-change.geojson), Amphora Media, 30 Aug 2026.
Original · fetched and fingerprinted 2026-10-10; no public snapshot yet
The data behind the map (397 polygons). Retrieved 5 Oct 2026, SHA-256 cf250ece689bec333d8e4852aaa9b53abf492ba971ad2e2a47d4fe9a04fcf320; licence not stated, so not committed (data/cc-019/amphora_record.csv).
Right of reply
The body concerned has not yet been asked to reply. Its response will be published here, beside the verdict.
Connections
How this claim relates to the others: who made it, the themes it shares with other claims, and the patterns it shows. A connection is a reason to read two checks side by side. It does not make either one right or wrong. How connections are found.
Who made it
Other claims by Amphora Media 1
Linked directly 13
Claims that share a theme with this one. A theme is a cause, a mechanism, a target or a way of presenting figures that the editors have found in several claims; its strength says how close the link is.
Sealed soil and concrete Shared mechanism · Strong
Excavation, concrete and sealed surfaces around trees. The EU review notes sealed or degraded soil keeps increasing in Malta.
Planning, housing and land take Shared driver · Strong
Permit volumes, enforcement and housing demand drive land take. Claims about prices, enforcement, reclamation and land loss rest on the same planning system and the same data (PA permits, NSO prices, land-cover maps).
- CC-013 Permits keep property prices in check (Largely supported)
- CC-014 Fewer enforcement notices, fewer illegalities (Misleading)
- CC-017 Land reclamation outside the Freeport (Not substantiated)
- CC-018 IMF 'confirms' MDA on housing (Largely supported)
- CC-058 96% of farmland in use (not yet checked)
- CC-123 KPMG: 8,716 residential units approved in 2024, up 7.4% (not yet checked)
Farmland and farming pressure Shared driver · Weak (indicative)
Claims about the land Malta farms and what presses on it: land lost (CC-019), farmland in use (CC-058), subsidies as a share of output (CC-059), the share farmed organically (CC-127) and the proposed commercial use of ODZ land (CC-130). Indicative until a report tests the figures against NSO, Eurostat and Planning Authority data.
Two steps away 15
Not linked to this claim directly, but linked to a claim that is. These are found by following the links, not chosen by the editors, so they are looser: they show where one theme meets another.
- CC-003 Per-capita emissions vs 2030 projection (Misleading)through Sealed soil and concreteCC-008Transport, air and climate
- CC-004 'Strong progress' in waste separation (Not substantiated)through Sealed soil and concreteCC-002Waste and construction or Sealed soil and concreteCC-008Waste and construction or Planning, housing and land takeCC-017Waste and construction
- CC-007 Within EU limits vs WHO guideline (Largely supported)through Sealed soil and concreteCC-008Transport, air and climate
- CC-010 Tree-planting counts (Largely supported)through Sealed soil and concreteCC-001Replanting as currency or Sealed soil and concreteCC-002Replanting as currency or Sealed soil and concreteCC-008Replanting as currency
- CC-016 Shore-to-ship: 90% less harbour pollution (Misleading)through Sealed soil and concreteCC-008Transport, air and climate
- CC-021 Malta-Gozo tunnel traffic (not yet checked)through Sealed soil and concreteCC-008Transport, air and climate
- CC-056 Central Link: 'only 254 trees' (not yet checked)through Sealed soil and concreteCC-008Replanting as currency
- CC-060 7,000 first-time buyers helped (not yet checked)through Planning, housing and land takeCC-013Planning, housing and land take
- CC-062 Construction is 9-14% of the economy (Largely supported)through Planning, housing and land takeCC-018Planning, housing and land take or Planning, housing and land takeCC-123Planning, housing and land take
- CC-063 Construction waste: 'standstill' warning (Not substantiated)through Planning, housing and land takeCC-017Waste and construction
- CC-069 82 million bus trips (not yet checked)through Sealed soil and concreteCC-008Transport, air and climate
- CC-072 EUR 15m to take cars off the road (not yet checked)through Sealed soil and concreteCC-008Transport, air and climate
- CC-076 36 more vehicles a day (Supported)through Sealed soil and concreteCC-008Transport, air and climate
- CC-109 EU: transport is 48% of effort-sharing emissions (Largely supported)through Sealed soil and concreteCC-008Transport, air and climate
- CC-115 Chamber: congestion cost EUR 770m, 3.4% of GDP (Not substantiated)through Sealed soil and concreteCC-008Transport, air and climate
Three steps away 18
One step further again. At this distance a connection says more about how the themes fit together than about this claim.
- CC-011 Ten minutes' walk to green space (pledge: Not measurable)through Sealed soil and concreteCC-008Transport, air and climateCC-0032030 carbon target
- CC-020 EP study: noise law not the cause (Largely supported)through Sealed soil and concreteCC-008Transport, air and climateCC-007Compliance-not-health pattern
- CC-025 Per-capita emissions down 44% since 2005 (Largely supported)through Sealed soil and concreteCC-008Transport, air and climateCC-0032030 carbon target
- CC-026 EU's largest rise in emissions (Largely supported)through Sealed soil and concreteCC-008Transport, air and climateCC-003Transport, air and climate
- CC-031 Gozo, first climate-neutral region (Largely supported)through Sealed soil and concreteCC-008Transport, air and climateCC-109Shared emissions figures
- CC-033 Delimara: 'much cleaner air' (not yet checked)through Sealed soil and concreteCC-008Transport, air and climateCC-007Compliance-not-health pattern
- CC-035 PM2.5 death rate down two-thirds (Largely supported)through Sealed soil and concreteCC-008Transport, air and climateCC-007Transport, air and climate
- CC-054 Project Green: 100,000 m2 a year (not yet checked)through Sealed soil and concreteCC-001Replanting as currencyCC-010Replanting as currency
- CC-057 1,649 compensation trees (not yet checked)through Sealed soil and concreteCC-001Replanting as currencyCC-010Replanting as currency
- CC-071 EUR 100m a year for free buses (Not substantiated)through Sealed soil and concreteCC-008Transport, air and climateCC-069Transport, air and climate
- CC-079 Waste-to-energy: 4.5% of energy (Misleading)through Sealed soil and concreteCC-002Waste and constructionCC-004Waste and construction
- CC-081 Landfill share rising (not yet checked)through Sealed soil and concreteCC-002Waste and constructionCC-004Waste and construction
- CC-082 35 quarries for construction waste (not yet checked)through Planning, housing and land takeCC-017Waste and constructionCC-063Waste and construction
- CC-094 Commission: Malta to emit more in 2030 than in 2005 (Supported)through Sealed soil and concreteCC-008Transport, air and climateCC-0032030 carbon target
- CC-110 EU: 37.7% of new cars zero-emission (Supported)through Sealed soil and concreteCC-008Transport, air and climateCC-007Selective-metric pattern
- CC-111 EU: 621 kg of waste a head, 74% landfilled (Supported)through Sealed soil and concreteCC-002Waste and constructionCC-004Waste and construction
- CC-114 PN: only EU state with rising emissions intensity (Misleading)through Sealed soil and concreteCC-008Transport, air and climateCC-003Selective-metric pattern
- CC-117 EU: Malta missed recycling targets (reasoned opinion) (not yet checked)through Sealed soil and concreteCC-002Waste and constructionCC-004Waste and construction
Similar wording
Claims whose own words overlap with this one, with the words they share. Found by comparing the wording of the claims, not their verdicts; a lead to read them together, not a finding.
- CC-054 Project Green: 100,000 m2 a year (not yet checked)shares: square, metres, green
- CC-121 Din l-Art Ħelwa: Excelsior extension harms the bastions (not yet checked)shares: square, metres, sep
Timeline
What was said, what was published before and after it, and each step of this check, in date order. Statements and sources carry the date they were published. The steps of the check carry the date the research was done, from the check's research log. Other statements by the same body on the same topic show whether a position was repeated, changed or corrected.
2020
- 2020 Evidence published CORINE Land Cover change 2006-2012 and 2012-2018 (CHA0612, CHA1218), European Environment Agency
2022
- 2022 Evidence published Dynamic World, Near real-time global 10 m land use land cover mapping, Scientific Data 9:251
2024
- 2024 Evidence published 10 m Annual Land Use Land Cover (9-class) V2, 2017-2023, Impact Observatory / Esri via Microsoft Planetary Computer
2026
- 2026 Evidence published Sentinel-2 10m Land Cover time series, 2017-2025, Impact Observatory / Microsoft / Esri (Living Atlas)
- 2026 Evidence published World Imagery Wayback release list (waybackconfig.json) and per-release imagery metadata layers (SRC_DATE), Esri
- 11 September 2026 The statement Amphora Media (this claim)
- September 2026 Evidence published Green To Grey: Malta Lost Over 830,000 Square Metres Of Land To Development In Five Years, Amphora Media
- September 2026 Evidence published Green to Grey: When Development Creeps Up On Agricultural Land, Amphora Media
- 3 October 2026 Added to the claims to check
- 4 October 2026 Version 1.0: first issue First issue. Right of reply to Amphora Media not yet sent.
- 5 October 2026 Version 1.2 Upgrade. (1) Amphora’s published change polygons [8] measured: 397 polygons, 828,429 m², so “nearly 830,000” is reproduced and the headline’s “over” is not. (2) Spatial cross-check with the independent model: “an independent measurement finds more, not less” and “plausible and conservative” → the model already maps 68% of Amphora’s area as built-up in 2018, 6–14% as new, and only 2–3% of its new built-up land lies inside Amphora’s polygons, so it neither confirms nor rules out the figure (TL;DR, tiles, sections 2–8, flyer). (3) The 2024 and 2025 maps added from Esri’s service (identical to the earlier maps for 2017–2023): net totals −0.06 to 2.96 km² by rule. (4) Sub-claim A “supported” → “plausible”; sub-claim C “not shown” → “needs context”: cropland + grass = 96% of the area with a known 2018 class (our reading of the basis of “nearly 95%”). (5) Sub-claim D: the 2006–2012 EEA figure checked with the CORINE change map (20.6 ha; 93.7 ha for 2012–2018). (6) New Figure 1 (Amphora’s polygons over the model’s new built-up land), replacing the map of new built-up pixels; Figure 2 redrawn with four rules and Amphora’s own 2018 classes. Verdict and confidence unchanged. Maintainer decision (5 Oct 2026): imagery spot-check of Amphora’s polygons, with confidence set by a rule fixed beforehand (moderate if more than half of the sampled area is confirmed, low otherwise). 40 draws by systematic sampling proportional to area (seed 20261005; 39 polygons) checked by eye against Esri World Imagery Wayback [11, 12] from 2015–16, 2018, 2023 and 2025: 72.5% of the sampled area confirmed green to grey (95% interval 57–84%), 7.5% partial, 2.5% already grey, 17.5% unclear (15% being developed by September 2018); 55% grey by May 2023; fields 59% of the land before (64% with orchards). Confidence: moderate. New subsection and table rows in section 4; TL;DR (key points, tiles, what would move the verdict), sections 2, 5 to 8 and the flyer updated; Q1 “plausible, unconfirmed” → “mostly confirmed”; Q2 “depends on definitions” → “overstated”; sub-claim A “plausible” → “largely supported”; sub-claim C “needs context” → “partly supported”. Verdict unchanged. Maintainer decision (5 Oct 2026): verdict changed from Largely supported to Not substantiated (moderate). Read as worded, the claim dates nearly 830,000 m² to 2018–2023; imagery puts about 456,000 m² (330,000–574,000) grey by May 2023 and about 600,000 m² by 2025. It says nearly 95% was farmland; fields were 59% (64% with orchards) and scrub or garrigue 36%. Sub-claim A “largely supported” → “partly supported”; C “partly supported” → “not substantiated”; Q1 retitled. TL;DR, tiles, what would move the verdict, verdict box, Why, flyer and claim.yml updated. A right of reply from Amphora Media is needed. Verdict in this version: Not substantiated, moderate confidence.
- 5 October 2026 Evidence reviewed
- 5 October 2026 Version 1.1: corrections Corrections. (1) Periods of the independent estimates: “2018–2023” → land first mapped as built in 2020–21 (3-year rule) and 2019–22 (2-year rule), which is what the rules can detect (TL;DR, tile, sections 3, 4, 5 and 6, limitations, Figure 2 labels and caption). (2) Comino: “about 0.3 of Comino, as stated” → Amphora says “roughly a quarter”; 830,000 m² is 0.24 of the 3.5 km² often quoted and 0.30 of the 2.8 km² OpenStreetMap outline. (3) Simple comparison: “would give 24 km²” → 24 km² of newly built-up pixels, 18.9 km² net (now saved in data/cc-019/io_lulc_change.csv). (4) Year-to-year noise: “more than 15 km², twenty times the change” → 3 to 27 km², the largest over thirty times 0.83 km²; flyer “15 km² a year” → “up to 27 km² from year to year”. (5) The TL;DR now says the two estimates are not like for like. Verdict and confidence unchanged. all corrections
2027
- 5 October 2027 Coming up: Evidence review due Each finished check is reviewed against new evidence within a year.
Every change to this claim's record is public: history of the record.
Download the report and flyer