CC-079 · Waste · Landfill & treatment
Waste-to-energy: 4.5% of energy
Misleading Moderate confidence Draft: right of reply pending
Parts of this claim
The claim is split into parts that are tested separately, as in the report below. Each part has its own number.
- CC-079A The plant will treat around 192,000 tonnes of non-recyclable waste generated locally a year (WasteServ [1])Matches the NECP design (24 t/h for 8,000 hours) and the Commission’s 190,000 t. Malta landfilled 255,000 t of municipal waste in 2024, but meeting the 2035 recycling target would leave at most 124,000 t.
- CC-079B It is expected to meet around 4.5% of Malta’s total energy needs (WasteServ [1, 2])126 GWh is 1.5% of final and 1.2% of primary energy consumption (2022), but 4.4–4.7% of electricity use. 3.2% of the NECP’s 2030 electricity supply.
- CC-079C The waste is converted into green energy (WasteServ [1, 2])Only the biodegradable fraction counts as renewable under EU law; the NECP says the plant is not expected to contribute to Malta’s renewable share.
- CC-079D The plant will generate 126 GWh a year to the grid (WasteServ [3])Consistent with the NECP’s 14–16 MW net (112–128 GWh) and a net efficiency of 23.6%, within the 20–24% reported for plants of this size.
- CC-079E The plant will treat 40% of the non-recyclable waste generated in Malta (WasteServ [3])With 192,000 t this implies 480,000 t of non-recyclable waste. 192,000 t is 67–75% of the waste Malta landfills and 32% of all non-mineral waste it generates; no basis is given.
Claim Check 079 · Energy and waste statistics
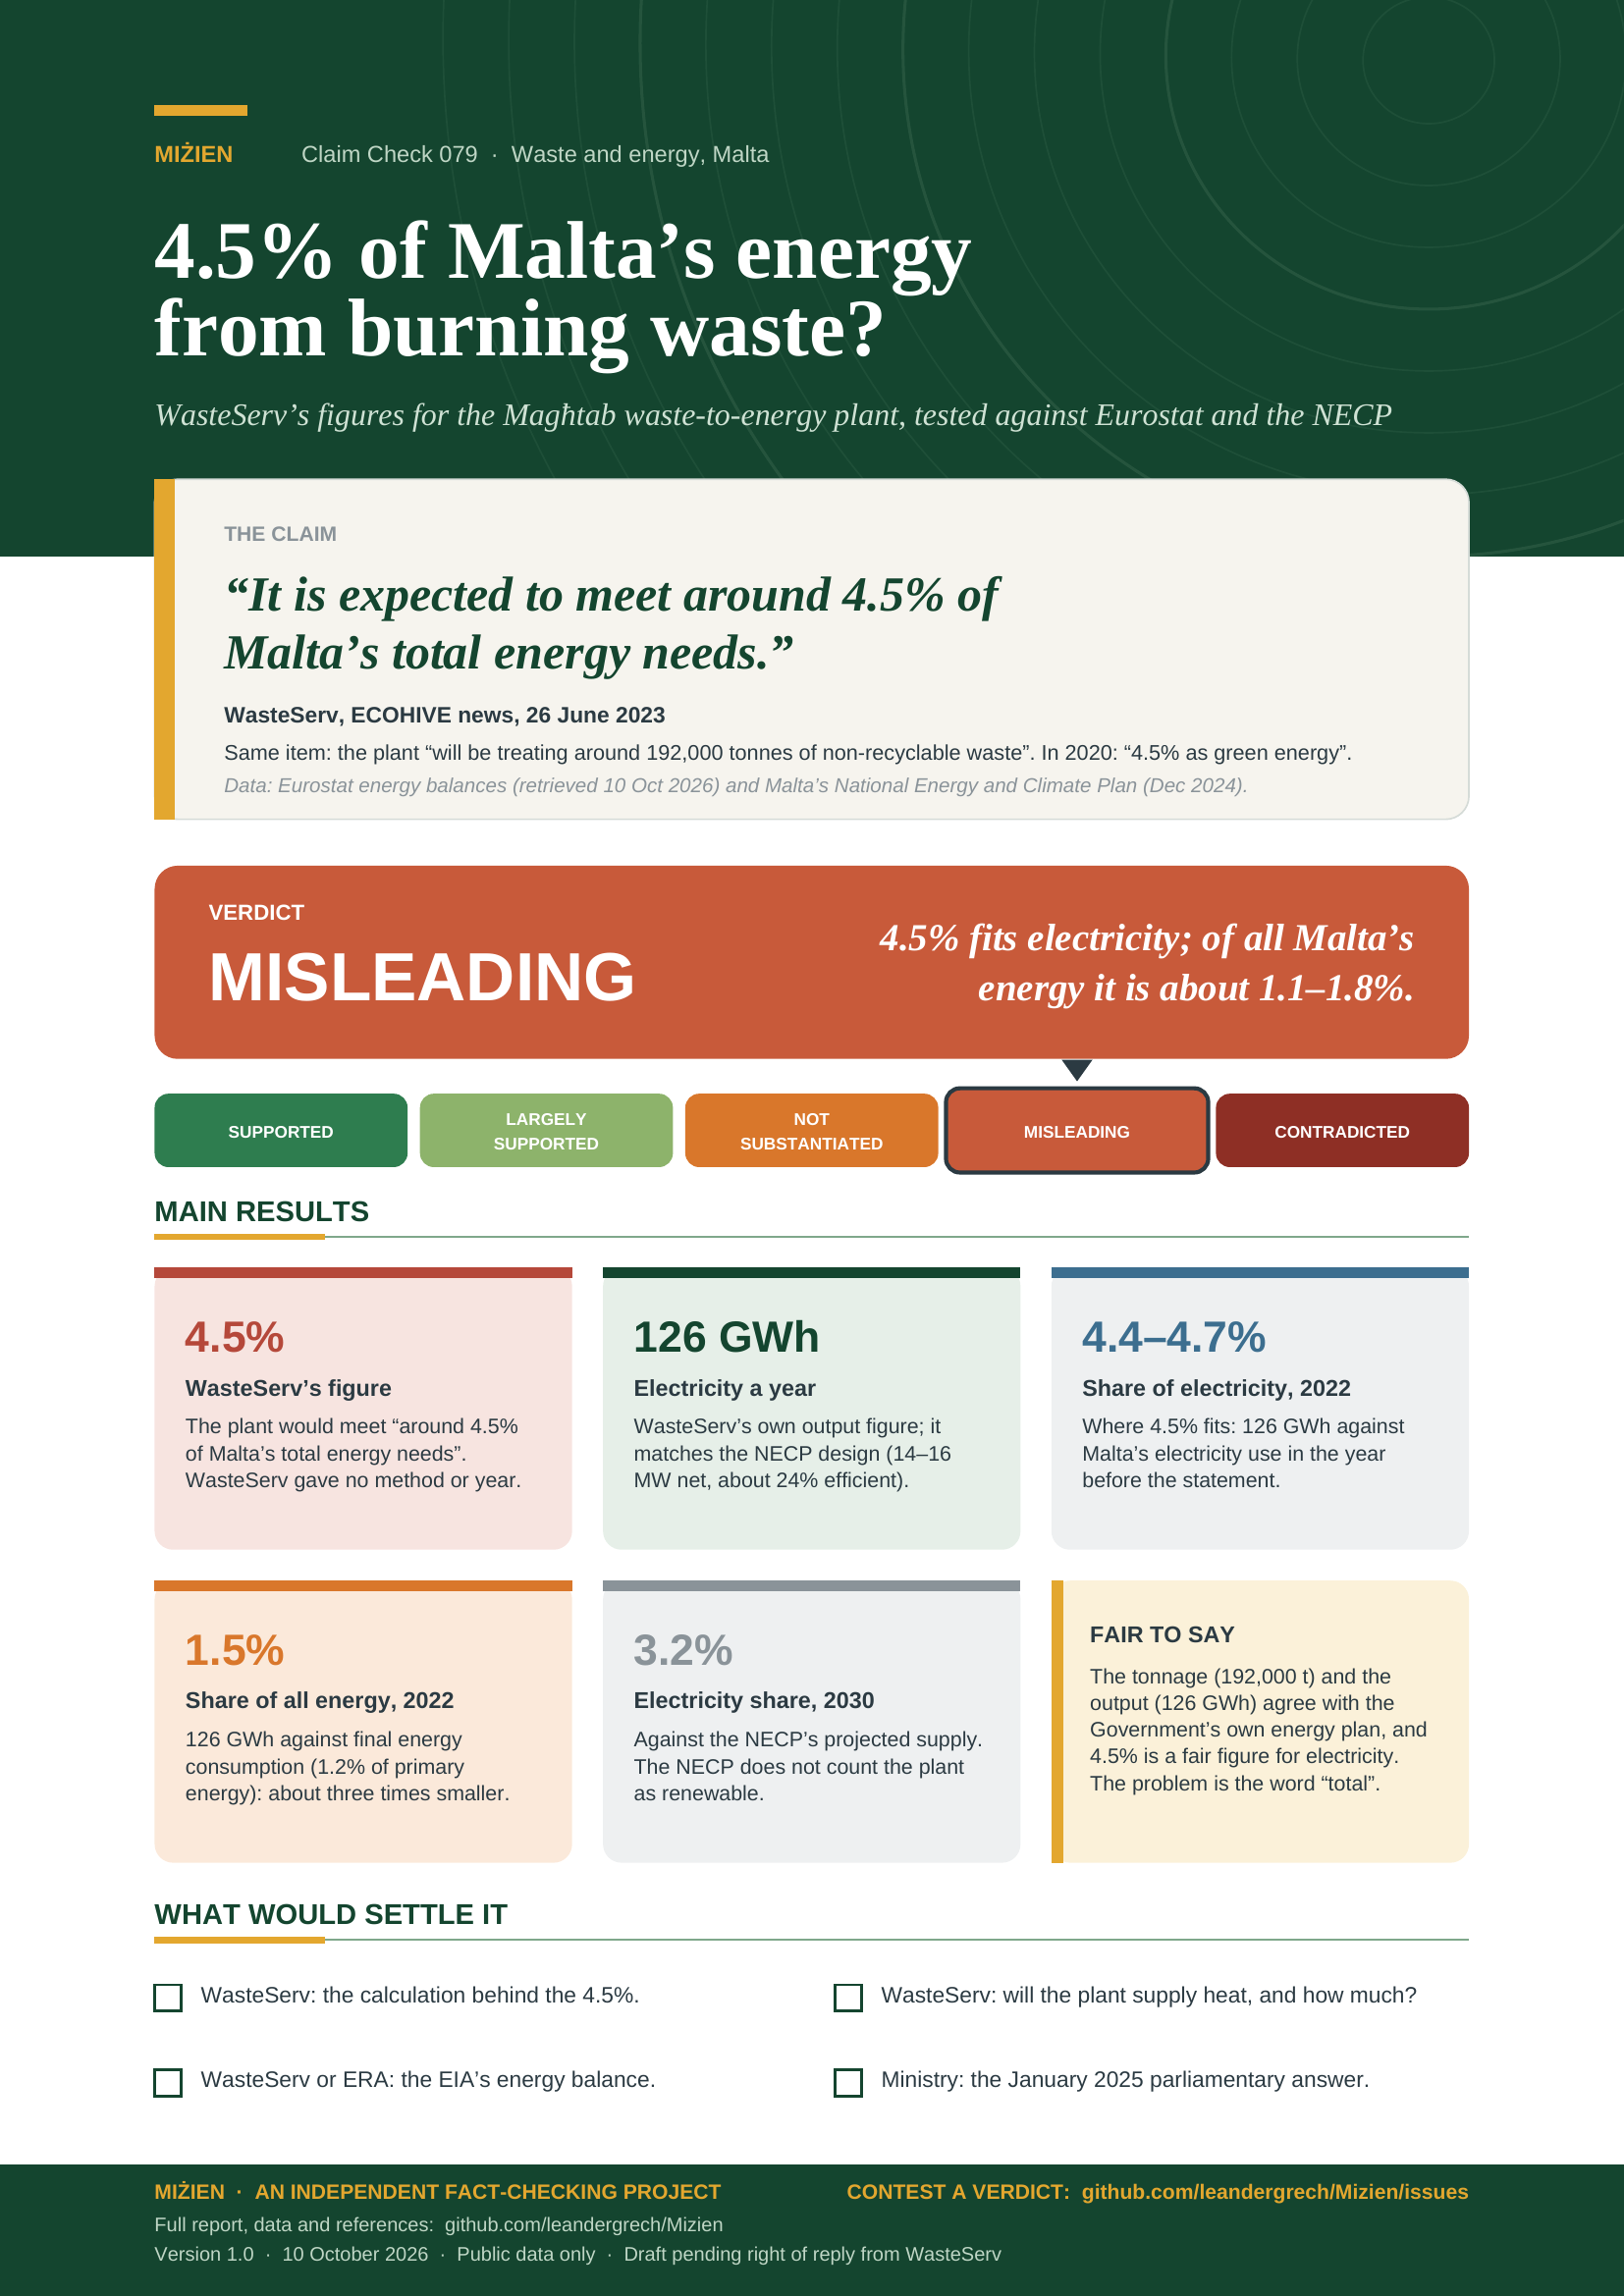
4.5% of Malta’s energy from burning waste?
Testing WasteServ’s figures for the Magħtab waste-to-energy plant against Eurostat and Malta’s energy plan
“This plant will be treating around 192,000 tonnes of non-recyclable waste … It is expected to meet around 4.5% of Malta’s total energy needs.”
WasteServ, ECOHIVE news, 26 June 2023.
In 2020: “adding an impressive 4.5% as green energy to Malta’s total energy demand”.
Verdict: Misleading 4.5% fits electricity; of total energy it is about 1.1–1.8%
Version 1.0 · 10 October 2026
TL;DR
In June 2023 WasteServ wrote that the waste-to-energy plant it plans at Magħtab “will be treating around 192,000 tonnes of non-recyclable waste generated locally” and “is expected to meet around 4.5% of Malta’s total energy needs”. It had used the same 4.5% in 2020, “as green energy”. We tested both figures against WasteServ’s own output figure, the plant design in Malta’s National Energy and Climate Plan (NECP) and Eurostat’s energy and waste statistics.
- The tonnage matches the design. 192,000 tonnes a year is two lines of 12 tonnes an hour running 8,000 hours, as in the NECP; the Commission cites 190,000 t. Malta landfilled 255,000 t of municipal waste in 2024, so there is enough residual waste today.
- The plant would make about 126 GWh of electricity a year. That is WasteServ’s own figure. The NECP’s 14–16 MW net and the efficiencies published for plants of this size (20–24%) agree with it.
- 4.5% fits electricity, not total energy. 126 GWh was 4.4–4.7% of Malta’s electricity use in 2022, but 1.5% of its final energy consumption and 1.2% of its primary energy. Electricity is only about a third of the final energy Malta uses.
- Only one other reading comes near 4.5%. The energy in the waste itself (about 533 GWh a year) is 5.0–5.2% of primary energy. But the plant would deliver under a quarter of it, as electricity; WasteServ names no user for the heat.
- “Green” needs a qualifier. EU law counts only the biodegradable part of waste as renewable, and the NECP says the plant “is not expected to contribute to Malta’s RES share”.
- Verdict: misleading (moderate confidence). A share of electricity is presented as a share of all energy, about three times too high. Even for electricity the share falls to 3.2% by 2030 on the NECP’s projection. WasteServ published no method.
- Supported
- Largely supported
- Not substantiated
- Misleading
- Contradicted
What would move the verdict up
WasteServ’s calculation showing which energy measure and year the 4.5% uses; or design documents (the EIA, the contract) showing the plant will also supply heat, enough to bring the energy it delivers near 4.5% of Malta’s total.
What would move it down
A design or contract output well below 126 GWh a year, which would leave the 4.5% without a basis even as a share of electricity.
IN THIS REPORT
1 The claim and what we could verify
ECOHIVE is WasteServ’s project for new waste plants at the Magħtab waste complex, among them a waste-to-energy facility, a material recovery facility, an organic processing plant, a skip management facility and a thermal treatment facility for hazardous waste [3]. The news item of 26 June 2023 on WasteServ’s ECOHIVE website reported a procurement milestone for the waste-to-energy plant and ended with the two sentences quoted on the cover [1]. WasteServ’s releases of 23 October and 2 November 2020 had given the 4.5% as “green energy” added to “Malta’s total energy demand” [2]. The undated project page gives the plant’s output, 126 GWh a year, and says it will treat 40% of Malta’s non-recyclable waste [3]. We read all of them in full on 10 October 2026.
The figures reached us through Amphora Media (June 2025), which reported in its own words that in a January 2025 parliamentary answer the Environment Minister said the plant would process 40% of non-recyclable waste and provide 4.5% of the country’s energy needs [4]. We could not read that answer (the parliament’s websites refuse automated access), so we rate WasteServ’s published wording only.
| Source | What it says | Our access | Status |
|---|---|---|---|
| WasteServ, ECOHIVE news, 26 Jun 2023 [1] | “This plant will be treating around 192,000 tonnes of non-recyclable waste generated locally … It is expected to meet around 4.5% of Malta’s total energy needs.” | Read in full, 10 Oct 2026. | The claim |
| WasteServ, releases of 23 Oct and 2 Nov 2020 [2] | “… adding an impressive 4.5% as green energy to Malta’s total energy demand.” | Read in full (also the Malta Business Weekly reprint). | Earlier wording |
| WasteServ, ECOHIVE project page, undated [3] | “the plant will generate 126GWh annually to the grid”; “40% of non-recyclable waste generated in Malta”; capacity 192,000 t; commissioning December 2026. | Read in full (English and Maltese). | Speaker’s own figures |
| Amphora Media, 6 Jun 2025 [4] | The Minister’s parliamentary answer, in the outlet’s words. | Read; the answer itself returned 403. | Locator; not rated |
| Government of Malta, NECP, Dec 2024 [5] | Plant design; 2030 projections; the plant and the renewable share. | Read the relevant sections. | Official plan |
| Eurostat [6, 7] | Energy balances, electricity and waste statistics for Malta. | Downloaded 10 Oct 2026 (data/cc-079/). | Primary data |
2 Method
Question. What could “4.5% of Malta’s total energy needs” mean, and do the plant’s expected output and Malta’s energy statistics support it on that reading? Are the tonnage and the other figures WasteServ gives for the plant consistent?
Readings. WasteServ gives no method, so we tested each plausible one. The numerator is the energy the plant delivers (126 GWh of electricity a year, WasteServ’s figure) or, as an upper bound that is not delivered, the energy content of the waste burnt. The denominator is Malta’s electricity (final consumption; inland demand) or its total energy: final energy consumption as reported for the Energy Efficiency Directive (which includes international aviation), final energy use without it, primary energy consumption, gross inland consumption and gross available energy (which also counts fuel sold to ships). Years: 2019 and 2022, the last years before the 2020 and 2023 statements, 2024 (latest) and the NECP’s 2030 projection.
Evidence. Eurostat datasets nrg_bal_c, nrg_cb_e, env_wasmun, env_wastrt and env_wasgen, downloaded with a script on 10 October 2026 (tools/cc-079-report/fetch.py); the NECP’s design figures and projections; peer-reviewed studies of electrical efficiency and of the biogenic share of burnt waste (abstracts only); EU law. Every figure is recomputed in calc.py (outputs in data/cc-079/checks.csv). Grades and the verdict scale are in Appendix A.
3 How the plant would make energy
In a moving-grate plant, mixed waste burns on a sloping grate; the hot gases raise steam in a boiler and the steam drives a turbine. Only part of the waste’s energy becomes electricity. A review of thermal treatment puts the net electric efficiency of small and medium plants that make only electricity at around 20–24%, and up to 30–31% for the largest [9]; the rest leaves as heat. Selling heat as well (co-generation) is the main way to recover more [9], and differences between European plants relate mainly to their size and to whether a heat market exists [10].
The NECP describes the Magħtab design: two moving-grate lines on one turbine, each taking 12 tonnes an hour, with a net electricity generation of 14–16 MW and a heat input to the boiler “between 20MWth and 33.33MWth” [5, p. 132]. 192,000 tonnes a year at 24 tonnes an hour is 8,000 full-load hours, 91% of the year. Reading 33.33 MWth as the heat input of each line, the design calorific value is 10.0 GJ a tonne and the waste’s energy content 533 GWh a year; 126 GWh is then a net efficiency of 23.6%, inside the range for plants of this size. Read as the total for both lines, 33.33 MWth would imply 42–48%, well above the 30–31% the review gives for the largest plants [9], so we reject that reading.
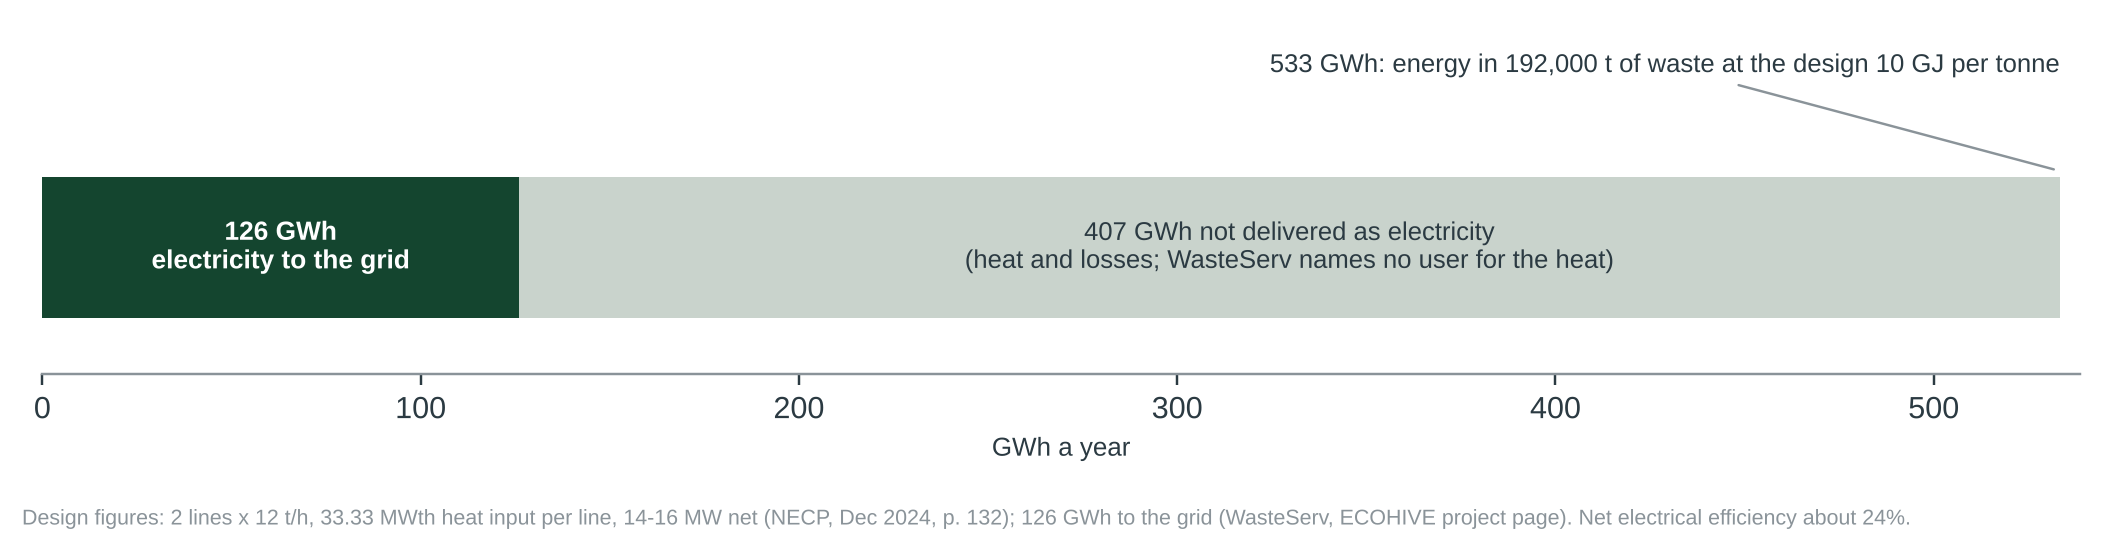
4 What the studies and data show
Against Malta’s electricity, 126 GWh a year is close to WasteServ’s 4.5%: 4.4–4.7% in 2022, the year before the June 2023 statement. Against Malta’s total energy it is 1.1–1.8% (Figure 2, Table 1), and less if fuel sold to ships is counted. Total energy also covers transport fuels, among them aviation fuel [6], and electricity is about a third of the final energy Malta uses (33% in 2022 and 2024). 126 GWh would be exactly 4.5% of 2,800 GWh (241 ktoe); Malta’s gross inland consumption in 2024 was 964 ktoe.
| Evidence | Finding | Source | Grade |
|---|---|---|---|
| Electrical efficiency of waste incineration | Net 20–24% for small-medium plants making only electricity; up to 30–31% for large plants. | Lombardi et al. 2015, review [9] | C |
| Why plants differ | Mainly plant size and whether a heat market (district heating) exists. | Grosso et al. 2010 [10] | B |
| Biogenic share of burnt mixed waste | CO2 slightly above 50% biogenic at three Swiss plants; fossil share 43–55% (mean 48%) at five plants over a year. | Mohn et al. 2008, 2012 [11, 12] | B |
| Plant design | 2 lines × 12 t/h; 14–16 MW net; 20–33.33 MWth heat input. | NECP, p. 132 [5] | C |
| Plant output | 126 GWh a year to the grid (no calculation given). | WasteServ [3] | D |
| Malta’s electricity, 2022 | Final consumption 2,698 GWh; inland demand 2,880 GWh (2024: 2,868 and 3,106 GWh). | Eurostat nrg_cb_e [6] | C |
| Malta’s total energy, 2022 | Final energy consumption 8,136 GWh (700 ktoe); primary energy consumption 10,318 GWh (887 ktoe), as in the NECP’s Table 27. | Eurostat nrg_bal_c [6]; NECP [5] | C |
| Projections for 2030 | Electricity supply 3,951 GWh (all sources in Figure 120); primary energy 964 ktoe; final energy 803 ktoe. | NECP, pp. 94, 344 [5] | C |
| Malta’s municipal waste, 2024 | 354,000 t generated, 255,000 t landfilled, 8,000 t burnt with energy recovery. | Eurostat env_wasmun [7] | C |
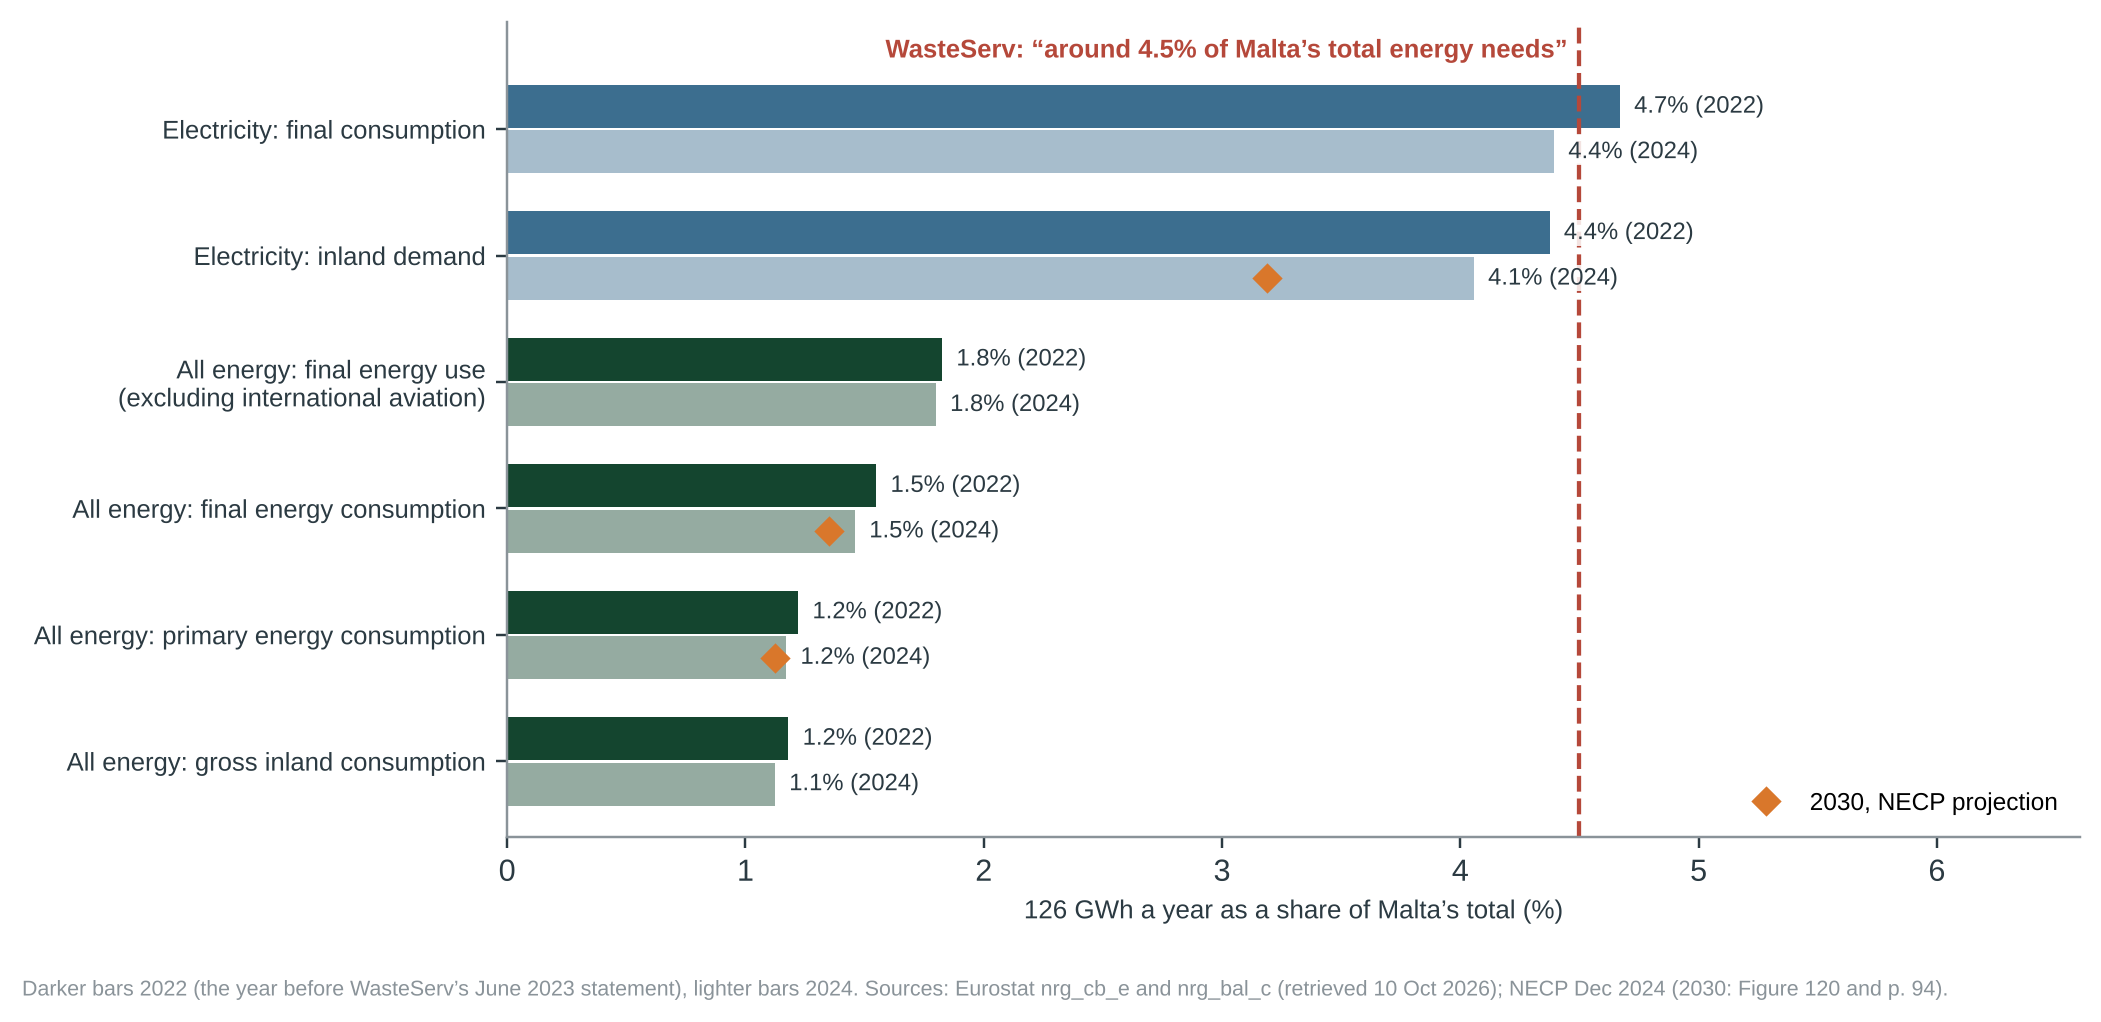
Table 1. The plant’s 126 GWh a year as a share of Malta’s totals
| 126 GWh compared with | 2019 | 2022 | 2024 | 2030 (NECP) |
|---|---|---|---|---|
| Electricity: final consumption | 5.1% | 4.7% | 4.4% | – |
| Electricity: inland demand (2030: all supply) | 4.8% | 4.4% | 4.1% | 3.2% |
| Final energy consumption (with international aviation) | 1.6% | 1.5% | 1.5% | 1.3% |
| Final energy use (without international aviation) | 2.0% | 1.8% | 1.8% | – |
| Primary energy consumption | 1.2% | 1.2% | 1.2% | 1.1% |
| Gross inland consumption | 1.2% | 1.2% | 1.1% | – |
| Gross available energy (with fuel sold to ships) | 0.3% | 0.4% | 0.4% | – |
| Upper bound: energy in the waste (533 GWh) vs primary energy consumption | 5.3% | 5.2% | 5.0% | 4.8% |
Eurostat nrg_cb_e and nrg_bal_c (retrieved 10 Oct 2026); NECP Dec 2024, p. 94 and Figure 120. The last row is not energy the plant delivers: it counts all the energy in the waste.
5 Where the evidence points different ways
What is the 4.5% a share of?
ELECTRICITY, NOT ALL ENERGYEVIDENCE FOR A 4.5% FIGURE
126 GWh is 4.4–4.7% of Malta’s electricity use in 2022 and 4.8–5.1% in 2019, so 4.5% is a fair figure for electricity at the time of both statements. Counting all the energy in the waste (533 GWh), the share of primary energy consumption is 5.0–5.2% (2022–2024).
EVIDENCE AGAINST “TOTAL ENERGY”
WasteServ wrote “total energy needs” and “total energy demand”. Against Malta’s total energy, 126 GWh is 1.1–1.8% (2022–2024), and less if fuel sold to ships is counted. The energy-content reading counts the three-quarters of the waste’s energy that the plant would not deliver; WasteServ names no user for its heat.
Is it “green energy”?
PARTLYFOR
EU law counts the biodegradable fraction of municipal waste as biomass, a renewable source [14]. Radiocarbon measurements at Swiss plants found about half the carbon in burnt mixed waste to be biogenic [11, 12]. The NECP expects the waste sector to lead future cuts in Malta’s methane emissions, mainly because waste would go to the plant instead of landfill [5, p. 60].
AGAINST
Only the biodegradable part counts; the rest, mainly plastics, is fossil. Malta’s own plan shows only solar PV and biogas in its renewable-electricity trajectory and says the new thermal treatment plant “is not expected to contribute to Malta’s RES share” [5, pp. 84, 144].
Will there be 192,000 tonnes of non-recyclable waste to burn?
TODAY YES; AT 2035 TARGETS, NOENOUGH WASTE NOW
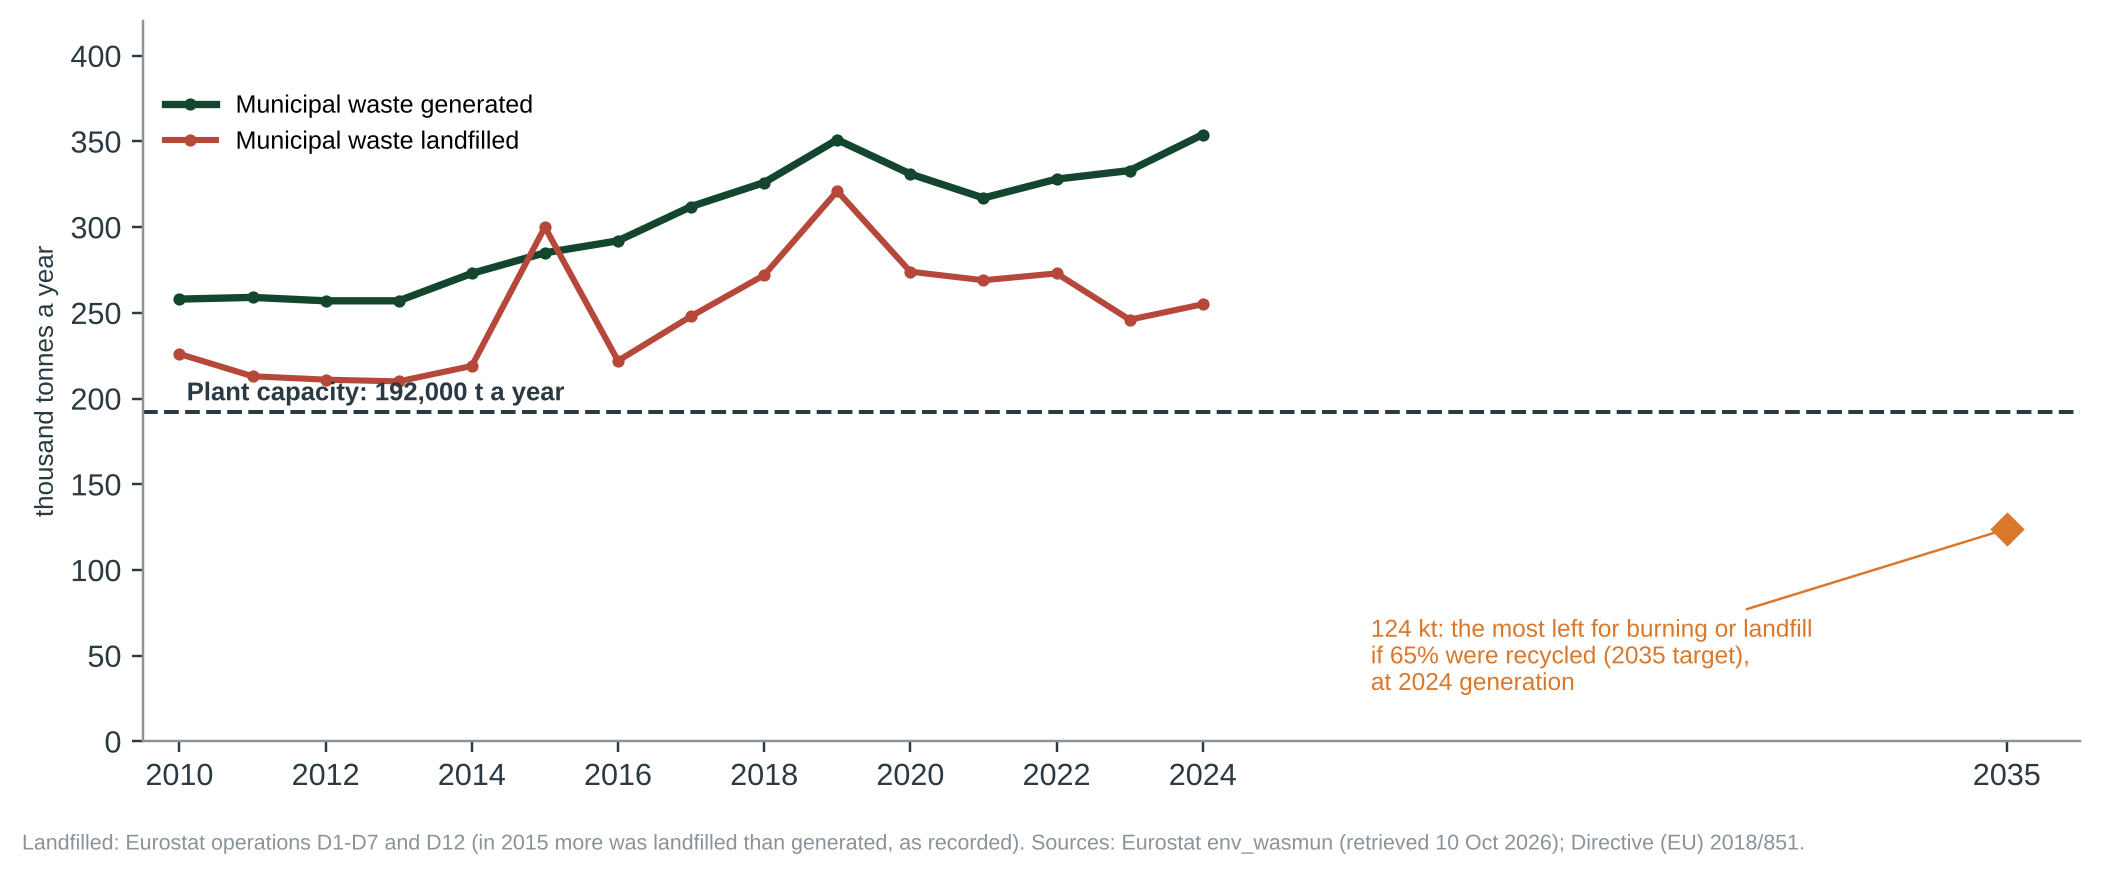
Malta landfilled 255,000 t of municipal waste in 2024 and 286,500 t of non-mineral waste of all kinds in 2022 [7]; 192,000 t is 75% and 67% of these. Only 1.3% of municipal waste was incinerated in 2022 [8].
IF RECYCLING TARGETS ARE MET
Malta has kept the EU target of recycling 65% of municipal waste by 2035, renouncing a postponement in November 2024 [8, 15]. At the 2024 level of waste, meeting it would leave at most 124,000 t for burning or landfill, 68,000 t less than the plant’s capacity; waste would have to grow by 55% for 35% of it to fill the plant. The NECP plans to pre-sort mixed waste to take out recyclables before it reaches the plant [5, p. 132].
6 Testing the claim
WasteServ’s two sentences of 26 June 2023 are sub-claims A and B; its 2020 wording adds C; the project page supplies D, the output on which every reading of the 4.5% depends, and E. WasteServ gave no reasoning for the 4.5% that we could check.
| Sub-claim | Said by | What the evidence shows | Rating |
|---|---|---|---|
| A. The plant will treat around 192,000 tonnes of non-recyclable waste generated locally a year | WasteServ [1] | Matches the NECP design (24 t/h for 8,000 hours) and the Commission’s 190,000 t. Malta landfilled 255,000 t of municipal waste in 2024, but meeting the 2035 recycling target would leave at most 124,000 t. | CONSISTENT |
| B. It is expected to meet around 4.5% of Malta’s total energy needs | WasteServ [1, 2] | 126 GWh is 1.5% of final and 1.2% of primary energy consumption (2022), but 4.4–4.7% of electricity use. 3.2% of the NECP’s 2030 electricity supply. | MISLEADING |
| C. The waste is converted into green energy | WasteServ [1, 2] | Only the biodegradable fraction counts as renewable under EU law; the NECP says the plant is not expected to contribute to Malta’s renewable share. | PARTLY |
| D. The plant will generate 126 GWh a year to the grid | WasteServ [3] | Consistent with the NECP’s 14–16 MW net (112–128 GWh) and a net efficiency of 23.6%, within the 20–24% reported for plants of this size. | PLAUSIBLE |
| E. The plant will treat 40% of the non-recyclable waste generated in Malta | WasteServ [3] | With 192,000 t this implies 480,000 t of non-recyclable waste. 192,000 t is 67–75% of the waste Malta landfills and 32% of all non-mineral waste it generates; no basis is given. | UNCLEAR BASIS |
7 Verdict and requests for evidence
The 4.5% fits the plant’s expected electricity as a share of Malta’s electricity, not of its total energy needs, where it is about 1.1–1.8%. Confidence: moderate.
Why. The tonnage and the output WasteServ gives are consistent with the plant design in the Government’s own energy plan. The share is not: “total energy needs” and “total energy demand” name all of Malta’s energy, of which the plant’s 126 GWh would be about 1.1% (gross inland consumption, 2024) to 1.8% (final energy use without aviation). The figure of 4.5% matches the plant’s output as a share of Malta’s electricity in the years before the statements, or the whole energy content of the waste, most of which the plant would not deliver. Either way the overall impression, that burning Malta’s residual waste would meet 4.5% of all the country’s energy needs, is inaccurate. The “green energy” label adds to it: the NECP does not count the plant towards Malta’s renewable share.
Why moderate confidence. WasteServ published no method, the plant’s final design is not settled, and we could not read its EIA. A plant that also delivered most of its heat would supply more energy than the electricity alone; no heat user is described in any source we read.
What this verdict does not say. It does not judge whether Malta should build a waste-to-energy plant, the procurement or the plant’s emissions. The tonnage and the electricity output are consistent with the design.
Evidence we are asking for
- From WasteServ: the calculation behind the 4.5%: which energy measure, which year and which output figure.
- From WasteServ: whether the plant will supply heat, to whom and how much, and its expected net electricity in the current design.
- From WasteServ or ERA: the Environmental Impact Assessment’s design calorific value, feedstock list and energy balance (we found no readable copy).
- From the Ministry for the Environment, Energy and Public Cleanliness: the text of the January 2025 parliamentary answer reported by Amphora Media.
- From the Energy and Water Agency: whether any of the plant’s output will count towards Malta’s renewable share, given the NECP’s statement that it is not expected to.
8 Limitations
- WasteServ published no method for the 4.5%. We tested every reading we could think of; there may be another.
- The design may change. The figures are from the NECP (December 2024) and WasteServ’s pages; the latest procurement was abandoned, as The Shift News reported [13] from a parliamentary answer we did not read.
- We could not read the plant’s EIA; its calorific value, heat use and net output are taken from the NECP. The heat-input figure does not say whether it is per line; we tested both readings.
- The NECP’s Figure 120 (2030 electricity by source) has a legend whose colours do not clearly match its slices; we used only the total of the slices as a denominator.
- The journal studies were read as abstracts. The Swiss biogenic shares are context, not measurements of Malta’s waste. No peer-reviewed study of this plant was found in Crossref; an OpenAlex search was refused (rate limit).
- Eurostat revises energy balances; the 2024 values are the latest published on 10 October 2026.
- Amphora’s account of the Minister’s parliamentary answer is the outlet’s paraphrase and is not rated.
References
- [1] WasteServ (26 June 2023). Malta’s Waste-to-Energy Project Procurement Reaches its Final Stage. ECOHIVE news. Read 10 Oct 2026. https://www.ecohive.com.mt/en/article?id=872332ec-b93b-4e6d-8746-732b1c175bb5
- [2] WasteServ (23 October 2020). Three world leading giants shortlisted to design, build & operate the ECOHIVE Waste to Energy Plant; and (2 November 2020) Waste to Energy Procurement Process to Move to Next Stage. ECOHIVE news; the first reprinted by The Malta Business Weekly, 23 Oct 2020. https://www.ecohive.com.mt/en/article?id=b688333c-9004-403c-8643-cb92837b7143
- [3] WasteServ. ECOHIVE: The Project, Waste-to-Energy Facility (undated web page, English and Maltese). Read 10 Oct 2026. https://www.ecohive.com.mt/
- [4] Repečkaitė, D. (6 June 2025). Analysis: Is Burning Waste At Magħtab The Only Way Out Of Malta’s Waste Crisis? Amphora Media. Locator only. https://www.amphora.media/2025/06/waste-energy-maghtab-recycling-sustainable
- [5] Government of Malta (December 2024). Malta’s National Energy and Climate Plan (updated), 2021–2030. Pp. 60, 84, 94, 132, 144, 286 (Table 27), 344 (Figure 120); printed page numbers. https://clean-energy-islands.ec.europa.eu/system/files/2025-03/MT%20FINAL%20UPDATED%20NECP%202021-%202030%20%28English%29.pdf
- [6] Eurostat. Complete energy balances (nrg_bal_c, updated 27 Aug 2026); Supply, transformation and consumption of electricity (nrg_cb_e, updated 9 Oct 2026). Retrieved 10 Oct 2026. https://ec.europa.eu/eurostat/databrowser/view/nrg_bal_c/default/table
- [7] Eurostat. Municipal waste by waste management operations (env_wasmun, updated 30 Mar 2026); Treatment of waste (env_wastrt) and Generation of waste (env_wasgen), updated Sep 2025. Retrieved 10 Oct 2026. https://ec.europa.eu/eurostat/databrowser/view/env_wasmun/default/table
- [8] European Commission (2025). 2025 Environmental Implementation Review: Malta. SWD(2025) 318 final, pp. 8–9. http://publications.europa.eu/resource/celex/52025SC0318
- [9] Lombardi, L., Carnevale, E. and Corti, A. (2015). A review of technologies and performances of thermal treatment systems for energy recovery from waste. Waste Management 37, 26–44. Abstract read. https://doi.org/10.1016/j.wasman.2014.11.010
- [10] Grosso, M., Motta, A. and Rigamonti, L. (2010). Efficiency of energy recovery from waste incineration, in the light of the new Waste Framework Directive. Waste Management 30(7), 1238–1243. Abstract read. https://doi.org/10.1016/j.wasman.2010.02.036
- [11] Mohn, J., Szidat, S., Fellner, J. et al. (2008). Determination of biogenic and fossil CO2 emitted by waste incineration based on 14CO2 and mass balances. Bioresource Technology 99(14), 6471–6479. Abstract read. https://doi.org/10.1016/j.biortech.2007.11.042
- [12] Mohn, J., Szidat, S., Zeyer, K. and Emmenegger, L. (2012). Fossil and biogenic CO2 from waste incineration based on a yearlong radiocarbon study. Waste Management 32(8), 1516–1520. Abstract read. https://doi.org/10.1016/j.wasman.2012.04.002
- [13] The Shift News (3 March 2026). No funds for Magħtab waste-to-energy plant project promised in 2017. Context only. https://theshiftnews.com/2026/03/03/no-funds-for-maghtab-waste-to-energy-plant-project-promised-in-2017/
- [14] Directive (EU) 2018/2001 on the promotion of the use of energy from renewable sources (recast), Art. 2(1) and 2(24). http://publications.europa.eu/resource/celex/32018L2001
- [15] Directive (EU) 2018/851 amending Directive 2008/98/EC on waste, Art. 11(2)(e) as amended; Directive (EU) 2018/850 amending Directive 1999/31/EC on landfill, Art. 5(5) as amended. http://publications.europa.eu/resource/celex/32018L0851
- [16] Miżien. Calculation scripts and outputs: tools/cc-079-report/calc.py; data/cc-079/checks.csv. Related checks: CC-004 (recycling), CC-111 (landfill), CC-080 (organic plant).
Appendix A: series standards and verdict scale
Every investigation in this series follows the same rules so that verdicts are comparable and challengeable.
| Verdict | Meaning |
|---|---|
| SUPPORTED | Evidence consistently backs the claim as stated. |
| LARGELY SUPPORTED | Backed by the evidence, with minor caveats that do not change the substance. |
| NOT SUBSTANTIATED | Stated more strongly than the evidence offered or available allows. May be true in some conditions but has not been shown. |
| MISLEADING | Omits material facts so that the overall impression is inaccurate, even if individual statements are defensible. |
| CONTRADICTED | The available evidence points against the claim. |
Confidence
High: multiple independent lines of evidence agree. Moderate: evidence is relevant but incomplete or indirect. Low: evidence is thin, second-hand or conflicting.
Evidence grades
A experiment · B observational study with a control or gradient · C review, guidance or official statistics · D assertion or anecdote. ◆ marks a source known only second-hand. A speaker’s figure given without data or method (here WasteServ’s 126 GWh and 4.5%) is graded D.
Standards
- Quote the speaker, not the headline, with outlet and date, and link the original where possible.
- Separate the claim from the evidence offered for it, and say who made which statement.
- Grade the evidence and show differing views side by side where the evidence is unsettled.
- State what we could not access or verify, and what would change the verdict either way.
- Ask for the missing evidence in specific, answerable requests.
- Offer a right of reply where a check finds a claim Not substantiated, Misleading or Contradicted (or a pledge Not measurable, Off track or Missed), before wider circulation, and append responses.
- Correct errors openly with a version number and change log.
- Whistle-blow only on evidence: a verdict of Misleading or Contradicted requires documents or data that can be shown, not inference.
- Check every side. Government, opposition, NGOs and developers are held to the same standard.
Appendix B: revision log
| Version | Date | Change |
|---|---|---|
| 1.0 | 10 Oct 2026 | First issue. Verdict Misleading (moderate confidence); pending right of reply. |
Sources and archived copies
-
Malta's Waste-to-Energy Project Procurement Reaches its Final Stage, WasteServ (ECOHIVE news), 2023-06-26.
Original · fetched and fingerprinted 2026-10-10; no public snapshot yet
The claim. Read in full 10 Oct 2026 (fourth paragraph). WasteServ's own text on its project website. -
Three world leading giants shortlisted to design, build & operate the ECOHIVE Waste to Energy Plant, WasteServ (ECOHIVE news); reprinted by The Malta Business Weekly, 2020-10-23.
Original · fetched and fingerprinted 2026-10-10; no public snapshot yet
Earlier wording, read in full 10 Oct 2026: "adding an impressive 4.5% as green energy to Malta's total energy demand". Repeated in the release of 2 Nov 2020 (https://www.ecohive.com.mt/en/article?id=4776b9e2-6a1f-4db7-af40-8a35dca3451d). -
ECOHIVE: The Project (Waste-to-Energy Facility), WasteServ, undated (read 10 Oct 2026).
Original · fetched and fingerprinted 2026-10-10; no public snapshot yet
Speaker's own figures: "the plant will generate 126GWh annually to the grid"; "40% of non-recyclable waste generated in Malta"; capacity 192,000 t; commissioning December 2026. -
Analysis: Is Burning Waste At Magħtab The Only Way Out Of Malta's Waste Crisis?, Amphora Media, 2025-06-06.
Original · fetched and fingerprinted 2026-10-10; no public snapshot yet
Locator. Reports, in its own words, a January 2025 parliamentary answer by the Environment Minister (40% of non-recyclable waste; 4.5% of the country's energy needs). The answer was not read (parlament.mt 403); not rated. -
Malta's National Energy and Climate Plan (updated), 2021-2030, Government of Malta (hosted by the European Commission), Dec 2024.
Original · fetched and fingerprinted 2026-10-10; no public snapshot yet
Plant design (p. 132: 2 lines x 12 t/h, 14-16 MW net); 2030 projections (pp. 94, 344); "This is not expected to contribute to Malta's RES share" (p. 144). Printed page numbers. -
Complete energy balances (nrg_bal_c); electricity (nrg_cb_e); municipal waste (env_wasmun); waste treatment and generation (env_wastrt, env_wasgen), Eurostat, retrieved 10 Oct 2026.
Original · fetched and fingerprinted 2026-10-10; no public snapshot yet
Primary data; extracts and checks in data/cc-079/.
Right of reply
The body concerned has not yet been asked to reply. Its response will be published here, beside the verdict.
Connections
How this claim relates to the others: who made it, the themes it shares with other claims, and the patterns it shows. A connection is a reason to read two checks side by side. It does not make either one right or wrong. How connections are found.
Who made it
Other claims by WasteServ 2
Linked directly 4
Claims that share a theme with this one. A theme is a cause, a mechanism, a target or a way of presenting figures that the editors have found in several claims; its strength says how close the link is.
Waste and construction Shared material flow · Weak (indicative)
Inert mineral waste dominates Malta's recycling statistics, which ties waste claims to development projects. ERA and NSO confirm construction waste was about 2.2 of 2.9 Mt generated in 2023; the link to specific projects is still indicative.
Selective-metric pattern Rhetorical pattern · Pattern, not causal
A favourable metric is cited while the regulator-relevant metric looks worse. Useful for tagging, not for implying a common cause.
Same pattern
Pattern tags name a recurring way a claim can mislead. They describe the statement, not the speaker.
Selective metric
A favourable metric is cited while the regulator-relevant metric looks worse.
- CC-002 Comino tree compensation (Largely supported)
- CC-003 Per-capita emissions vs 2030 projection (Misleading)
- CC-004 'Strong progress' in waste separation (Not substantiated)
- CC-009 More RO, less WSC groundwater (Largely supported)
- CC-025 Per-capita emissions down 44% since 2005 (Largely supported)
- CC-026 EU's largest rise in emissions (Largely supported)
- CC-114 PN: only EU state with rising emissions intensity (Misleading)
Promise-without-baseline
A target or pledge with no stated starting point, scope or counting basis.
- CC-008 Flyovers and congestion (Not substantiated)
- CC-010 Tree-planting counts (Largely supported)
- CC-011 Ten minutes' walk to green space (pledge: Not measurable)
- CC-012 Ta' Qali gravel and grass (Contradicted)
- CC-017 Land reclamation outside the Freeport (Not substantiated)
- CC-021 Malta-Gozo tunnel traffic (not yet checked)
- CC-029 First offshore wind farm (Largely supported)
- CC-030 Carbon-neutral airport (Not substantiated)
- CC-031 Gozo, first climate-neutral region (Largely supported)
- CC-039 Net Zero Impact Utility (pledge: Not measurable)
- CC-055 Manoel Island back to the public (Supported)
- CC-092 PN: afforestation in a net-zero Gozo (pledge: Not measurable)
- CC-107 A net-zero Gozo by 2040 (pledge: Not measurable)
- CC-108 Net-zero impact on the groundwater environment (pledge: Not measurable)
- CC-125 EU: Malta Social Climate Plan EUR 60.6 million (not yet checked)
Two steps away 8
Not linked to this claim directly, but linked to a claim that is. These are found by following the links, not chosen by the editors, so they are looser: they show where one theme meets another.
- CC-002 Comino tree compensation (Largely supported)through Waste and constructionCC-004Waste and construction
- CC-003 Per-capita emissions vs 2030 projection (Misleading)through Waste and constructionCC-004Selective-metric pattern
- CC-007 Within EU limits vs WHO guideline (Largely supported)through Waste and constructionCC-004Selective-metric pattern
- CC-008 Flyovers and congestion (Not substantiated)through Waste and constructionCC-004Waste and construction
- CC-010 Tree-planting counts (Largely supported)through Waste and constructionCC-004Selective-metric pattern
- CC-017 Land reclamation outside the Freeport (Not substantiated)through Waste and constructionCC-004Waste and construction
- CC-081 Landfill share rising (not yet checked)through Waste and constructionCC-004Waste and construction or Waste and constructionCC-111Waste and construction
- CC-117 EU: Malta missed recycling targets (reasoned opinion) (not yet checked)through Waste and constructionCC-004Waste and construction or Waste and constructionCC-111Waste and construction
Three steps away 29
One step further again. At this distance a connection says more about how the themes fit together than about this claim.
- CC-001 Upper Barrakka concrete (Not substantiated)through Waste and constructionCC-004Waste and constructionCC-002Sealed soil and concrete
- CC-011 Ten minutes' walk to green space (pledge: Not measurable)through Waste and constructionCC-004Selective-metric patternCC-0032030 carbon target
- CC-012 Ta' Qali gravel and grass (Contradicted)through Waste and constructionCC-004Waste and constructionCC-002Sealed soil and concrete
- CC-013 Permits keep property prices in check (Largely supported)through Waste and constructionCC-004Waste and constructionCC-017Planning, housing and land take
- CC-014 Fewer enforcement notices, fewer illegalities (Misleading)through Waste and constructionCC-004Waste and constructionCC-017Planning, housing and land take
- CC-016 Shore-to-ship: 90% less harbour pollution (Misleading)through Waste and constructionCC-004Selective-metric patternCC-003Transport, air and climate
- CC-018 IMF 'confirms' MDA on housing (Largely supported)through Waste and constructionCC-004Waste and constructionCC-017Planning, housing and land take
- CC-019 830,000 m2 of land lost in five years (Not substantiated)through Waste and constructionCC-004Waste and constructionCC-002Sealed soil and concrete
- CC-020 EP study: noise law not the cause (Largely supported)through Waste and constructionCC-004Selective-metric patternCC-007Compliance-not-health pattern
- CC-021 Malta-Gozo tunnel traffic (not yet checked)through Waste and constructionCC-004Selective-metric patternCC-003Transport, air and climate
- CC-025 Per-capita emissions down 44% since 2005 (Largely supported)through Waste and constructionCC-004Selective-metric patternCC-0032030 carbon target
- CC-026 EU's largest rise in emissions (Largely supported)through Waste and constructionCC-004Selective-metric patternCC-003Transport, air and climate
- CC-033 Delimara: 'much cleaner air' (not yet checked)through Waste and constructionCC-004Selective-metric patternCC-007Compliance-not-health pattern
- CC-035 PM2.5 death rate down two-thirds (Largely supported)through Waste and constructionCC-004Selective-metric patternCC-007Transport, air and climate
- CC-054 Project Green: 100,000 m2 a year (not yet checked)through Waste and constructionCC-004Selective-metric patternCC-010Replanting as currency
- CC-056 Central Link: 'only 254 trees' (not yet checked)through Waste and constructionCC-004Waste and constructionCC-008Replanting as currency
- CC-057 1,649 compensation trees (not yet checked)through Waste and constructionCC-004Selective-metric patternCC-010Replanting as currency
- CC-063 Construction waste: 'standstill' warning (Not substantiated)through Waste and constructionCC-004Waste and constructionCC-017Waste and construction
- CC-069 82 million bus trips (not yet checked)through Waste and constructionCC-004Waste and constructionCC-008Transport, air and climate
- CC-072 EUR 15m to take cars off the road (not yet checked)through Waste and constructionCC-004Waste and constructionCC-008Transport, air and climate
- CC-076 36 more vehicles a day (Supported)through Waste and constructionCC-004Waste and constructionCC-008Transport, air and climate
- CC-094 Commission: Malta to emit more in 2030 than in 2005 (Supported)through Waste and constructionCC-004Selective-metric patternCC-0032030 carbon target
- CC-101 EU: no registration or prior authorisation of water abstraction in Malta (Largely supported)through Waste and constructionCC-004Waste and constructionCC-117EU findings of unmet obligations
- CC-109 EU: transport is 48% of effort-sharing emissions (Largely supported)through Waste and constructionCC-004Selective-metric patternCC-0032030 carbon target
- CC-110 EU: 37.7% of new cars zero-emission (Supported)through Waste and constructionCC-004Selective-metric patternCC-007Selective-metric pattern
- CC-114 PN: only EU state with rising emissions intensity (Misleading)through Waste and constructionCC-004Selective-metric patternCC-003Selective-metric pattern
- CC-115 Chamber: congestion cost EUR 770m, 3.4% of GDP (Not substantiated)through Waste and constructionCC-004Waste and constructionCC-008Transport, air and climate
- CC-128 EU: Malta missed the water-plan timetable (not yet checked)through Waste and constructionCC-004Waste and constructionCC-117EU findings of unmet obligations
- CC-129 EU: Malta has not updated its air pollution programme (not yet checked)through Waste and constructionCC-004Waste and constructionCC-117EU findings of unmet obligations
Similar wording
Claims whose own words overlap with this one, with the words they share. Found by comparing the wording of the claims, not their verdicts; a lead to read them together, not a finding.
- CC-080 EUR 75m organic plant (not yet checked)shares: plant, wasteserv, tonnes
Timeline
What was said, what was published before and after it, and each step of this check, in date order. Statements and sources carry the date they were published. The steps of the check carry the date the research was done, from the check's research log. Other statements by the same body on the same topic show whether a position was repeated, changed or corrected.
2008
2010
2012
- 2012 Evidence published Fossil and biogenic CO2 from waste incineration based on a yearlong radiocarbon study (Mohn et al.), Waste Management 32(8):1516-1520, Elsevier
2015
2018
- 30 May 2018 Evidence published Directive (EU) 2018/850 amending Directive 1999/31/EC on the landfill of waste, EU Publications Office
- 10 December 2018 Statement published Parliamentary sitting transcript, 10 Dec 2018 (Maltese), Parliament of Malta
- 11 December 2018 Evidence published Directive (EU) 2018/2001 on the promotion of the use of energy from renewable sources (recast), EU Publications Office
2020
- 23 October 2020 Reported Three world leading giants shortlisted to design, build and operate the ECOHIVE Waste to Energy Plant (reprint), The Malta Business Weekly
- 23 October 2020 Evidence published Three world leading giants shortlisted to design, build & operate the ECOHIVE Waste to Energy Plant, WasteServ (ECOHIVE news)
- 2 November 2020 Evidence published Waste to Energy Procurement Process to Move to Next Stage After No Appeals Following Shortlisting, WasteServ (ECOHIVE news)
2022
- 31 October 2022 Statement published Waste-to-energy press release (2022), Department of Information (gov.mt), PR221484
2023
- 26 June 2023 The statement WasteServ (this claim)
- 26 June 2023 Evidence published Malta's Waste-to-Energy Project Procurement Reaches its Final Stage, WasteServ (ECOHIVE news)
2024
- December 2024 Evidence published Malta's National Energy and Climate Plan (updated), 2021-2030, Government of Malta (hosted by the European Commission)
2025
- June 2025 Reported Analysis: Is Burning Waste At Magħtab The Only Way Out Of Malta's Waste Crisis?, Amphora Media
2026
- 19 January 2026 Later statement by WasteServ on Waste CC-004 'Strong progress' in waste separation (Not substantiated)
- 3 March 2026 Reported No funds for Magħtab waste-to-energy plant project promised in 2017, The Shift News
- 13 April 2026 Later statement by WasteServ on Waste CC-080 EUR 75m organic plant (not yet checked)
- 4 October 2026 Added to the claims to check
- 10 October 2026 Check started Amphora Media (6 Jun 2025) read; it locates the 4.5% and 40% (as the outlet's account of a January 2025 parliamentary answer) but not 192,000 t. parlament.mt, pq.gov.mt and gov.mt returned 403.
- 10 October 2026 Exact wording found WasteServ's own wording found on its ECOHIVE site and read in full: news of 26 Jun 2023 (192,000 t; "around 4.5% of Malta's total energy needs"), 23 Oct and 2 Nov 2020 ("4.5% as green energy to Malta's total energy demand") and the project page (126 GWh a year to the grid; 40% of non-recyclable waste). Claim text restated from the primary wording; speaker WasteServ.
- 10 October 2026 Note Eurostat nrg_bal_c, nrg_cb_e, env_wasmun, env_wastrt and env_wasgen downloaded; Malta's updated NECP (Dec 2024) read for the plant design, 2030 projections and renewable share; literature on efficiency and biogenic share verified in Crossref (abstracts via Europe PMC). Every reading of the 4.5% recomputed (tools/cc-079-report/calc.py).
- 10 October 2026 Version 1.0: first issue First issue. Verdict Misleading (moderate confidence); pending right of reply. Verdict in this version: Misleading, moderate confidence.
- 10 October 2026 Evidence reviewed
2027
- 10 October 2027 Coming up: Evidence review due Each finished check is reviewed against new evidence within a year.
Every change to this claim's record is public: history of the record.
Download the report and flyer