CC-007 · Air · Air quality & health
Within EU limits vs WHO guideline
Largely supported High confidence Draft: no right of reply needed
Claim Check 007 · Air quality, Malta
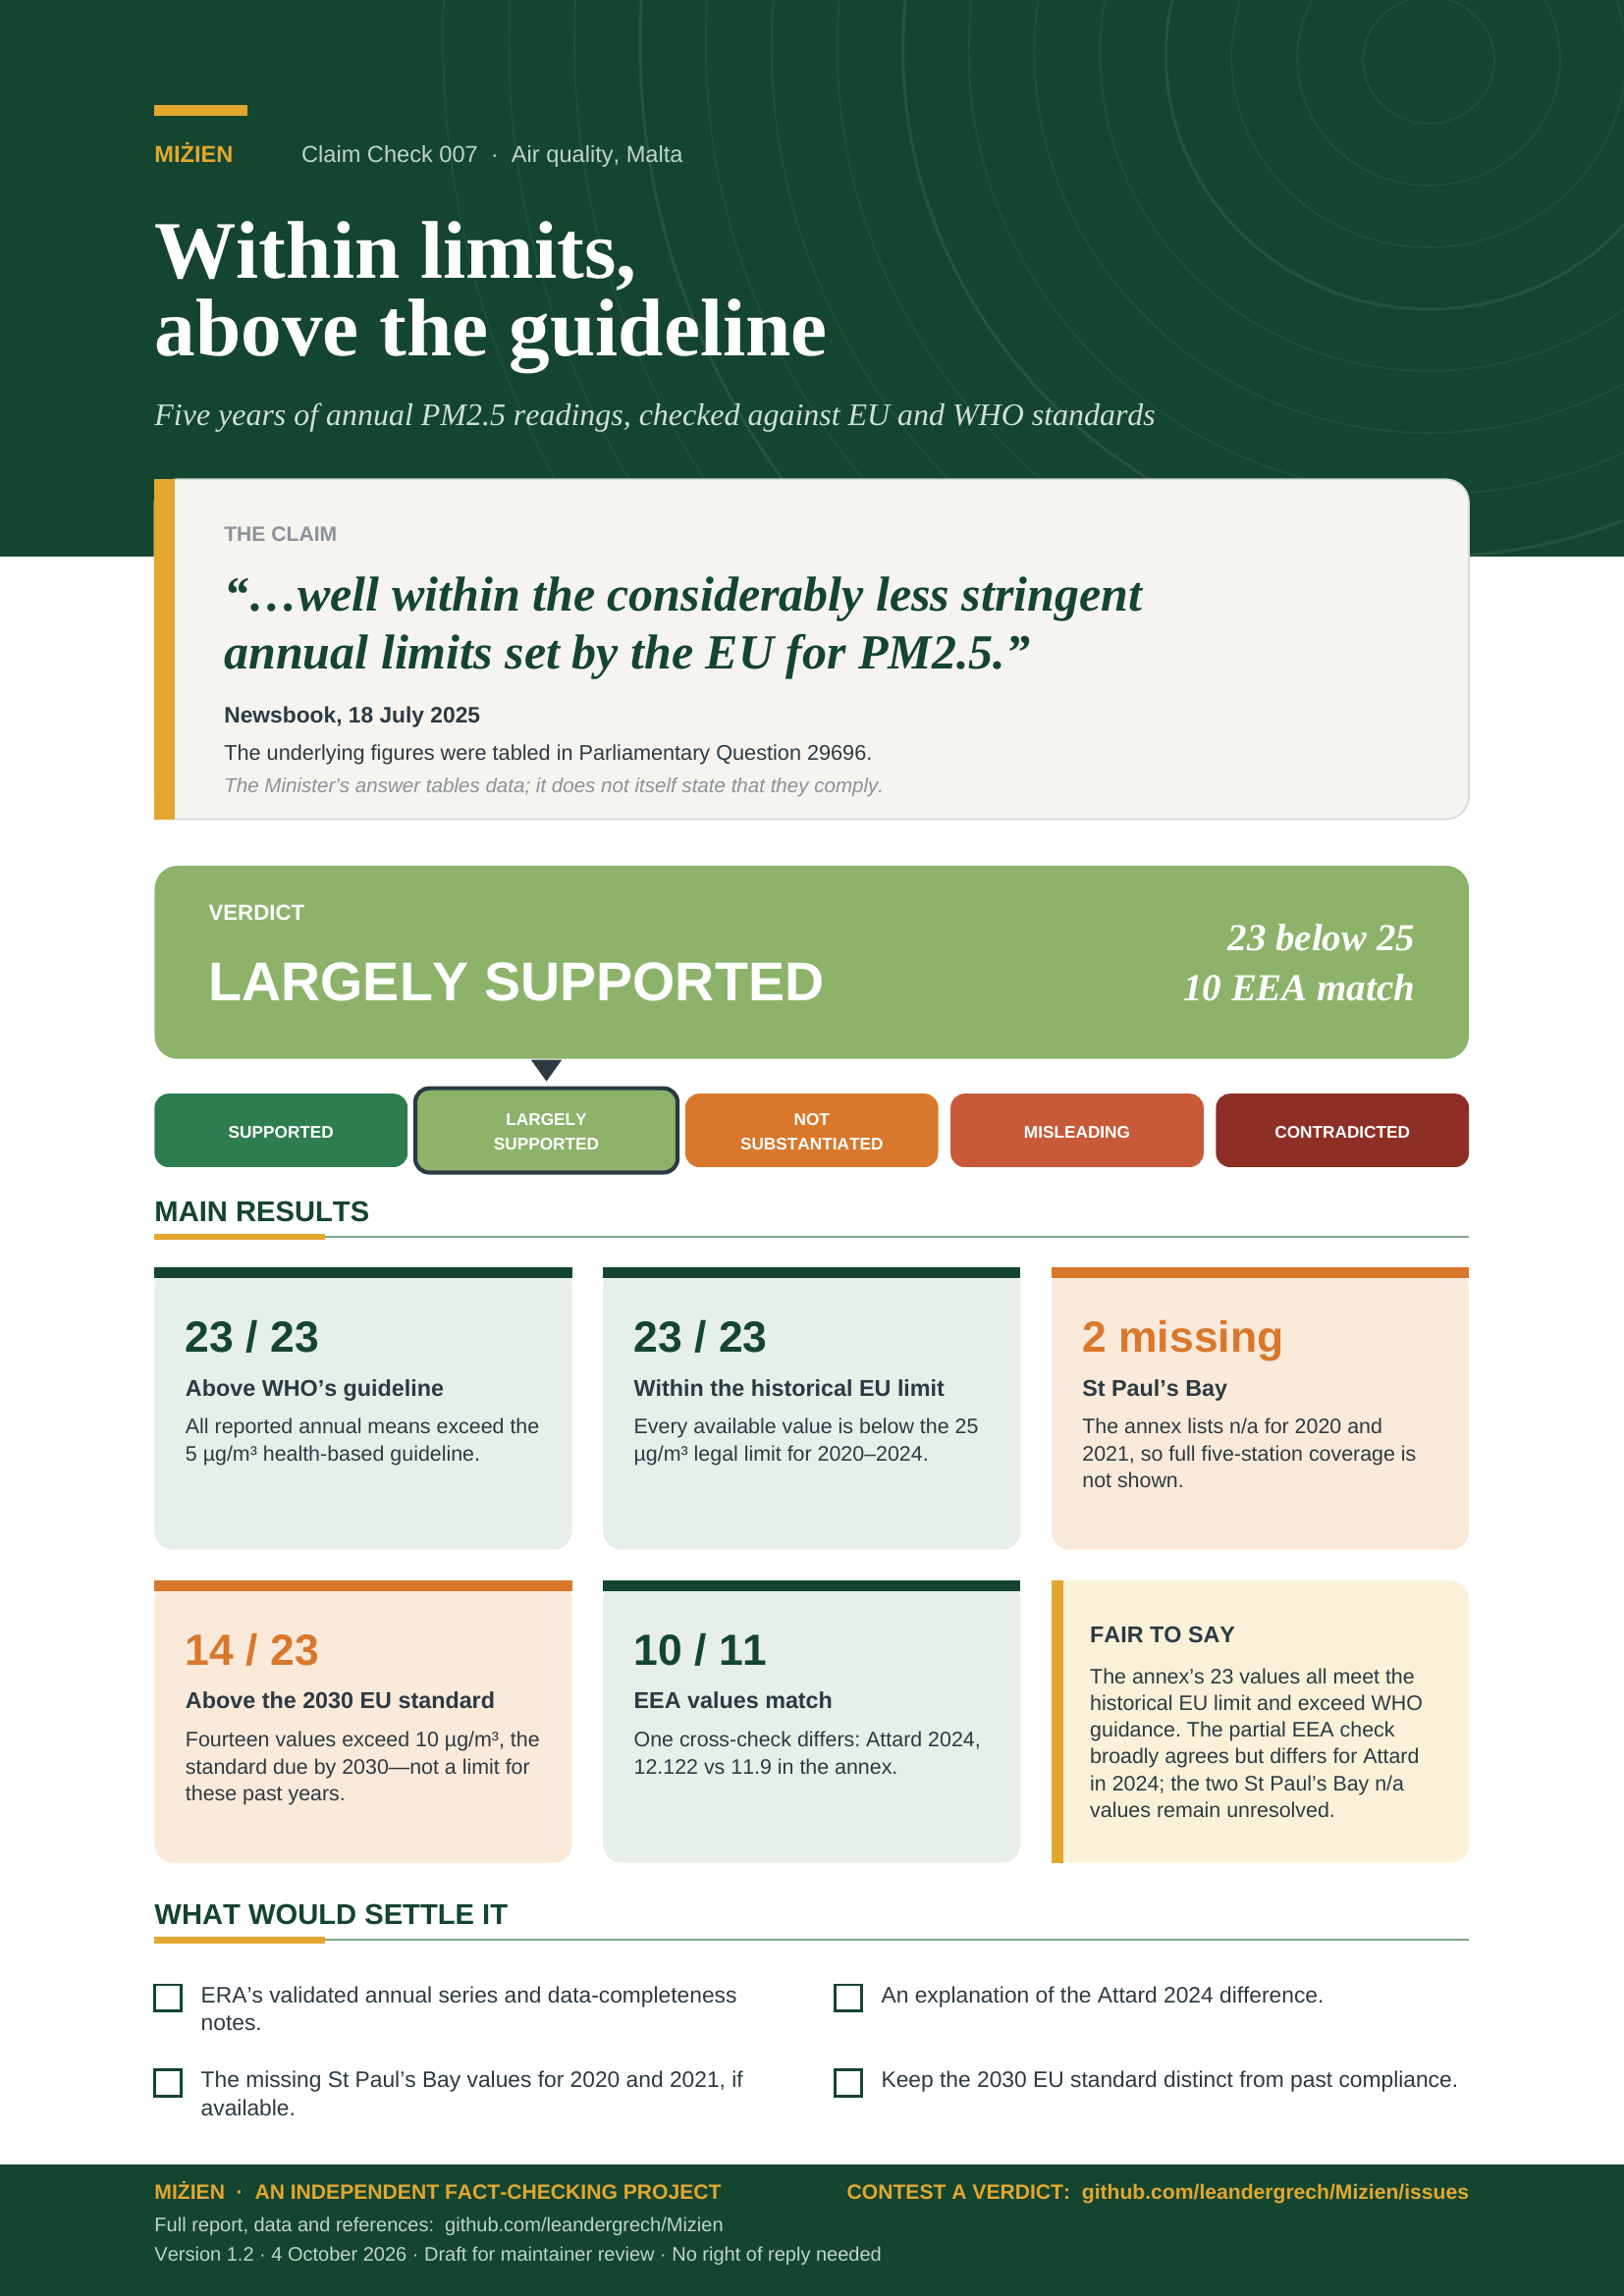
Within limits, above the guideline
Five years of annual PM2.5 readings checked against EU and WHO thresholds
“…well within the considerably less stringent annual limits set by the EU…”
Newsbook, 18 July 2025, on Parliamentary Question 29696
The Minister tabled the figures; the compliance statement is our test of that table.
Verdict: Largely supported All 23 values under 25; two St Paul’s Bay years missing
Version 1.2 · 4 October 2026
TL;DR
On 18 July 2025 Newsbook reported that measurements taken between 2020 and 2024 at ERA’s five monitoring stations “are well within the considerably less stringent annual limits set by the EU for fine particulate matter (PM2.5)”, while all stations are “well above stringent WHO guidelines”. The source behind the report is Parliamentary Question 29696: the Minister tabled annual station values for 2020–2024. The answer itself is procedural; the numbers, not a ministerial statement of compliance, are what this check tests.
- The historical EU comparison holds for reported values. All 23 values supplied are below the 25 µg/m³ annual EU limit applicable during 2020–2024.
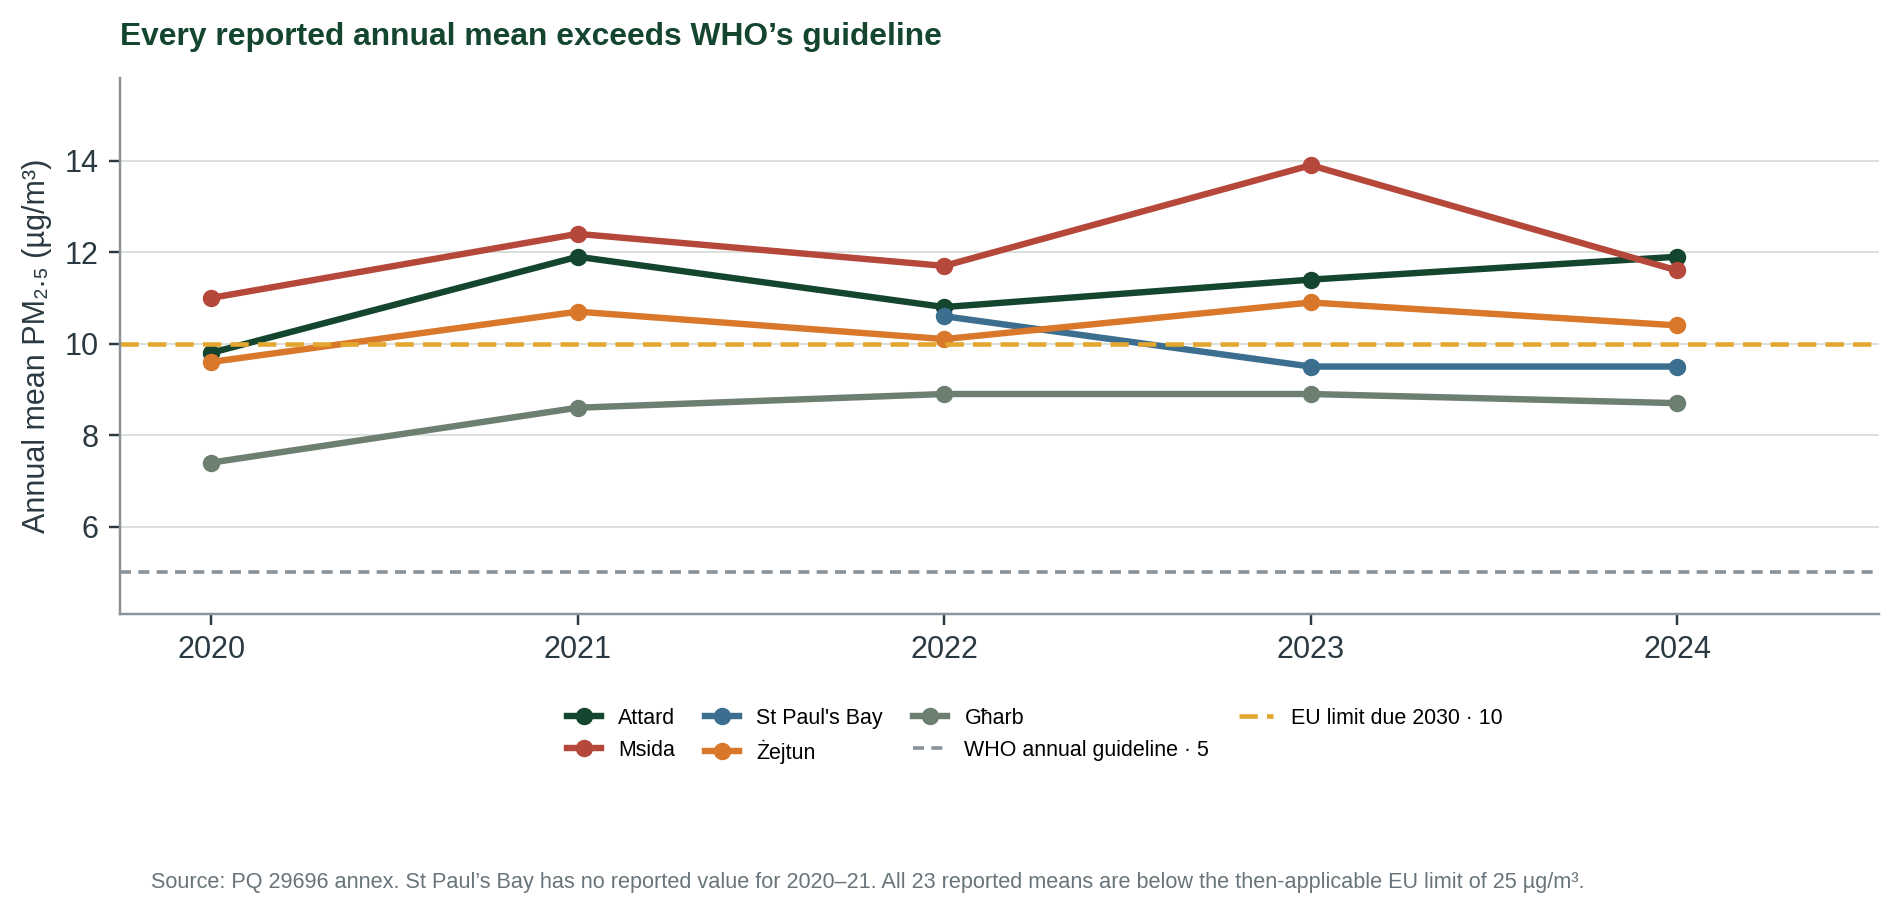
- Every reported value is above WHO’s health-based guideline. The annual means range from 7.4 to 13.9 µg/m³; the WHO guideline is 5 µg/m³.
- Two station-years are missing. St Paul’s Bay is marked n/a in 2020 and 2021, so the table cannot establish compliance at all five stations for every year.
- The next EU standard is stricter. Fourteen of 23 values exceed the 10 µg/m³ annual limit the EU requires states to attain by 2030. This is context, not a breach during 2020–2024.
- An independent EEA cross-check is mostly consistent. The EEA validated daily files cover 11 station-years in 2020–2024. Ten match the annex when rounded to one decimal; Attard 2024 does not.
- Newsbook’s figures match the table. Every station value Newsbook quotes for 2024, and its note that Msida was highest in the previous four years, match the annex.
- Verdict: largely supported (high confidence). The comparison holds for all 23 annex values and is confirmed independently by EEA data. Two St Paul’s Bay entries are missing.
- Supported
- Largely supported
- Not substantiated
- Misleading
- Contradicted
What would move the verdict up
ERA’s validated annual series with completeness notes, and an explanation for the Attard 2024 difference.
What would move it down
A corrected official table showing an annual mean above 25 µg/m³, or evidence the table’s values are not comparable to that limit.
IN THIS REPORT
1 What was asked and answered
On 16 July 2025, MP Rebekah Borg asked the Minister for the Environment, Energy and Public Cleanliness for the annual PM2.5 means recorded by every ERA monitoring station for the previous five years. In her answer, Minister Miriam Dalli said the requested information was being laid on the Table of the House. The 1-page annex provided the station-by-station values reproduced in this report [1].
The proposition assessed is Newsbook’s report of 18 July 2025, read in full from an archived copy [7]: the 2020–2024 measurements at the five ERA stations “are well within the considerably less stringent annual limits set by the EU” and above WHO’s guideline. It is not presented as a direct quotation from the Minister. The parliamentary portal lists the question as Legislature XIV, Sitting 368, question 29696, 16 July 2025 [1].
| Year | Attard | Msida | St Paul’s Bay | Żejtun | Għarb |
|---|---|---|---|---|---|
| 2020 | 9.8 | 11.0 | n/a | 9.6 | 7.4 |
| 2021 | 11.9 | 12.4 | n/a | 10.7 | 8.6 |
| 2022 | 10.8 | 11.7 | 10.6 | 10.1 | 8.9 |
| 2023 | 11.4 | 13.9 | 9.5 | 10.9 | 8.9 |
| 2024 | 11.9 | 11.6 | 9.5 | 10.4 | 8.7 |
Table 1. Annual PM2.5 concentration in µg/m³, transcribed from the annex to PQ 29696 [1]. “n/a” is retained as printed.
2 Standards and method
We compared every value in the parliamentary annex with three different reference points. The annual EU limit applicable during 2020–2024 was 25 µg/m³. The WHO’s 2021 air-quality guideline recommends 5 µg/m³ as the annual mean; it is health-based guidance, not the EU legal limit [2–3]. Recast EU Directive 2024/2881 sets a 10 µg/m³ annual limit to be attained by 1 January 2030 [3]. We keep that future standard separate from compliance in the years reported.
The annex has 25 possible station-year cells. We transcribed its 23 numeric values and kept the two St Paul’s Bay n/a entries missing rather than imputing them. tools/cc-007-report/calc.py recalculates counts, range and station means from data/cc-007/station_pm25.csv; the formulas and results are saved in data/cc-007/checks.csv.
Evidence grades: the parliamentary answer is grade C (official monitoring data reproduced in an answer); the WHO guideline is grade C (evidence-based professional guidance); the EU limit is grade C (primary legislation). This is a standards-and-record check, not an independent exposure or health assessment. The WHO guideline is informed by systematic reviews of health evidence [2, 4].
3 What the table shows
| Measure | Result | Interpretation |
|---|---|---|
| Reported values | 23 of 25 | Two station-years unavailable: St Paul’s Bay, 2020–21. |
| WHO annual guideline (5 µg/m³) | 23/23 above | Every reported station-year exceeds the health-based guideline. |
| EU annual limit in 2020–2024 (25 µg/m³) | 23/23 at or below | All available values meet the historical legal limit. |
| EU limit due by 2030 (10 µg/m³) | 14/23 above | A forward-looking comparison; not the applicable limit in 2020–2024. |
Across the 23 supplied observations, annual means range from 7.4 µg/m³ (Għarb, 2020) to 13.9 µg/m³ (Msida, 2023). By station, means of the available years range from 8.50 µg/m³ at Għarb to 12.12 µg/m³ at Msida. The St Paul’s Bay mean uses only 2022–2024, since the first two years are absent. These are descriptive arithmetic means of the annual values in the annex, not multi-year regulatory statistics.
4 Interpretation and limitations
The three comparisons answer different questions. The 25 µg/m³ EU limit is a legal compliance benchmark for the period under review. The WHO value is a health-based guideline; being below a legal limit does not mean air pollution has no health relevance. The 10 µg/m³ EU standard signals a future regulatory direction. It is not valid to present the 2020–2024 readings above 10 as breaches of a limit that is to be attained in 2030 [2–3].
Compliance and health are distinct
SUPPORTED WITH CAVEATEVIDENCE FOR THE CLAIM'S IMPRESSION
Every numeric value in the official table is below the EU’s 25 µg/m³ limit applicable to the reported years.
EVIDENCE AGAINST
Every numeric value is above the WHO 5 µg/m³ annual guideline; 14 also exceed the future EU 10 µg/m³ standard.
The EEA Air Quality download service publishes validated station measurements. We averaged its valid daily PM2.5 aggregates for each calendar year with available coverage from 2020 to 2024. This reproduced 11 of the annex’s 25 possible station-years: ten values round to the annex at one decimal place. The EEA mean of valid daily aggregates for Attard in 2024 is 12.122 µg/m³, while the annex reports 11.9. Both are above the WHO guideline and below the 25 µg/m³ EU annual limit; the 0.2 difference remains unexplained. The retrieved EEA files provide no validated daily series for the other 14 station-years, including St Paul’s Bay in 2020–21. Absence from those files does not establish that measurements were not made. Derived values, valid-day counts, source URLs and file hashes are saved in data/cc-007/eea_validated_crosscheck.csv and data/cc-007/eea_station_file_manifest.csv; regenerate them with tools/cc-007-report/eea_crosscheck.py [5].
Neither the parliamentary table nor this partial EEA check provides a full basis for local exposure or individual health outcomes. ERA’s validated annual series, annual completeness notes and an explanation of the Attard difference are still needed for a complete reconciliation.
The official annex’s two n/a cells are material to the phrase “all five stations” across the full period. They are not evidence that St Paul’s Bay exceeded the legal limit; they leave those two station-years unverified.
5 Verdict and evidence needed
All reported values meet the applicable EU limit and exceed WHO’s guideline; two station-years are missing. Confidence: high.
The reported comparison is supported for all 23 numeric observations in the annex: each is below the EU annual limit of 25 µg/m³ in force for 2020–2024, and each exceeds the WHO annual guideline of 5 µg/m³. The EEA check independently supports this broad comparison for 11 station-years, although one rounded table value differs. Newsbook’s article, now read in full, quotes the 2024 station values exactly as tabled. Confidence is high because the official table and the EEA data agree; the verdict stops short of Supported because the annex marks two St Paul’s Bay values n/a, so “all five stations” is not shown for 2020 and 2021. Attard’s 2024 value still needs reconciliation. The Minister’s answer tables figures but does not herself claim compliance.
A complete comparison needs ERA’s validated annual series with completeness and quality-control notes, the missing St Paul’s Bay results if they exist, and an explanation for the Attard 2024 difference.
Under our standards a right of reply is sought only where a check finds a claim Not substantiated, Misleading or Contradicted, so none is needed for this check. The status remains a draft for maintainer review.
Reproducible files: data/cc-007/station_pm25.csv, data/cc-007/checks.csv, data/cc-007/eea_validated_crosscheck.csv and scripts under tools/cc-007-report/. The exact Maltese question and answer, transcribed annex and attachment hashes are in literature/CC-007/primary-source.md.
6 Sources
- [1] House of Representatives (2025). Parliamentary Question 29696, Legislature XIV, Sitting 368, 16 July 2025; oral question and tabled annex. https://pqs.parlament.mt/?pqid=68a890cbcb302292bff56dce
- [2] World Health Organization (2021). WHO Global Air Quality Guidelines, Table 3.26: annual PM2.5 guideline 5 µg/m³. https://iris.who.int/bitstream/handle/10665/345329/9789240034228-eng.pdf
- [3] European Parliament and Council (2024). Directive (EU) 2024/2881, Annex I: 25 µg/m³ limit through 11 December 2026; 10 µg/m³ to be attained by 1 January 2030. https://eur-lex.europa.eu/eli/dir/2024/2881/oj/eng
- [4] Pérez Velasco R., Jarosińska D. (2022). Update of the WHO global air quality guidelines: systematic reviews – An introduction. Environment International 170:107556. doi:10.1016/j.envint.2022.107556. WHO guideline-development context. https://doi.org/10.1016/j.envint.2022.107556
- [5] European Environment Agency (accessed 3 October 2026). Air Quality Download Service, verified E1a station data. Annual figures here are means of valid daily aggregates and are used as a partial cross-check. https://air.discomap.eea.europa.eu/arcgis/rest/services/AirQuality/AirQualityDownloadServiceEUMonitoringStations/MapServer/0
- [6] CDE (published 19 July 2025). Malta News Briefing – Saturday 19 July 2023. Reproduces the Newsbook PM2.5 comparison; secondary source only. https://cde.news/malta-news-briefing-saturday-19-july-2023/
- [7] Newsbook (18 July 2025). “Air pollution exceeds WHO guidelines throughout Maltese islands.” The claim; read in full from the Wayback Machine snapshot of 20 July 2025. http://web.archive.org/web/20250720183305/https://newsbook.com.mt/en/air-pollution-exceeds-who-guidelines-throughout-maltese-islands/
Appendix A: series standards and verdict scale
Every investigation in this series follows the same rules so that verdicts are comparable and challengeable.
| Verdict | Meaning |
|---|---|
| SUPPORTED | Evidence consistently backs the claim as stated. |
| LARGELY SUPPORTED | Backed by the evidence, with minor caveats that do not change the substance. |
| NOT SUBSTANTIATED | Stated more strongly than the evidence offered or available allows. May be true in some conditions but has not been shown. |
| MISLEADING | Omits material facts so that the overall impression is inaccurate, even if individual statements are defensible. |
| CONTRADICTED | The available evidence points against the claim. |
Confidence
High: multiple independent lines of evidence agree. Moderate: evidence is relevant but incomplete or indirect. Low: evidence is thin, second-hand or conflicting.
Evidence grades
A experiment · B observational study with a control or gradient · C review, professional guidance, official statistics or primary legislation · D assertion or anecdote. The official parliamentary table is the direct evidence for the recorded annual means; this report does not infer exposures or health outcomes beyond those readings.
Standards
- Quote the speaker, not the headline, with outlet and date, and link the original where possible.
- Separate the claim from the evidence offered for it, and say who made which statement.
- Grade the evidence and show differing views side by side where the evidence is unsettled.
- State what we could not access or verify, and what would change the verdict either way.
- Ask for the missing evidence in specific, answerable requests.
- Offer a right of reply where a check finds a claim Not substantiated, Misleading or Contradicted (or a pledge Not measurable, Off track or Missed), before wider circulation, and append responses.
- Correct errors openly with a version number and change log.
- Whistle-blow only on evidence: a verdict of Misleading or Contradicted requires documents or data that can be shown, not inference.
- Check every side. Government, opposition, NGOs and developers are held to the same standard.
Appendix B: revision log
| Version | Date | Change |
|---|---|---|
| 1.0 | 2 Oct 2026 | First draft based on Parliamentary Question 29696 and its tabled annex. |
| 1.1 | 3 Oct 2026 | Added an independent partial cross-check against EEA validated station data; documented one unresolved Attard 2024 difference. |
| 1.2 | 4 Oct 2026 | Newsbook article read in full (Wayback snapshot): verbatim wording quoted, its figures checked against the annex; confidence raised to high. |
Sources and archived copies
-
Air pollution exceeds WHO guidelines throughout Maltese islands, Newsbook, 2025-07-18.
Original · Archived copy
The claim. Read in full 4 Oct 2026 from the Wayback snapshot of 20 Jul 2025 (http://web.archive.org/web/20250720183305/https://newsbook.com.mt/en/air-pollution-exceeds-who-guidelines-throughout-maltese-islands/); its 2024 station figures match the PQ annex. -
Malta News Briefing – Saturday 19 July 2023, CDE News, 2025-07-19.
Original · fetched and fingerprinted 2026-10-10; no public snapshot yet
Secondary clipping reproduces Newsbook's five-station comparison and attributes it to Newsbook; it is a locator, not primary evidence. The headline says 2023, but the page was published on 19 July 2025 (page metadata, checked 5 Oct 2026); the year in the headline is the publisher's. -
Parliamentary Question 29696, oral question and tabled annex, House of Representatives of Malta, 2025-07-16.
Original · not yet archived
Primary source. The Minister tabled annual station data; her answer does not itself assert legal compliance. - WHO Global Air Quality Guidelines (2021), World Health Organization, 2021. Original · fetched and fingerprinted 2026-10-10; no public snapshot yet
- Directive (EU) 2024/2881 on ambient air quality and cleaner air for Europe, European Parliament and Council, 2024. Original · fetched and fingerprinted 2026-10-10; no public snapshot yet
-
EEA Air Quality Download Service, validated station measurements, European Environment Agency, 2026-10-03.
Original · fetched and fingerprinted 2026-10-10; no public snapshot yet
Partial independent cross-check; 11 of 25 possible station-years have valid daily aggregates in retrieved station files; one differs from the annex.
Right of reply
Not needed: this check finds the claim supported. A right of reply is sought when a check finds a claim Not substantiated, Misleading or Contradicted.
Connections
How this claim relates to the others: who made it, the themes it shares with other claims, and the patterns it shows. A connection is a reason to read two checks side by side. It does not make either one right or wrong. How connections are found.
Who made it
Other claims by Newsbook 2
Linked directly 11
Claims that share a theme with this one. A theme is a cause, a mechanism, a target or a way of presenting figures that the editors have found in several claims; its strength says how close the link is.
Transport, air and climate Shared driver · Strong
Fleet growth links traffic claims, air quality and emissions. The climate report names transport and buildings as the lagging sectors.
Selective-metric pattern Rhetorical pattern · Pattern, not causal
A favourable metric is cited while the regulator-relevant metric looks worse. Useful for tagging, not for implying a common cause.
Compliance-not-health pattern Rhetorical pattern · Pattern, not causal
Meeting an EU legal limit or procedure is presented as if it meant a health-protective level: air (WHO PM2.5 guideline) and noise (WHO noise guidelines).
Same pattern
Pattern tags name a recurring way a claim can mislead. They describe the statement, not the speaker.
Compliance-not-health
Meeting a legal limit is presented as if it meant a health-protective level.
Two steps away 26
Not linked to this claim directly, but linked to a claim that is. These are found by following the links, not chosen by the editors, so they are looser: they show where one theme meets another.
- CC-001 Upper Barrakka concrete (Not substantiated)through Transport, air and climateCC-008Sealed soil and concrete or Selective-metric patternCC-010Replanting as currency
- CC-002 Comino tree compensation (Largely supported)through Selective-metric patternCC-004Waste and construction or Transport, air and climateCC-008Sealed soil and concrete or Selective-metric patternCC-010Replanting as currency
- CC-011 Ten minutes' walk to green space (pledge: Not measurable)through Transport, air and climateCC-0032030 carbon target
- CC-012 Ta' Qali gravel and grass (Contradicted)through Transport, air and climateCC-008Sealed soil and concrete
- CC-017 Land reclamation outside the Freeport (Not substantiated)through Selective-metric patternCC-004Waste and construction or Transport, air and climateCC-008Waste and construction
- CC-019 830,000 m2 of land lost in five years (Not substantiated)through Transport, air and climateCC-008Sealed soil and concrete
- CC-025 Per-capita emissions down 44% since 2005 (Largely supported)through Transport, air and climateCC-0032030 carbon target
- CC-026 EU's largest rise in emissions (Largely supported)through Transport, air and climateCC-003Transport, air and climate or Selective-metric patternCC-110Transport, air and climate
- CC-054 Project Green: 100,000 m2 a year (not yet checked)through Selective-metric patternCC-010Replanting as currency
- CC-056 Central Link: 'only 254 trees' (not yet checked)through Transport, air and climateCC-008Replanting as currency
- CC-057 1,649 compensation trees (not yet checked)through Selective-metric patternCC-010Replanting as currency
- CC-069 82 million bus trips (not yet checked)through Transport, air and climateCC-008Transport, air and climate
- CC-072 EUR 15m to take cars off the road (not yet checked)through Transport, air and climateCC-008Transport, air and climate or Selective-metric patternCC-110Transport, air and climate
- CC-075 Seventh in the EU for cars (Misleading)through Selective-metric patternCC-110Transport, air and climate
- CC-076 36 more vehicles a day (Supported)through Transport, air and climateCC-008Transport, air and climate
- CC-079 Waste-to-energy: 4.5% of energy (Misleading)through Selective-metric patternCC-004Waste and construction
- CC-081 Landfill share rising (not yet checked)through Selective-metric patternCC-004Waste and construction
- CC-094 Commission: Malta to emit more in 2030 than in 2005 (Supported)through Transport, air and climateCC-0032030 carbon target
- CC-104 PN: Malta fails EU noise law (not yet checked)through Compliance-not-health patternCC-020Noise governance
- CC-105 ADPD: no study of Freeport and airport noise (Largely supported)through Compliance-not-health patternCC-020Noise governance
- CC-109 EU: transport is 48% of effort-sharing emissions (Largely supported)through Transport, air and climateCC-0032030 carbon target or Transport, air and climateCC-008Transport, air and climate or Selective-metric patternCC-110Transport, air and climate
- CC-111 EU: 621 kg of waste a head, 74% landfilled (Supported)through Selective-metric patternCC-004Waste and construction
- CC-114 PN: only EU state with rising emissions intensity (Misleading)through Transport, air and climateCC-003Selective-metric pattern
- CC-115 Chamber: congestion cost EUR 770m, 3.4% of GDP (Not substantiated)through Transport, air and climateCC-008Transport, air and climate
- CC-117 EU: Malta missed recycling targets (reasoned opinion) (not yet checked)through Selective-metric patternCC-004Waste and construction
- CC-120 EP study: 54,000 exposed to road noise, likely an underestimate (Largely supported)through Compliance-not-health patternCC-020Noise governance
Three steps away 17
One step further again. At this distance a connection says more about how the themes fit together than about this claim.
- CC-013 Permits keep property prices in check (Largely supported)through Selective-metric patternCC-004Waste and constructionCC-017Planning, housing and land take
- CC-014 Fewer enforcement notices, fewer illegalities (Misleading)through Selective-metric patternCC-004Waste and constructionCC-017Planning, housing and land take
- CC-018 IMF 'confirms' MDA on housing (Largely supported)through Selective-metric patternCC-004Waste and constructionCC-017Planning, housing and land take
- CC-022 'Lowest electricity burden in the EU' (Largely supported)through Transport, air and climateCC-0032030 carbon targetCC-025Selective-metric pattern
- CC-024 Renewables target for 2030 (Not substantiated)through Transport, air and climateCC-0032030 carbon targetCC-0112030 carbon target
- CC-031 Gozo, first climate-neutral region (Largely supported)through Transport, air and climateCC-003Transport, air and climateCC-026Shared emissions figures
- CC-058 96% of farmland in use (not yet checked)through Transport, air and climateCC-008Sealed soil and concreteCC-019Planning, housing and land take
- CC-059 Subsidies are 20% of farm output (not yet checked)through Transport, air and climateCC-008Sealed soil and concreteCC-019Farmland and farming pressure
- CC-063 Construction waste: 'standstill' warning (Not substantiated)through Selective-metric patternCC-004Waste and constructionCC-017Waste and construction
- CC-071 EUR 100m a year for free buses (Not substantiated)through Transport, air and climateCC-008Transport, air and climateCC-069Transport, air and climate
- CC-080 EUR 75m organic plant (not yet checked)through Selective-metric patternCC-004Waste and constructionCC-079Waste and construction
- CC-101 EU: no registration or prior authorisation of water abstraction in Malta (Largely supported)through Selective-metric patternCC-004Waste and constructionCC-117EU findings of unmet obligations
- CC-123 KPMG: 8,716 residential units approved in 2024, up 7.4% (not yet checked)through Transport, air and climateCC-008Sealed soil and concreteCC-019Planning, housing and land take
- CC-127 EU: Malta has the lowest organic share in the EU (not yet checked)through Transport, air and climateCC-008Sealed soil and concreteCC-019Farmland and farming pressure
- CC-128 EU: Malta missed the water-plan timetable (not yet checked)through Selective-metric patternCC-004Waste and constructionCC-117EU findings of unmet obligations
- CC-129 EU: Malta has not updated its air pollution programme (not yet checked)through Selective-metric patternCC-004Waste and constructionCC-117EU findings of unmet obligations
- CC-130 NGOs: ODZ racecourse policy ends protection (not yet checked)through Transport, air and climateCC-008Sealed soil and concreteCC-019Farmland and farming pressure
Timeline
What was said, what was published before and after it, and each step of this check, in date order. Statements and sources carry the date they were published. The steps of the check carry the date the research was done, from the check's research log. Other statements by the same body on the same topic show whether a position was repeated, changed or corrected.
2021
- 2021 Evidence published WHO Global Air Quality Guidelines (2021), World Health Organization
2024
- 2024 Evidence published Directive (EU) 2024/2881, European Parliament and Council
2025
- 2025 Reported Air pollution exceeds WHO guidelines throughout Maltese islands, Newsbook
- 16 July 2025 Statement published Parliamentary Question 29696, oral question and tabled annex, House of Representatives of Malta
- 18 July 2025 The statement Newsbook, summarising Parliamentary Question 29696 (this claim)
- 19 July 2025 Reported Malta News Briefing – Saturday 19 July 2023, CDE News
2026
- 2 October 2026 Version 1.0: first issue First draft based on Parliamentary Question 29696 and its tabled annex.
- 3 October 2026 Version 1.1 Added an independent partial cross-check against EEA validated station data; documented one unresolved Attard 2024 difference.
- 4 October 2026 Version 1.2 Newsbook article read in full (Wayback snapshot): verbatim wording quoted, its figures checked against the annex; confidence raised to high. Verdict in this version: Largely supported, high confidence.
- 4 October 2026 Evidence reviewed
- 5 October 2026 Clarification Source 6 (CDE News) is headlined 'Malta News Briefing – Saturday 19 July 2023', but the page was published on 19 July 2025 (its own metadata; 19 July 2025 was a Saturday). The record already gave the 2025 date; a note now says that the year in the headline is the publisher's. No figure or finding changes. all corrections
- 5 October 2026 Clarification Right-of-reply status brought into line with the 5 Oct 2026 rule: a reply is sought only where a check finds a claim Not substantiated, Misleading or Contradicted, so this check needs none. Cover, page footer, flyer and the standards appendix now say so. Findings, verdict and confidence unchanged. all corrections
2027
- 4 October 2027 Coming up: Evidence review due Each finished check is reviewed against new evidence within a year.
Every change to this claim's record is public: history of the record.
Download the report and flyer