CC-094 · Climate & Energy · Emissions & targets
Commission: Malta to emit more in 2030 than in 2005
Supported High confidence Draft: no right of reply needed
Parts of this claim
The claim is split into parts that are tested separately, as in the report below. Each part has its own number.
- CC-094A “Malta’s gap to target is 49 and 61 percentage points”48.7 (planned measures) and 61.1 (existing) from Malta’s March 2025 projections, the legal 2005 level and the −19% target [4, 6, 7].
- CC-094B “…exceeding its 19% reduction target. This means Malta is projected to emit more in 2030 than in 2005.”+29.7% and +42.1% on 2005; above 2005 against every 2005 figure and if re-based on reviewed 2023 data (+26% and +38%) [3, 4].
- CC-094C Germany, Ireland and Malta show the largest projected 2030 gaps before flexibilitiesWith planned measures (our reading of the basis), in points: Malta 48.7, Ireland 20.3, Germany 13.2, Austria next at 8.0. Not so with existing measures (Germany eighth) or in tonnes (Malta 0.5 Mt) [4].
- CC-094D Malta projected to have excess emissions in 2026–2030Covered to 2025 after the ETS flexibility (+0.07 Mt); −1.58 Mt by 2030 (planned measures), −1.55 Mt with the maximum land-use credit [3–5, 8, 9].
- CC-094E “Missing its target” (our claim list’s paraphrase)Not the Commission’s words. Domestically 0.5 Mt over in 2030; legally, compliance possible by buying about 1.6 Mt (1.2% or less of the EU surplus). No safety reserve for Malta [1, 10].
Claim Check 094 · EU assessments and effort-sharing data
More in 2030 than in 2005?
Testing the Commission’s reading of Malta’s projections for its effort-sharing emissions against the data and the law
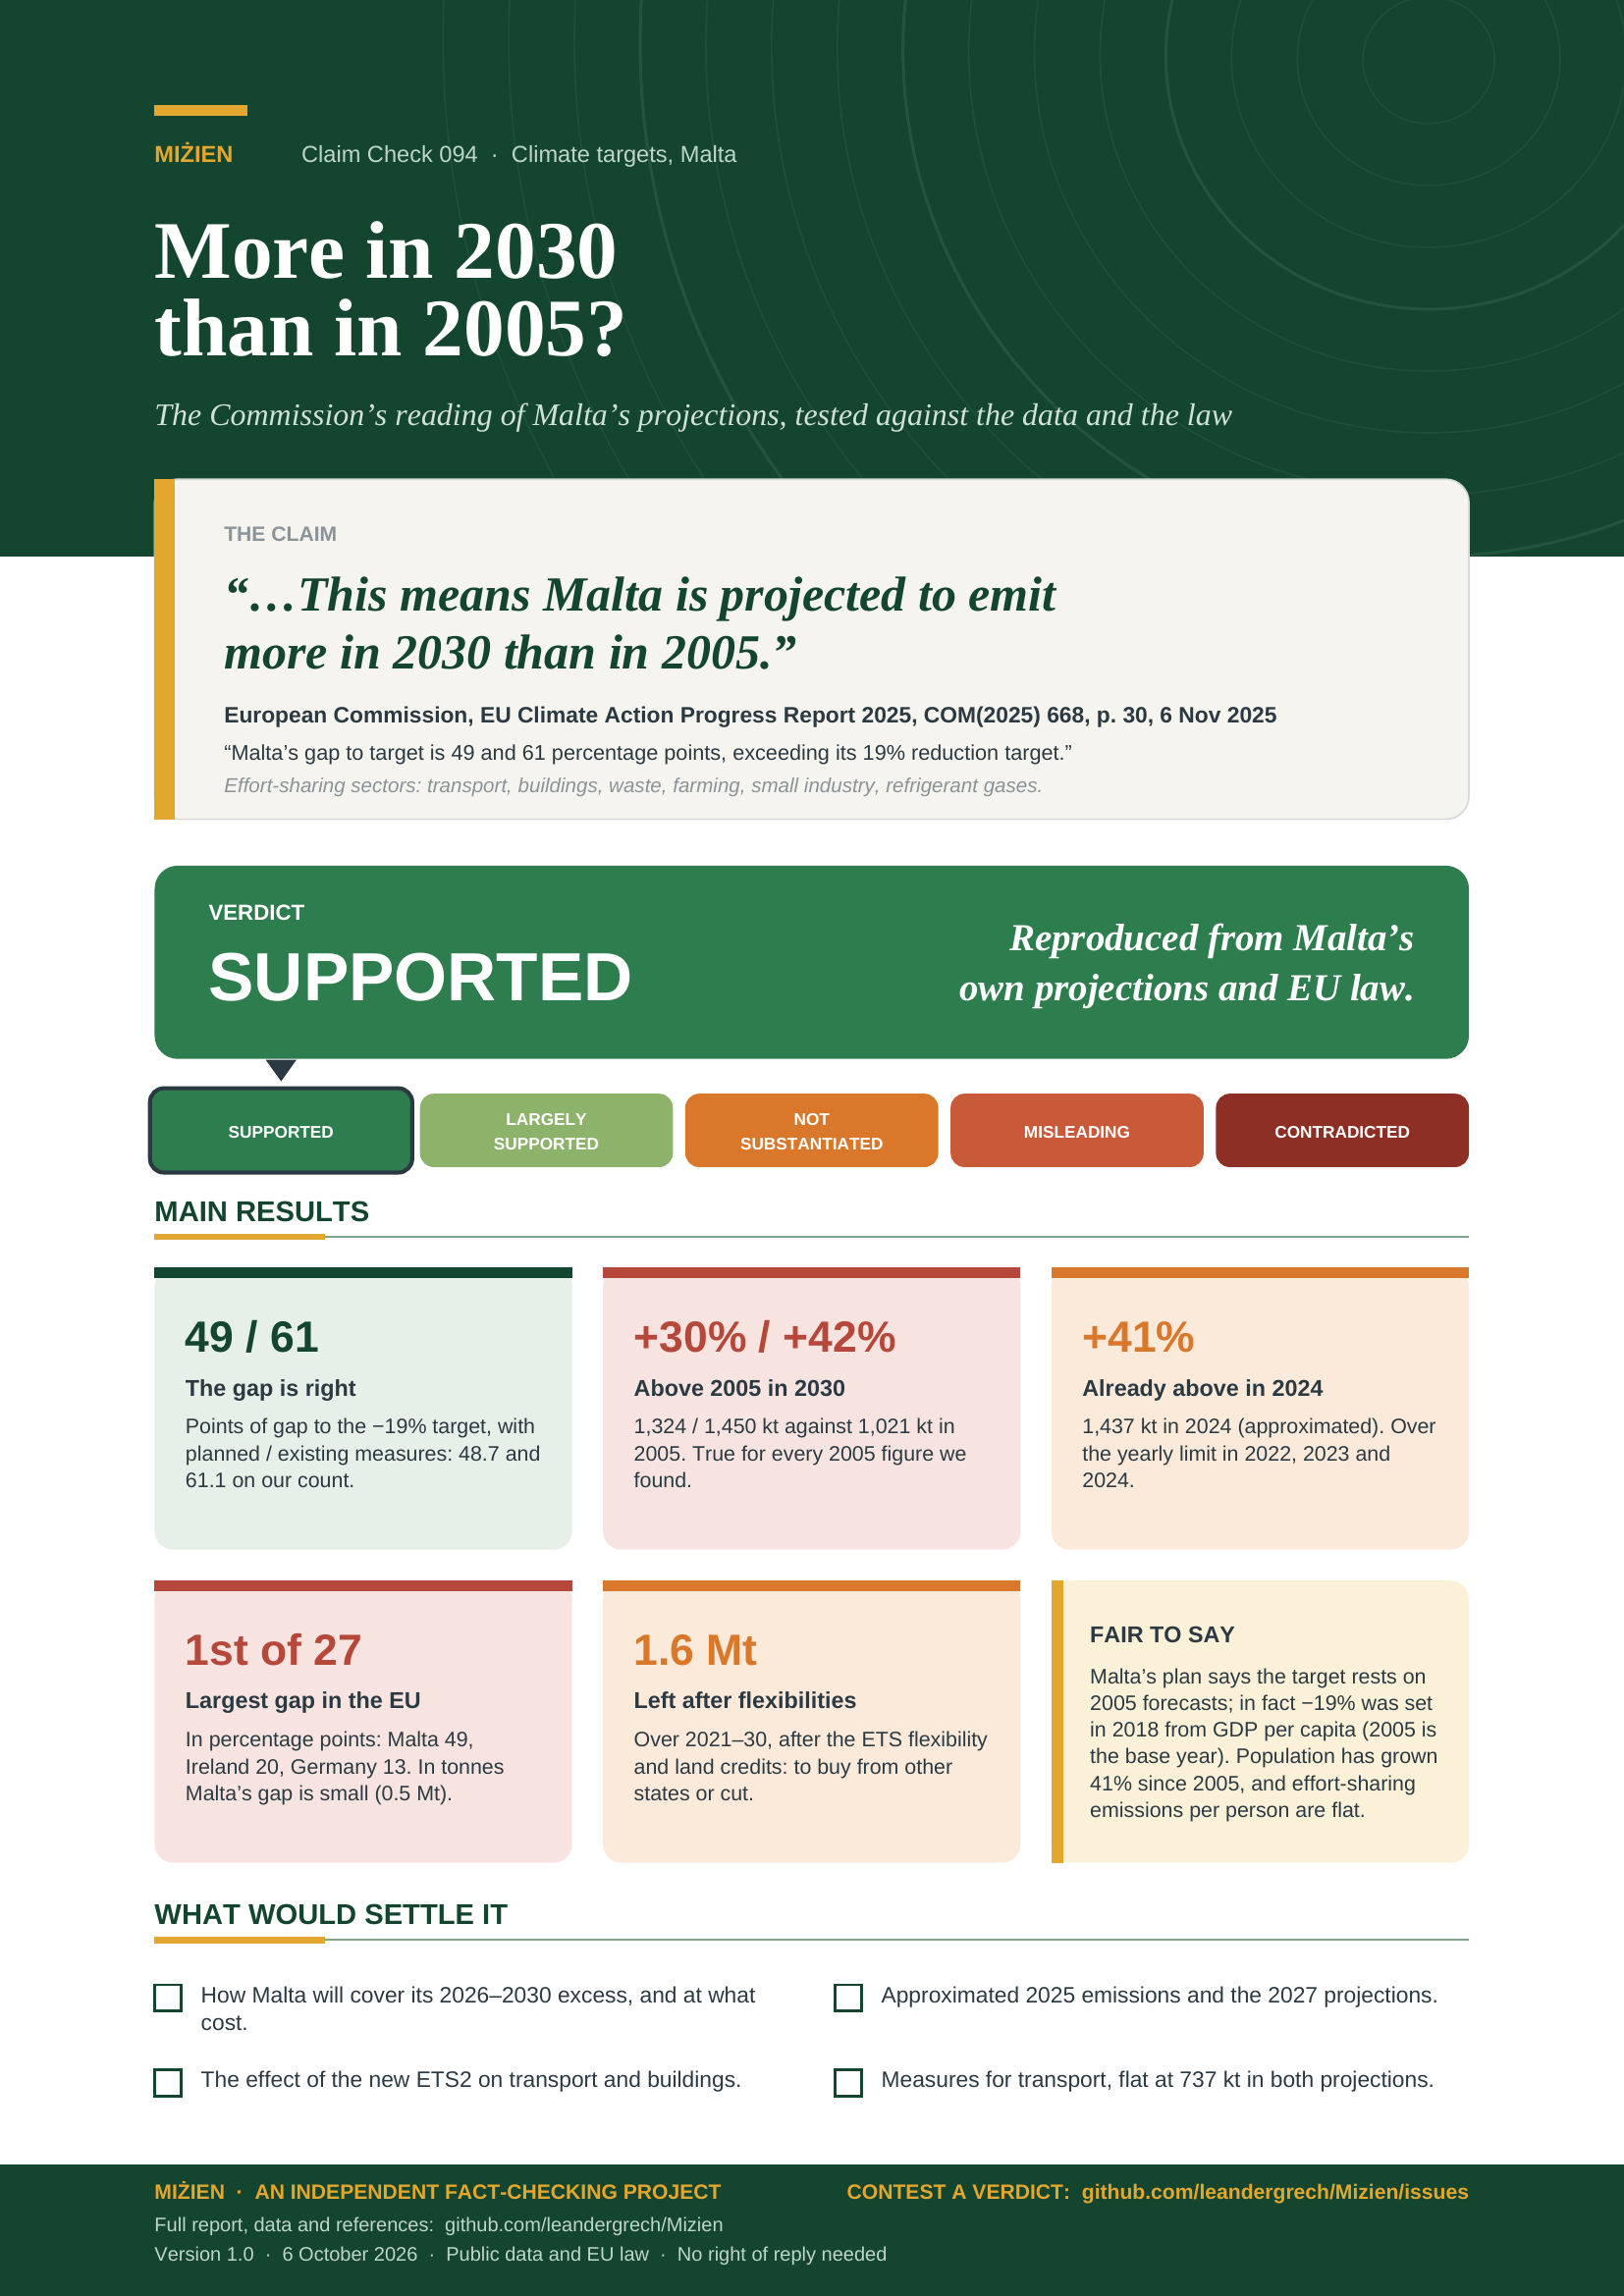
“Malta’s gap to target is 49 and 61 percentage points, exceeding its 19% reduction target. This means Malta is projected to emit more in 2030 than in 2005.”
European Commission, EU Climate Action Progress Report 2025, COM(2025) 668, p. 30, 6 Nov 2025.
Effort-sharing sectors: transport, buildings, waste, agriculture, small industry, refrigerant gases.
Verdict: Supported Reproduced from Malta’s own projections and EU law
Version 1.0 · 6 October 2026
TL;DR
In its EU Climate Action Progress Report 2025 (6 November 2025) the European Commission wrote, under a chart of every Member State’s 2030 outlook: “Malta’s gap to target is 49 and 61 percentage points, exceeding its 19% reduction target. This means Malta is projected to emit more in 2030 than in 2005.” [1] It also named Malta among the countries with the largest gaps. We tested these sentences against Malta’s own projections, the official emissions data and the EU law that sets the target.
- The numbers reproduce to the nearest point. Malta’s March 2025 projections put its effort-sharing emissions at 1,324 kt in 2030 with planned measures and 1,450 kt with existing ones: +29.7% and +42.1% on the 2005 level of 1,021 kt, a gap of 48.7 and 61.1 points to the −19% target [3, 4, 7].
- “More in 2030 than in 2005” holds every way we tried: both scenarios, every 2005 figure we found, and projections re-based on reviewed 2023 data (+26% and +38%). 2024 emissions (approximated) were already 41% above 2005 [3].
- Malta’s gap is the EU’s largest in percentage points: 49, then Ireland 20 and Germany 13 (planned measures). In tonnes it is small (0.5 Mt).
- Flexibilities shrink the gap but do not close it. Malta is projected 2.1 Mt over its yearly limits in 2021–2030. Its own flexibilities cover 0.54 Mt; about 1.6 Mt would have to be bought from other Member States (about 1% of the expected EU surplus) or cut.
- Verdict: supported (high confidence). The Commission’s words match the data and the law. “Missing its target”, in our claim list, is a paraphrase: domestically, emissions miss the 2030 level by 0.5 Mt; legally, compliance can still be bought. Not rated.
- Supported
- Largely supported
- Not substantiated
- Misleading
- Contradicted
What would move the verdict up
None: Supported is the top of the scale.
What would move it down
Evidence that the EEA dataset misrecords Malta’s March 2025 submission, or a revision of the 2005 level or of the reviewed 2021–2023 emissions large enough to bring the 2030 projection down to the 2005 level (it is 303 kt above it with planned measures).
IN THIS REPORT
1 The claim and what we could verify
The speaker is the European Commission, in its annual report to the European Parliament and the Council under the Governance Regulation, COM(2025) 668 final [1]. We read every sentence that mentions Malta. Three passages concern the 2030 effort-sharing target; we rate all three. The claim list’s summary (“missing its target”) is our intake’s paraphrase, not the Commission’s wording.
| What the Commission says | Where | Access |
|---|---|---|
| “Malta’s gap to target is 49 and 61 percentage points, exceeding its 19% reduction target. This means Malta is projected to emit more in 2030 than in 2005.” | Note to Figure 13, p. 30 [1] | Read in full (Publications Office copy) |
| “Prior to any use of ESR flexibilities by Member States to meet their targets, Germany, Ireland and Malta show the largest projected gaps in 2030 whereas Bulgaria, Greece and Portugal show the largest overachievement of their 2030 targets.” | Section 3.2, p. 30 [1] | Read in full |
| “…Austria, Estonia, Germany, Malta, Ireland and Sweden are projected to have excess emissions in the second compliance period (2026-2030).” | Section 3.2, p. 31 [1] | Read in full |
The note does not say which of 49 and 61 belongs to which projection; Figure 13 and the accompanying staff working document (Table 25, p. 114) show 49 with additional (planned) measures and 61 with existing measures [1, 2]. The third sentence rests on stated assumptions: planned measures are implemented, Member States bank and borrow allocations between years, and those that notified the ETS flexibility use it. On the same page the Commission adds that, given the expected EU-wide surplus of allocations, it “cannot, at this stage, conclude that Member States are not making sufficient progress” [1].
2 Method
Question. Do Malta’s reported projections, the official emissions data and the law give a 2030 gap of 49 and 61 points against a −19% target, so that Malta is projected to emit more in 2030 than in 2005? Is Malta’s gap among the largest, and does it survive the flexibilities the law allows?
Evidence. We downloaded from the European Environment Agency (EEA) its effort-sharing emissions for 2005–2024 [3] and the Member States’ 2025 greenhouse gas projections [4], kept each value’s status (reviewed or approximated) and recomputed every figure with tools/cc-094-report/calc.py from data/cc-094/ [18]. The 2005 levels, targets, yearly limits and flexibilities come from the legal texts themselves [5–10], read through the EU Publications Office on 6 October 2026, as was the report [1]. We read the ESR section of Malta’s climate plan [12] and the Commission’s assessment of it [13]. Crossref was searched for peer-reviewed work on effort-sharing gaps and the accuracy of national projections; none on Malta was found (search log in literature/CC-094/notes.md).
Grades. Official statistics, projections reported under EU law and legal texts are grade C under our scale. Verdicts follow the five-point scale in Appendix A.
3 How the effort-sharing target works
The Effort Sharing Regulation (ESR) covers the emissions outside the EU’s main emissions trading system: domestic transport, buildings, agriculture, small industry and waste [1], including industrial gases, which in Malta come almost entirely (over 95%) from refrigeration and air conditioning [12]. Power generation falls under the trading system: in Malta’s projections, energy industries add under 1 kt to its effort-sharing emissions [4]. Each Member State has a 2030 target against its 2005 level; targets differ according to GDP per capita [11]. Malta’s is −19%, set in the 2018 regulation and unchanged by the 2023 revision that raised every other Member State’s target; the 2023 regulation calls it “based on gross domestic product per capita” (recital (19)) [5, 6]. The 2005 level used is fixed in law at 1,020,601 t CO₂e [7], so the 2030 limit is 826.7 kt, the figure Malta’s own plan gives [12].
The target is enforced through yearly limits, the annual emission allocations, set for 2021–2025 and, after a review of 2021–2023 emissions, for 2026–2030 (adopted 24 April 2026) [8]. Malta’s 2021 limit includes a one-off 774 kt adjustment, part of one made for lower-income Member States [5, 11]. Compliance is checked in 2027 (for 2021–2025) and 2032 (for 2026–2030). A Member State over its limits may bank surpluses and borrow from the next year, use the ETS flexibility (cancelling trading-system allowances) or land-use credits, or buy allocations from others. An excess left after all that is added to the next year’s emissions with a 1.08 multiplier [5, 6].
4 What the data show
Projections and the 2005 level
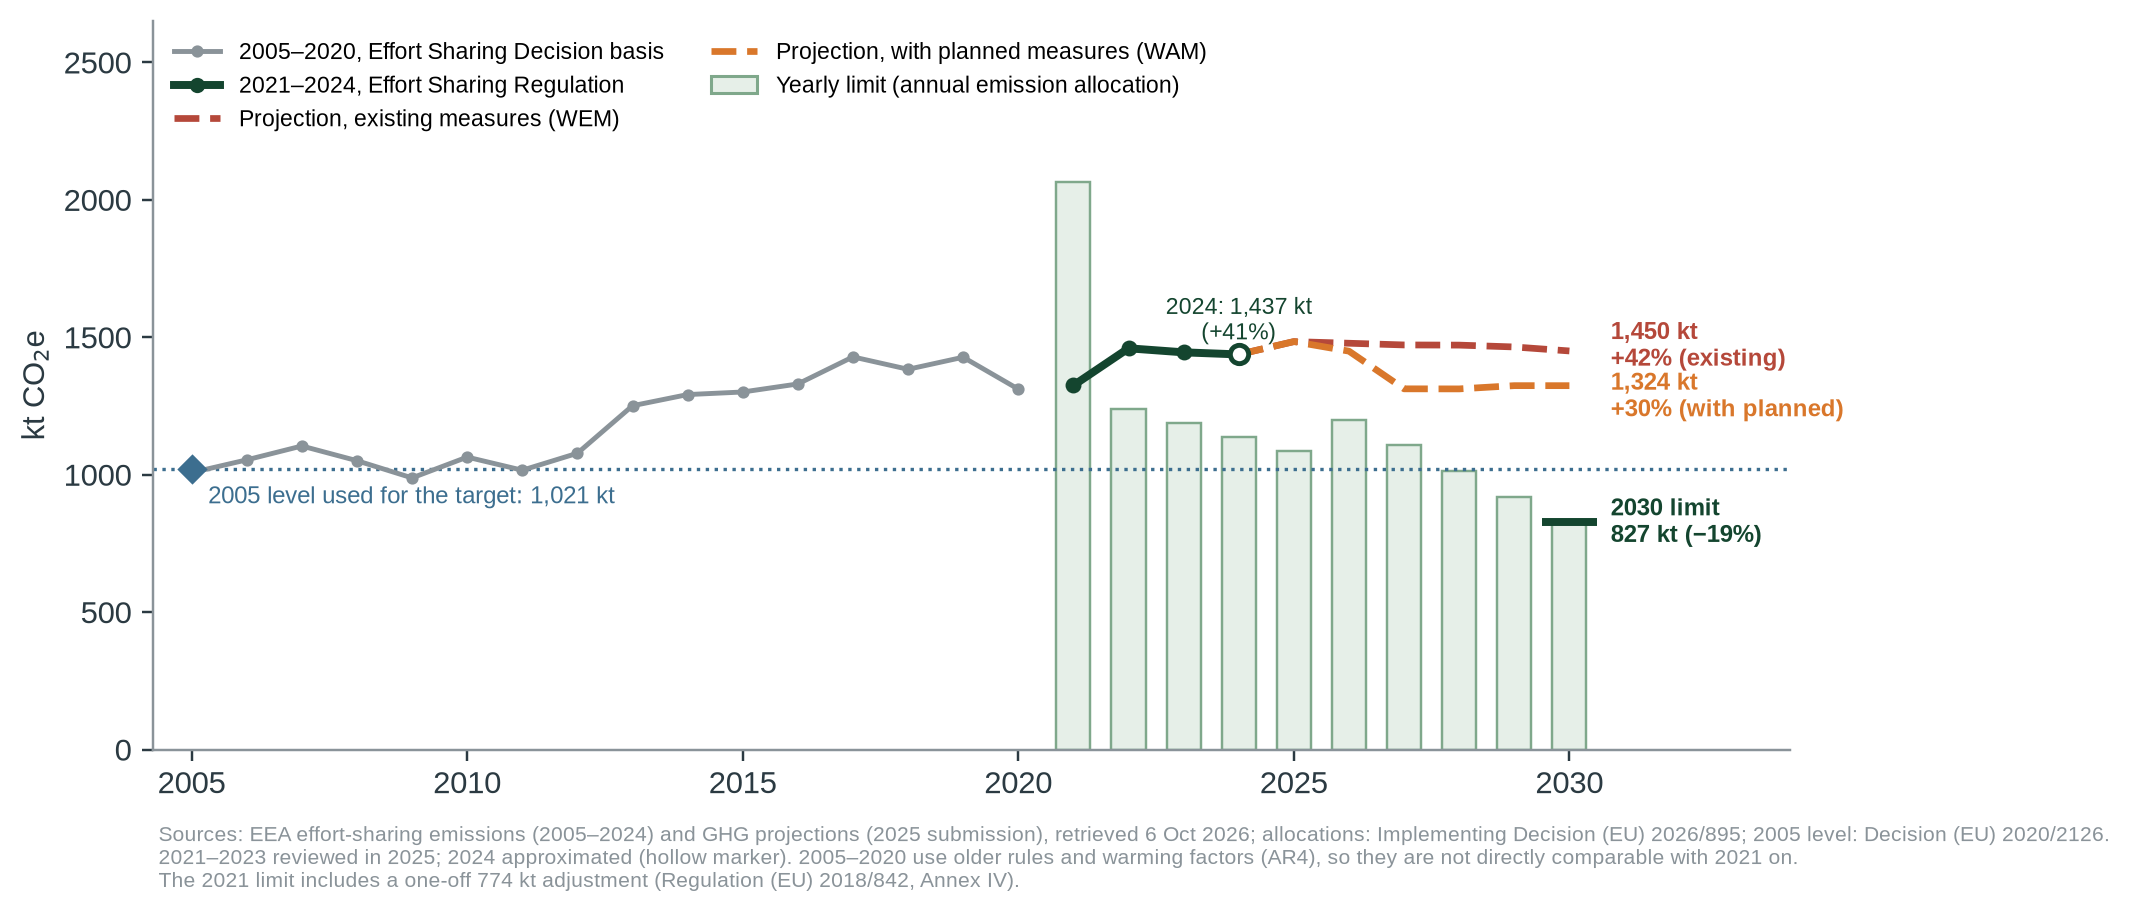
Recomputed against the legal 2005 level, Malta’s March 2025 projections give the Commission’s gaps to the nearest point (table below). Recent years point the same way. Reviewed emissions were 30%, 43% and 42% above the 2005 level in 2021–2023 and approximated emissions 41% above in 2024 (1,437 kt), matching the Commission’s Table 25 [2, 3]. Malta was over its yearly limit by 220, 257 and 301 kt in 2022–2024. The 2024 value is 3.3% below what the projection expected for that year, a small easing. Malta’s own 2025 progress report gives 2023 emissions of 1,448.5 kt and the same 2030 projections [14].
| Measure | Existing measures (WEM) | Planned measures (WAM) | Source | Grade |
|---|---|---|---|---|
| Malta’s 2030 effort-sharing emissions, March 2025 projection | 1,450.1 kt | 1,323.8 kt | EEA [4] | C |
| Change vs the legal 2005 level (1,020.6 kt) | +42.1% | +29.7% | calculated | C |
| Gap to the −19% target | 61.1 points (Commission: 61) | 48.7 points (Commission: 49) | calculated; [1, 2] | C |
| Excess over the 2030 limit of 826.7 kt | 623 kt | 497 kt | calculated | C |
| Against the EEA’s own 2005 estimate (1,007.4 kt, older basis) | +43.9% | +31.4% | EEA [3] | C |
| Against the 2013–2020 base year (1,116.1 kt) | +29.9% | +18.6% | EEA [3] | C |
| Re-based on reviewed 2023 emissions (projection starts 2.6% high) | +38.5% | +26.4% | calculated | C |
| Previous projection, March 2023 | +46.3% | +46.3% | EEA [4] | C |
| Commission’s NECP assessment, May 2025: “existing policies and measures” | +29.4% (as labelled) | – | SWD(2025) 140 [13] | C |
All values in data/cc-094/checks.csv. The legal 2005 level is from Implementing Decision (EU) 2020/2126 [7]; the other two 2005 figures are shown only to test how much the choice matters. The NECP assessment’s +29.4% is labelled existing measures, but it is close to the planned-measures projection (+29.7%), not the existing-measures one (+42.1%).
Every combination leaves 2030 above 2005: the smallest margin, +18.6%, uses an older base year that the current rules do not use. Reaching 827 kt by 2030 would need a 42.5% cut from 2024, about 8.8% a year; the planned-measures projection has 7.9% in all over six years, and the existing-measures one has emissions flat.
Where the projected emissions come from
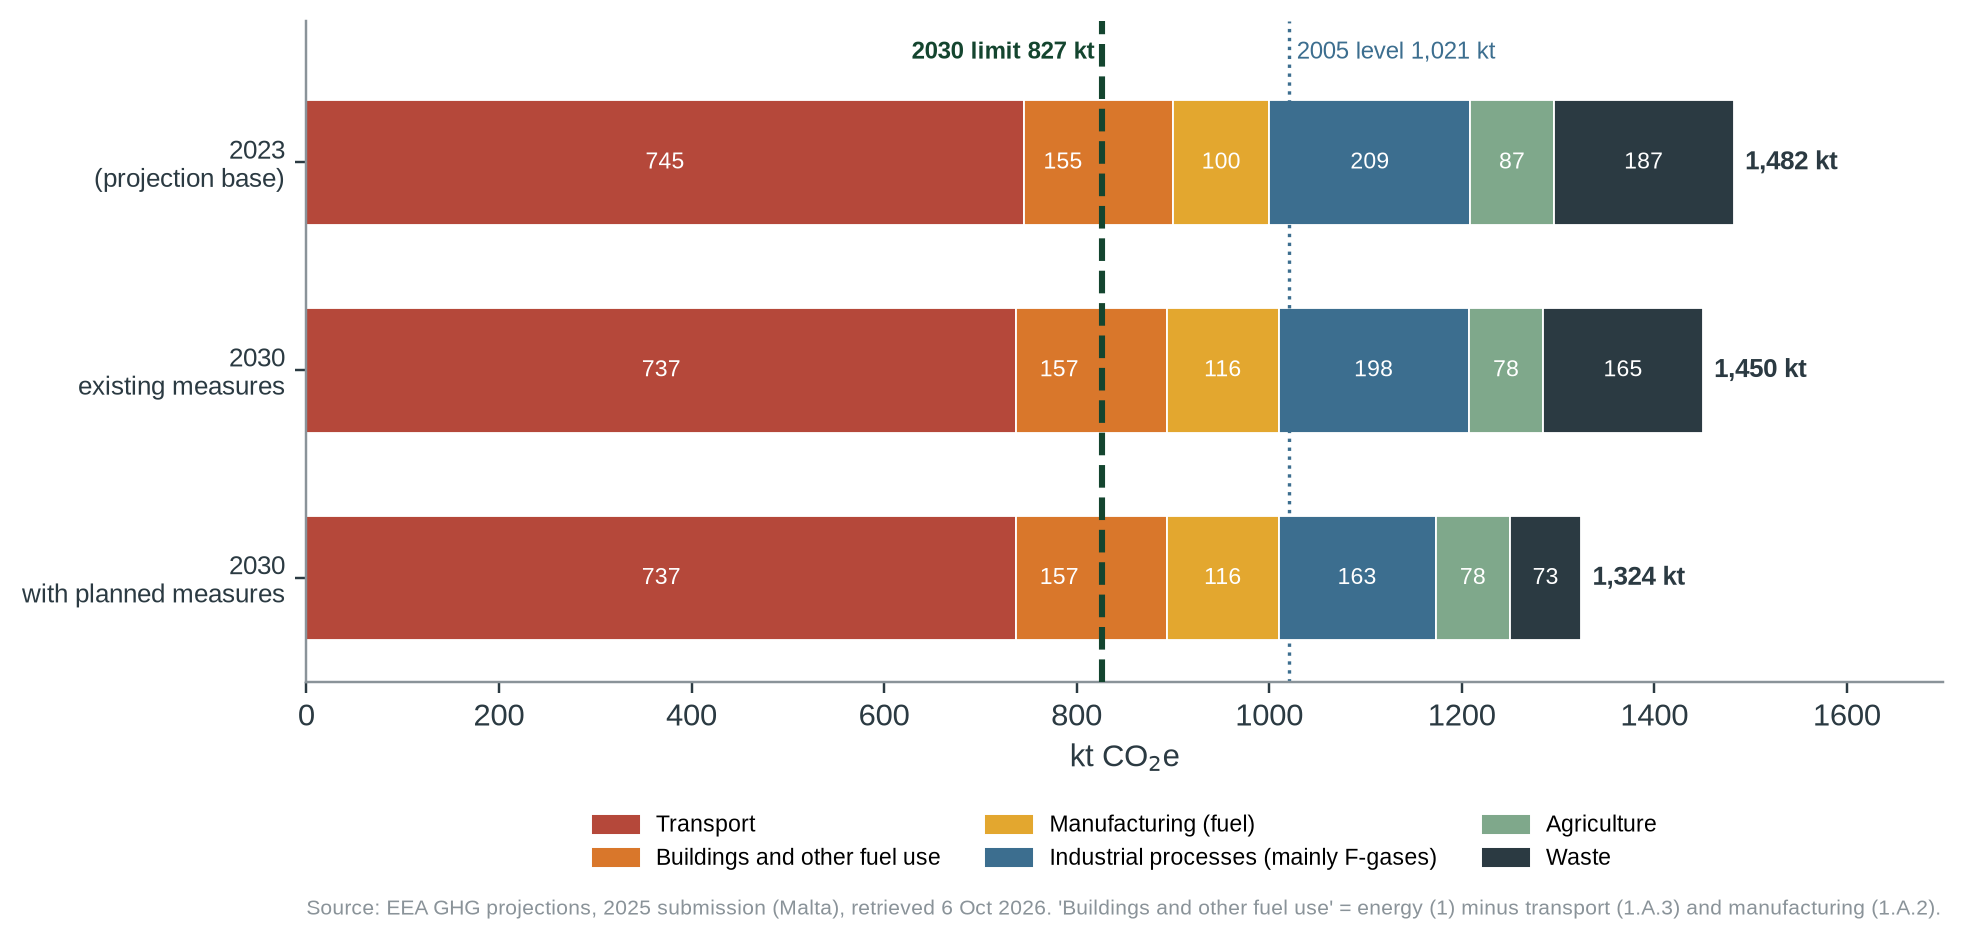
Transport is half of Malta’s effort-sharing emissions (745 kt in 2023) and is projected at 737 kt in 2030 in both scenarios [4]; a peer-reviewed scenario study describes Malta’s high dependence on private cars [16]. The two projections differ only in waste (165 kt with existing measures, 73 kt with planned ones: landfill gas capture, which Malta’s plan describes [12]) and industrial gases (198 and 163 kt). Buildings, manufacturing fuel and agriculture are the same in both. The Commission’s assessment of the plan found “insufficient details” on how Malta will meet the target and noted that the projections leave out the new trading system for buildings and road fuel (ETS2) [13].
Is Malta’s gap among the largest?
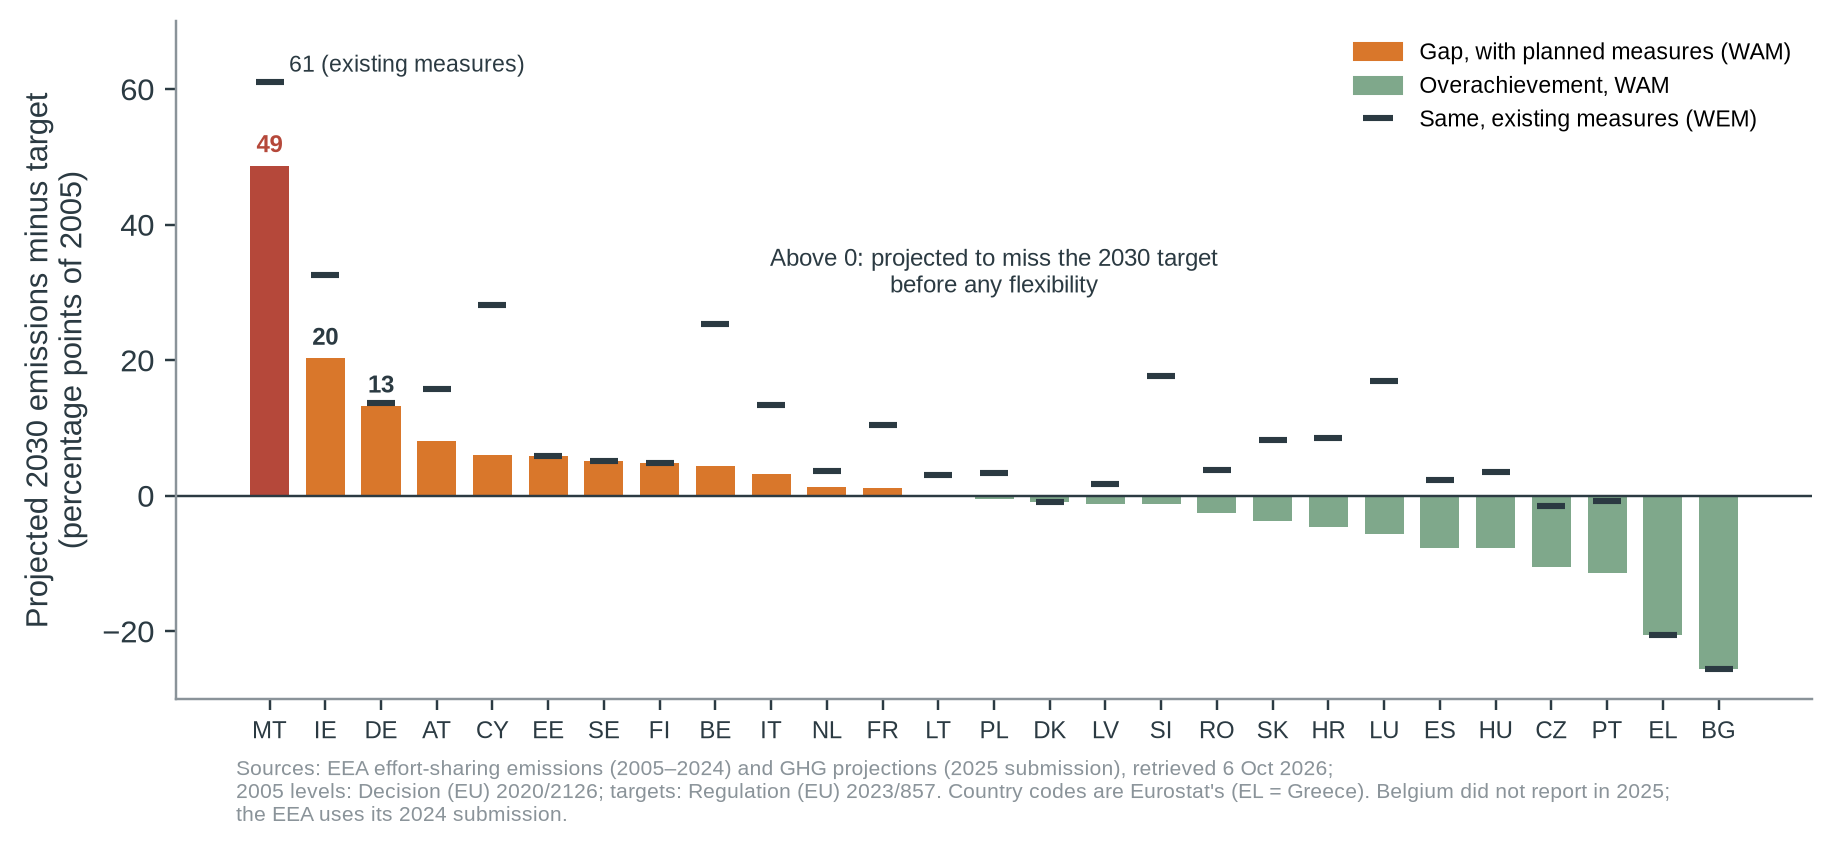
We recomputed the gap for all 27 Member States from the same projections, the legal 2005 levels and the 2030 targets [4, 6, 7]. The Commission does not say which projection its ranking uses; we read it as planned measures, which its section discusses. On that basis the largest gaps are Malta (48.7 points), Ireland (20.3) and Germany (13.2), then Austria (8.0), and the largest overachievement is Bulgaria (25.6 points), Greece (20.6) and Portugal (11.4): the countries the Commission names. With existing measures Malta is still first (61.1) and Ireland second (32.5), but Germany (13.6) falls to eighth, behind Cyprus, Belgium, Slovenia, Luxembourg and Austria. In tonnes, the largest gaps are Germany (64.1 Mt), Italy (10.9) and Ireland (9.7); Malta’s is 0.5 Mt, tenth. Belgium did not report in 2025, so its figures are from 2024.
5 Flexibilities: does Malta miss its target?
The Commission’s first two sentences describe emissions before any flexibility. Its third applies banking, borrowing and the ETS flexibility. We added up Malta’s position over 2021–2030 with the adopted yearly limits [8], reviewed and approximated emissions for 2021–2024 [3] and the projections for 2025–2030 [4].
| Step, 2021–2030 total | Planned measures (WAM) | Existing measures (WEM) | Source |
|---|---|---|---|
| Yearly limits minus emissions, 2021–2025 (2025 projected) | −0.44 Mt | −0.44 Mt | [3, 4, 8] |
| …after the ETS flexibility (510.3 kt in all) | +0.07 Mt: covered | +0.07 Mt: covered | [9] |
| Yearly limits minus emissions, 2021–2030 | −2.09 Mt | −2.71 Mt | [3, 4, 8] |
| …after the ETS flexibility | −1.58 Mt | −2.20 Mt | [9] |
| …after the maximum land-use (LULUCF) credit, 0.03 Mt | −1.55 Mt | −2.17 Mt | [5] |
| As a share of the EU surplus the Commission expects (125–175 Mt) | 0.9–1.2% | 1.2–1.7% | [1] |
This reproduces the Commission’s finding: Malta is covered for 2021–2025, partly thanks to the 2021 surplus (740 kt, which exists only because of the one-off 774 kt adjustment), and has excess emissions in 2026–2030. Our −2.09 Mt matches the Commission’s own −2.1 Mt [2]; the yearly limits it then estimated for 2026–2030 match those adopted in April 2026 [8]. The land-use credit is small in law (0.03 Mt) and Malta’s land sector has produced almost none so far [1, 2]. Malta cannot use the EU’s safety reserve: its emissions exceeded its limits in 2013–2020 [10].
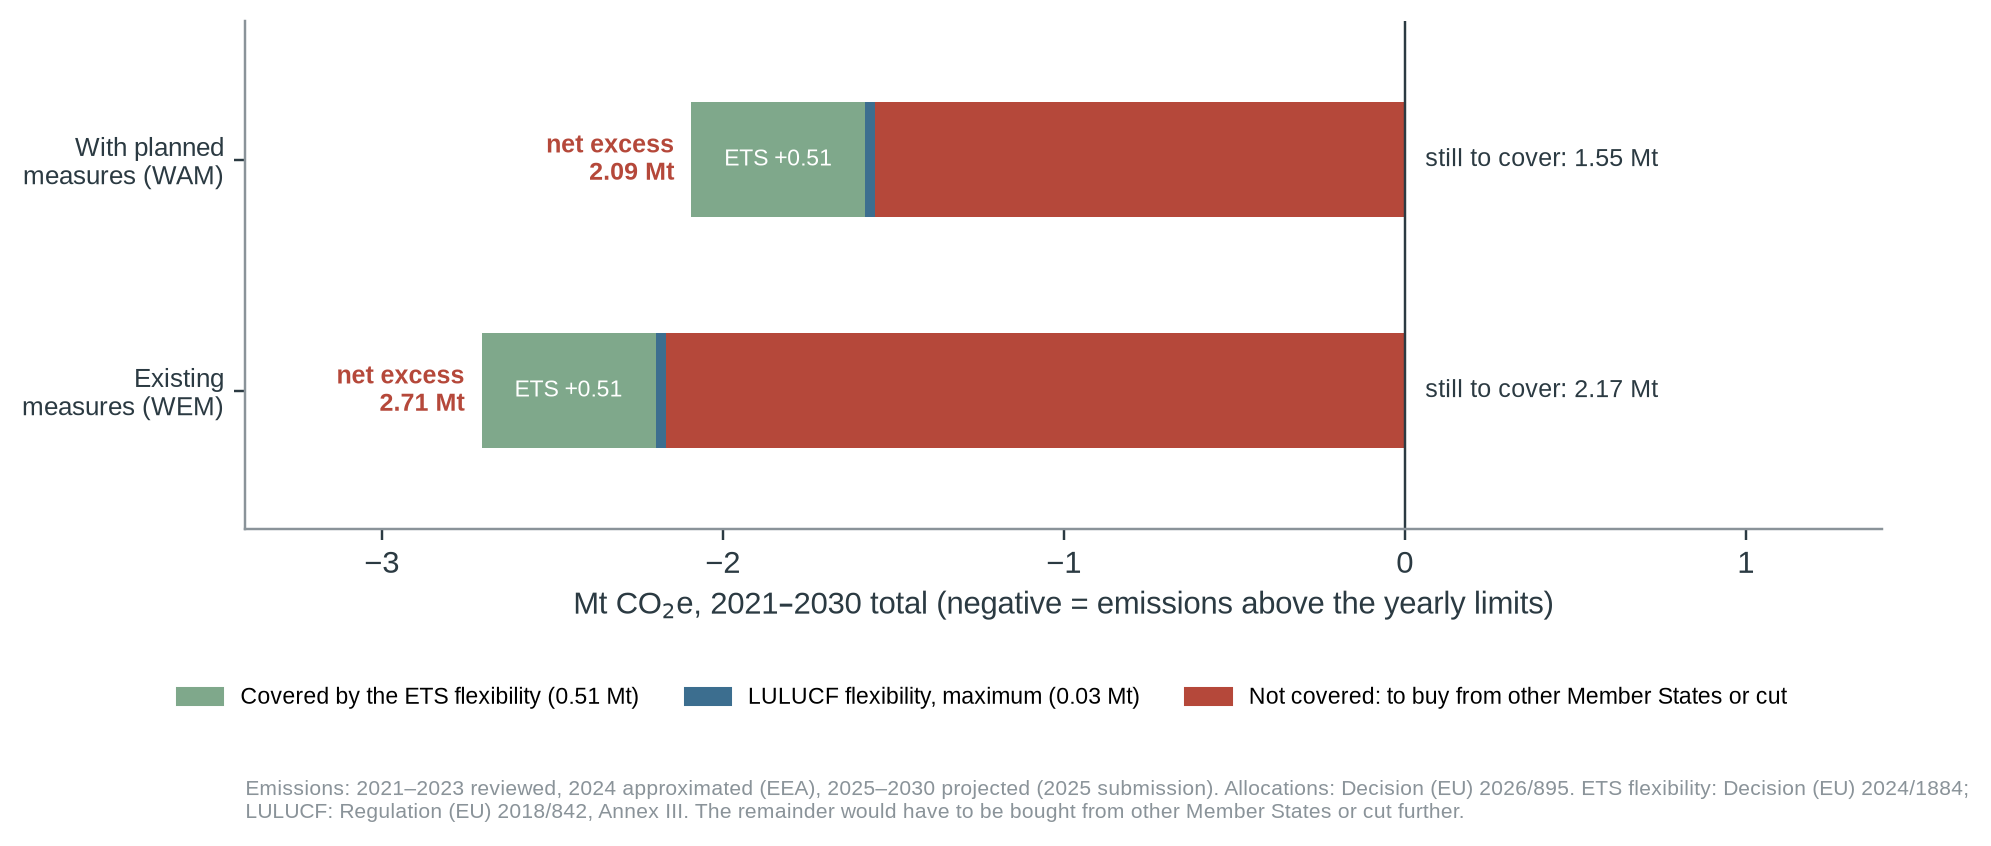
“Missing its target” (our claim list’s paraphrase): domestically, emissions miss the 2030 level by 0.5 Mt even with planned measures; legally, compliance can still be bought, about 1.6 Mt of allocations (2.2 Mt without the planned measures) from Member States with a surplus, as the regulation allows. Not rated. The price is not public, so we do not estimate the cost. The Commission’s wording (“gap”, “excess emissions”, “prior to any use of ESR flexibilities”) keeps the two apart.
6 Where the evidence points different ways
Q1 Is a projection a fair basis for saying Malta “is projected to emit more”?
YES, AS WORDEDEVIDENCE FOR THE CLAIM'S IMPRESSION
The Commission says Malta “is projected to” emit more, which is what Malta’s own projections show [4]. Measured emissions agree: 41% above 2005 in 2024 (approximated), over the yearly limit for three years running [3, 8].
EVIDENCE AGAINST
Projections can be wrong. Malta’s started 2.6% above the reviewed 2023 value, its 2024 emissions came in 3.3% below the projection, and ETS2 is not modelled [13]. A new projection is due in 2027.
Q2 Is the −19% target a fair yardstick for Malta?
CONTEXT; NOT TESTEDEVIDENCE FOR THE CLAIM'S IMPRESSION
The target is binding law, unchanged since 2018 [5, 6]. Malta’s own plan states the 826.7 kt limit and calls flexibilities “crucial” to meet it [12].
EVIDENCE AGAINST
Malta’s plan says the target rests on 2005 projections that “differ markedly from today’s reality, particularly in terms of population growth” [12]; in fact the −19% was set in 2018 on the basis of GDP per capita (recital (19) of Regulation 2023/857), and 2005 is only the base year [5, 6]. Population grew 41% from 2005 to 2024 [15]; effort-sharing emissions per person were 2.53 t in both years. EU lawmakers accepted that Malta’s target is “significantly above its cost-effective reduction potential” and raised its ETS flexibility to 7% [6].
Q3 Does “missing its target” overstate the Commission?
PARAPHRASE, NOT RATEDEVIDENCE FOR THE CLAIM'S IMPRESSION
Domestic emissions are projected above the 2030 limit and above the yearly limits from 2026 on; Malta’s own flexibilities cover about a quarter of the excess with planned measures and a fifth without (section 5).
EVIDENCE AGAINST
Compliance can be bought: the expected EU surplus is about 80 to 113 times Malta’s shortfall, and the Commission says it cannot yet conclude that Member States, taken together, are not making sufficient progress [1].
7 Testing the claim
| Sub-claim | What the evidence shows | Rating |
|---|---|---|
| A. “Malta’s gap to target is 49 and 61 percentage points” | 48.7 (planned measures) and 61.1 (existing) from Malta’s March 2025 projections, the legal 2005 level and the −19% target [4, 6, 7]. | ACCURATE |
| B. “…exceeding its 19% reduction target. This means Malta is projected to emit more in 2030 than in 2005.” | +29.7% and +42.1% on 2005; above 2005 against every 2005 figure and if re-based on reviewed 2023 data (+26% and +38%) [3, 4]. | ACCURATE |
| C. Germany, Ireland and Malta show the largest projected 2030 gaps before flexibilities | With planned measures (our reading of the basis), in points: Malta 48.7, Ireland 20.3, Germany 13.2, Austria next at 8.0. Not so with existing measures (Germany eighth) or in tonnes (Malta 0.5 Mt) [4]. | ACCURATE |
| D. Malta projected to have excess emissions in 2026–2030 | Covered to 2025 after the ETS flexibility (+0.07 Mt); −1.58 Mt by 2030 (planned measures), −1.55 Mt with the maximum land-use credit [3–5, 8, 9]. | ACCURATE |
| E. “Missing its target” (our claim list’s paraphrase) | Not the Commission’s words. Domestically 0.5 Mt over in 2030; legally, compliance possible by buying about 1.6 Mt (1.2% or less of the EU surplus). No safety reserve for Malta [1, 10]. | NOT RATED (PARAPHRASE) |
The Commission’s reasoning. “Exceeding its 19% reduction target” is a compressed way of saying the gap is larger than the cut required. Because the gap is the projected change minus the target, a gap of more than 19 points means emissions above the 2005 level, so the second sentence follows from the first. Consistency with CC-003. CC-003 used the same Commission tables (+41% in 2024; +42% and +30% in 2030; −2.1 Mt by 2030) and its own estimate of effort-sharing emissions per person (2.50 t to 2.52 t). Here we use the EEA’s official series and the legal 2005 level (2.53 t in both years); the conclusions are the same [17].
8 Verdict and requests for evidence
The Commission’s figures and its inference reproduce from Malta’s own reported projections, the EEA’s data and the legal 2005 level. Confidence: high.
Why. (1) The 49 and 61 points reproduce from Malta’s projections as held by the EEA, the 2005 level and the target in EU law. (2) “More in 2030 than in 2005” holds under both projections and every 2005 figure we found; 2024 emissions (approximated) were already 41% above 2005. (3) The ranking and the 2026–2030 excess reproduce under the Commission’s stated assumptions, and its words are conditioned on flexibilities that, by our ledger, do not close the gap. Confidence is high: the projections, reviewed emissions, legal texts, the Commission’s tables and Malta’s plan all agree.
What this verdict does not say. That Malta will fail its legal obligations (it can buy allocations), whether the −19% target is fair to Malta, or anything about anyone’s intentions.
Evidence we are asking for
- From the Ministry for the Environment and the Climate Action Authority: how Malta intends to cover its 2026–2030 excess (purchases of allocations, from whom, at what cost), which its plan does not quantify.
- Malta’s approximated 2025 effort-sharing emissions and its 2027 projection update, when submitted.
- A quantified estimate of ETS2’s effect on Malta’s transport and buildings emissions, which the Commission says the projections leave out.
9 Limitations
- Projections are Malta’s March 2025 submission as quality-checked by the EEA (we did not see Malta’s own files); the next are due in 2027. 2024 emissions are approximated; 2025 figures were not yet in the EEA datastore on 6 October 2026.
- Our 2021–2030 balance treats the ETS flexibility as usable when needed, as the Commission does; in law it is cancelled in yearly instalments, which does not change the total.
- Whether and at what price Malta will buy allocations is not public; we do not estimate the cost.
- No peer-reviewed study of Malta’s effort-sharing gap was found; this check rests on official data and law (grade C).
References
- [1] European Commission (6 Nov 2025). EU Climate Action Progress Report 2025. COM(2025) 668 final, pp. 30–31. Read in full for Malta via the EU Publications Office, 6 Oct 2026 (EUR-Lex refused scripts). https://eur-lex.europa.eu/legal-content/EN/TXT/HTML/?uri=CELEX%3A52025DC0668
- [2] European Commission (Nov 2025). Climate Action Progress Report 2025, staff working document SWD(2025) 347: Table 25 (p. 114), Table 26 (p. 125), p. 111, Table 27 (p. 131). https://climate.ec.europa.eu/document/download/35f83a2d-f77d-4895-b616-d579069b23d3_en?filename=capr2025_swd_en.pdf
- [3] European Environment Agency. Greenhouse gas emissions under the Effort Sharing Legislation, 2005–2024 (sheet dated 4 Nov 2025). Retrieved 6 Oct 2026. https://sdi.eea.europa.eu/catalogue/srv/api/records/f80bebef-447e-4882-b3e9-c4a91cbae4f5
- [4] European Environment Agency. Member States’ greenhouse gas (GHG) emission projections 2025. doi:10.2909/d6938865-05e5-4016-a15c-a09bb898421d. Retrieved 6 Oct 2026. https://doi.org/10.2909/d6938865-05e5-4016-a15c-a09bb898421d
- [5] Regulation (EU) 2018/842 (Effort Sharing Regulation), Articles 4–11 and Annexes II–IV. OJ L 156, 19.6.2018, p. 26. https://data.europa.eu/eli/reg/2018/842/oj
- [6] Regulation (EU) 2023/857 amending Regulation (EU) 2018/842, recitals and Annex. OJ L 111, 26.4.2023, p. 1. https://data.europa.eu/eli/reg/2023/857/oj
- [7] Commission Implementing Decision (EU) 2020/2126, Annex I (2005 values). OJ L 426, 17.12.2020, p. 58. https://data.europa.eu/eli/dec_impl/2020/2126/oj
- [8] Commission Implementing Decision (EU) 2026/895 of 24 April 2026 (annual emission allocations 2021–2030, as replaced; 2023–2025 first set by Decision (EU) 2023/1319). https://data.europa.eu/eli/dec_impl/2026/895/oj
- [9] Commission Implementing Decision (EU) 2024/1884 (ETS flexibility: Malta 510,300 t). https://data.europa.eu/eli/dec_impl/2024/1884/oj
- [10] Commission Decision (EU) 2023/863 (safety reserve), recital (5). https://data.europa.eu/eli/dec/2023/863/oj
- [11] European Commission. Effort sharing 2021–2030: targets and flexibilities (web page). Read 6 Oct 2026. https://climate.ec.europa.eu/areas-action/carbon-removals-and-carbon-farming/effort-sharing-member-states-emission-targets/effort-sharing-2021-2030-targets-and-flexibilities_en
- [12] Government of Malta (Dec 2024; submitted 7 Jan 2025). Final updated National Energy and Climate Plan 2021–2030, pp. 54–58, 138 and 327–329 (Commission copy). https://commission.europa.eu/publications/malta-final-updated-necp-2021-2030-submitted-2025_en
- [13] European Commission (2025). Assessment of the final updated NECPs, SWD(2025) 140, Malta extract, pp. 160–162. https://commission.europa.eu/document/download/bf1c1e17-293c-4c50-92ca-1ae663ab6cae_en?filename=MT_Extract_SWD+2025_140.pdf
- [14] European Environment Agency. NECPR: progress to targets for GHG emissions and removals (Annex I), 2025. Retrieved 6 Oct 2026 (Malta’s reported 2023 effort-sharing emissions). https://sdi.eea.europa.eu/catalogue/srv/api/records/fb3f4e09-0318-400d-beae-f1082153b2bb
- [15] Eurostat. nama_10_pe, population (as retrieved for CC-003, 2 Oct 2026). https://ec.europa.eu/eurostat/databrowser/view/nama_10_pe/default/table
- [16] Camilleri R., Attard M., Hickman R. (2024). Participatory Policy Packaging for Transport Backcasting: A Pathway for Reducing CO2 Emissions from Transport in Malta. Sustainability 16(1):430. doi:10.3390/su16010430. (Abstract read; context.) https://doi.org/10.3390/su16010430
- [17] Miżien. Claim Check 003: per-capita emissions vs the 2030 projection (v1.2, 5 Oct 2026). https://github.com/leandergrech/Mizien/tree/main/claims/CC-003
- [18] Miżien. Data and calculations: data/cc-094/; tools/cc-094-report/calc.py.
Appendix A: series standards and verdict scale
Every investigation in this series follows the same rules so that verdicts are comparable and challengeable.
| Verdict | Meaning |
|---|---|
| SUPPORTED | Evidence consistently backs the claim as stated. |
| LARGELY SUPPORTED | Backed by the evidence, with minor caveats that do not change the substance. |
| NOT SUBSTANTIATED | Stated more strongly than the evidence offered or available allows. May be true in some conditions but has not been shown. |
| MISLEADING | Omits material facts so that the overall impression is inaccurate, even if individual statements are defensible. |
| CONTRADICTED | The available evidence points against the claim. |
Confidence
High: multiple independent lines of evidence agree. Moderate: evidence is relevant but incomplete or indirect. Low: evidence is thin, second-hand or conflicting.
Evidence grades
A experiment · B observational study with a control or gradient · C review, guidance, official statistics or legal text · D assertion or anecdote. ◆ marks a source known only second-hand.
Standards
- Quote the speaker, not the headline, with outlet and date, and link the original where possible.
- Separate the claim from the evidence offered for it, and say who made which statement.
- Grade the evidence and show differing views side by side where the evidence is unsettled.
- State what we could not access or verify, and what would change the verdict either way.
- Ask for the missing evidence in specific, answerable requests.
- Offer a right of reply where a check finds a claim Not substantiated, Misleading or Contradicted (or a pledge Not measurable, Off track or Missed), before wider circulation, and append responses.
- Correct errors openly with a version number and change log.
- Whistle-blow only on evidence: a verdict of Misleading or Contradicted requires documents or data that can be shown, not inference.
- Check every side. Government, opposition, NGOs and developers are held to the same standard.
Appendix B: revision log
| Version | Date | Change |
|---|---|---|
| 1.0 | 6 Oct 2026 | First issue. No right of reply needed for a Supported verdict. |
Sources and archived copies
-
EU Climate Action Progress Report 2025, COM(2025) 668 final, European Commission (EUR-Lex), 6 Nov 2025.
Original · fetched and fingerprinted 2026-10-10; no public snapshot yet
The claim: note to Figure 13 and section 3.2, printed pp. 30-31. EUR-Lex refused scripts (HTTP 202, empty); read in full for Malta from the EU Publications Office copies (XHTML and PDF, https://publications.europa.eu/resource/celex/52025DC0668) on 6 Oct 2026. PDF in literature/CC-094/open-access/. -
Climate Action Progress Report 2025, Commission Staff Working Document SWD(2025) 347, European Commission, Nov 2025.
Original · fetched and fingerprinted 2026-10-10; no public snapshot yet
Table 25 (p. 114) assigns 49 to planned and 61 to existing measures; Table 26 (p. 125) Malta's 2021-2030 balance. -
Greenhouse gas emissions under the Effort Sharing Legislation, 2005-2024; Member States' GHG emission projections 2025, European Environment Agency, Nov 2025; Apr 2026.
Original · fetched and fingerprinted 2026-10-10; no public snapshot yet
Primary evidence. Retrieved 6 Oct 2026 from the EEA datastore (data/cc-094/). -
Implementing Decision (EU) 2026/895 (annual emission allocations 2021-2030); Implementing Decisions (EU) 2020/2126 and 2024/1884; Regulations (EU) 2018/842 and 2023/857, EU Official Journal, 2018-2026.
Original · fetched and fingerprinted 2026-10-10; no public snapshot yet
The 2005 level (1,020,601 t), the -19% target, Malta's yearly limits and flexibilities. Read via the Publications Office, 6 Oct 2026. -
Malta's final updated National Energy and Climate Plan 2021-2030 (Commission copy), Government of Malta, Dec 2024 (submitted 7 Jan 2025).
Original · fetched and fingerprinted 2026-10-10; no public snapshot yet
The government's view of the target (pp. 54-58). Read 6 Oct 2026.
Right of reply
Not needed: this check finds the claim supported. A right of reply is sought when a check finds a claim Not substantiated, Misleading or Contradicted.
Connections
How this claim relates to the others: who made it, the themes it shares with other claims, and the patterns it shows. A connection is a reason to read two checks side by side. It does not make either one right or wrong. How connections are found.
Who made it
Other claims by European Commission 10
- CC-005 “92% excellent” bathing water (Supported)
- CC-101 EU: no registration or prior authorisation of water abstraction in Malta (Largely supported)
- CC-109 EU: transport is 48% of effort-sharing emissions (Largely supported)
- CC-110 EU: 37.7% of new cars zero-emission (Supported)
- CC-111 EU: 621 kg of waste a head, 74% landfilled (Supported)
- CC-117 EU: Malta missed recycling targets (reasoned opinion) (not yet checked)
- CC-125 EU: Malta Social Climate Plan EUR 60.6 million (not yet checked)
- CC-127 EU: Malta has the lowest organic share in the EU (not yet checked)
- CC-128 EU: Malta missed the water-plan timetable (not yet checked)
- CC-129 EU: Malta has not updated its air pollution programme (not yet checked)
Linked directly 3
Claims that share a theme with this one. A theme is a cause, a mechanism, a target or a way of presenting figures that the editors have found in several claims; its strength says how close the link is.
2030 carbon target Shared target · Weak (indicative)
The Climate Action Authority and the 2026 Labour manifesto (priority 18) both state a 40% cut in carbon emissions by 2030 against 2005, without saying whether it covers total or effort-sharing emissions.
Two steps away 13
Not linked to this claim directly, but linked to a claim that is. These are found by following the links, not chosen by the editors, so they are looser: they show where one theme meets another.
- CC-004 'Strong progress' in waste separation (Not substantiated)through 2030 carbon targetCC-003Selective-metric pattern
- CC-007 Within EU limits vs WHO guideline (Largely supported)through 2030 carbon targetCC-003Transport, air and climate
- CC-008 Flyovers and congestion (Not substantiated)through 2030 carbon targetCC-003Transport, air and climate or 2030 carbon targetCC-109Transport, air and climate
- CC-010 Tree-planting counts (Largely supported)through 2030 carbon targetCC-003Selective-metric pattern
- CC-011 Ten minutes' walk to green space (pledge: Not measurable)through 2030 carbon targetCC-0032030 carbon target
- CC-016 Shore-to-ship: 90% less harbour pollution (Misleading)through 2030 carbon targetCC-003Transport, air and climate
- CC-021 Malta-Gozo tunnel traffic (not yet checked)through 2030 carbon targetCC-003Transport, air and climate
- CC-025 Per-capita emissions down 44% since 2005 (Largely supported)through 2030 carbon targetCC-0032030 carbon target or 2030 carbon targetCC-114Selective-metric pattern
- CC-026 EU's largest rise in emissions (Largely supported)through 2030 carbon targetCC-003Transport, air and climate or 2030 carbon targetCC-114Shared emissions figures
- CC-031 Gozo, first climate-neutral region (Largely supported)through 2030 carbon targetCC-109Shared emissions figures
- CC-072 EUR 15m to take cars off the road (not yet checked)through 2030 carbon targetCC-109Transport, air and climate
- CC-110 EU: 37.7% of new cars zero-emission (Supported)through 2030 carbon targetCC-109Transport, air and climate
- CC-115 Chamber: congestion cost EUR 770m, 3.4% of GDP (Not substantiated)through 2030 carbon targetCC-109Transport, air and climate
Three steps away 23
One step further again. At this distance a connection says more about how the themes fit together than about this claim.
- CC-001 Upper Barrakka concrete (Not substantiated)through 2030 carbon targetCC-003Transport, air and climateCC-008Sealed soil and concrete
- CC-002 Comino tree compensation (Largely supported)through 2030 carbon targetCC-003Selective-metric patternCC-004Waste and construction
- CC-012 Ta' Qali gravel and grass (Contradicted)through 2030 carbon targetCC-003Transport, air and climateCC-008Sealed soil and concrete
- CC-017 Land reclamation outside the Freeport (Not substantiated)through 2030 carbon targetCC-003Selective-metric patternCC-004Waste and construction
- CC-019 830,000 m2 of land lost in five years (Not substantiated)through 2030 carbon targetCC-003Transport, air and climateCC-008Sealed soil and concrete
- CC-020 EP study: noise law not the cause (Largely supported)through 2030 carbon targetCC-003Transport, air and climateCC-007Compliance-not-health pattern
- CC-022 'Lowest electricity burden in the EU' (Largely supported)through 2030 carbon targetCC-0032030 carbon targetCC-025Selective-metric pattern
- CC-024 Renewables target for 2030 (Not substantiated)through 2030 carbon targetCC-0032030 carbon targetCC-0112030 carbon target
- CC-033 Delimara: 'much cleaner air' (not yet checked)through 2030 carbon targetCC-003Transport, air and climateCC-007Compliance-not-health pattern
- CC-035 PM2.5 death rate down two-thirds (Largely supported)through 2030 carbon targetCC-003Transport, air and climateCC-007Transport, air and climate
- CC-054 Project Green: 100,000 m2 a year (not yet checked)through 2030 carbon targetCC-003Selective-metric patternCC-010Replanting as currency
- CC-056 Central Link: 'only 254 trees' (not yet checked)through 2030 carbon targetCC-003Transport, air and climateCC-008Replanting as currency
- CC-057 1,649 compensation trees (not yet checked)through 2030 carbon targetCC-003Selective-metric patternCC-010Replanting as currency
- CC-069 82 million bus trips (not yet checked)through 2030 carbon targetCC-003Transport, air and climateCC-008Transport, air and climate
- CC-071 EUR 100m a year for free buses (Not substantiated)through 2030 carbon targetCC-109Transport, air and climateCC-072Transport, air and climate
- CC-075 Seventh in the EU for cars (Misleading)through 2030 carbon targetCC-109Transport, air and climateCC-110Transport, air and climate
- CC-076 36 more vehicles a day (Supported)through 2030 carbon targetCC-003Transport, air and climateCC-008Transport, air and climate
- CC-079 Waste-to-energy: 4.5% of energy (Misleading)through 2030 carbon targetCC-003Selective-metric patternCC-004Waste and construction
- CC-081 Landfill share rising (not yet checked)through 2030 carbon targetCC-003Selective-metric patternCC-004Waste and construction
- CC-092 PN: afforestation in a net-zero Gozo (pledge: Not measurable)through 2030 carbon targetCC-109Shared emissions figuresCC-031Net-zero Gozo
- CC-107 A net-zero Gozo by 2040 (pledge: Not measurable)through 2030 carbon targetCC-109Shared emissions figuresCC-031Net-zero Gozo
- CC-111 EU: 621 kg of waste a head, 74% landfilled (Supported)through 2030 carbon targetCC-003Selective-metric patternCC-004Waste and construction
- CC-117 EU: Malta missed recycling targets (reasoned opinion) (not yet checked)through 2030 carbon targetCC-003Selective-metric patternCC-004Waste and construction
Similar wording
Claims whose own words overlap with this one, with the words they share. Found by comparing the wording of the claims, not their verdicts; a lead to read them together, not a finding.
- CC-109 EU: transport is 48% of effort-sharing emissions (Largely supported)shares: sharing, effort, emissions
Timeline
What was said, what was published before and after it, and each step of this check, in date order. Statements and sources carry the date they were published. The steps of the check carry the date the research was done, from the check's research log. Other statements by the same body on the same topic show whether a position was repeated, changed or corrected.
2018
- 30 May 2018 Evidence published Regulation (EU) 2018/842 (Effort Sharing Regulation), EU Official Journal
2020
- 16 December 2020 Evidence published Commission Implementing Decision (EU) 2020/2126 (annual emission allocations 2021-2030; 2005 values), EU Official Journal
2023
- 19 April 2023 Evidence published Regulation (EU) 2023/857 amending the Effort Sharing Regulation, EU Official Journal
- 26 April 2023 Evidence published Commission Decision (EU) 2023/863 (effort-sharing safety reserve), EU Official Journal
- 28 June 2023 Evidence published Commission Implementing Decision (EU) 2023/1319 (revised allocations 2023-2025), EU Official Journal
2024
- 2024 Evidence published Participatory Policy Packaging for Transport Backcasting: A Pathway for Reducing CO2 Emissions from Transport in Malta (Camilleri, Attard, Hickman), Sustainability (MDPI)
- 10 July 2024 Evidence published Commission Implementing Decision (EU) 2024/1884 (ETS flexibility quantities), EU Official Journal
2025
- May 2025 Evidence published Assessment of the final updated NECPs, SWD(2025) 140: Malta extract, European Commission
- 2025 Statement published EU Climate Action Progress Report 2025, EUR-Lex
- 6 November 2025 The statement European Commission (this claim)
- November 2025 Evidence published Climate Action Progress Report 2025, Commission Staff Working Document, European Commission
2026
- 24 April 2026 Evidence published Commission Implementing Decision (EU) 2026/895 (annual emission allocations 2026-2030), EU Official Journal
- 29 July 2026 Later statement by European Commission on Climate & Energy CC-125 EU: Malta Social Climate Plan EUR 60.6 million (not yet checked)
- 4 October 2026 Added to the claims to check
- 6 October 2026 Check started Check started. EUR-Lex refused scripts (HTTP 202, empty body) and the Wayback Machine had no copy; the Commission's CAPR page download hit a bot check.
- 6 October 2026 Exact wording found Verbatim wording found in COM(2025) 668 final, read in full for Malta from the EU Publications Office (XHTML and PDF): note to Figure 13 and section 3.2, printed pp. 30-31. The claim text was restated from the Commission's words; 'missing its target' was the intake's paraphrase.
- 6 October 2026 Note EEA effort-sharing emissions (2005-2024) and 2025 projections downloaded from the EEA datastore; Regulations (EU) 2018/842 and 2023/857 and Implementing Decisions (EU) 2020/2126, 2023/1319, 2024/1884 and 2026/895 and Decision (EU) 2023/863 read via the Publications Office; Malta's NECP and the Commission's NECP assessment read. All figures recomputed in tools/cc-094-report/calc.py: gaps 48.7 and 61.1 points; 2021-2030 balance -2.09 Mt, -1.55 Mt after Malta's own flexibilities (planned measures).
- 6 October 2026 Note Internal review before first issue: title changed from 'Commission: Malta off track for 2030' (the Commission did not say 'off track', and its gap is before flexibilities); ranking with existing measures corrected (Germany eighth); figures typed in the report moved into calc.py; the NECP assessment's +29.4% labelled 'existing measures' noted against the March 2025 projections (WAM +29.7%, WEM +42.1%); the plan's '2005 forecasts' point set against the 2018 GDP-based target.
- 6 October 2026 Version 1.0: first issue First issue. No right of reply needed for a Supported verdict. Verdict in this version: Supported, high confidence.
- 6 October 2026 Evidence reviewed
2027
- 6 October 2027 Coming up: Evidence review due Each finished check is reviewed against new evidence within a year.
Every change to this claim's record is public: history of the record.
Download the report and flyer