CC-035 · Air · Air quality & health
PM2.5 death rate down two-thirds
Largely supported High confidence Draft: no right of reply needed
Parts of this claim
The claim is split into parts that are tested separately, as in the report below. Each part has its own number.
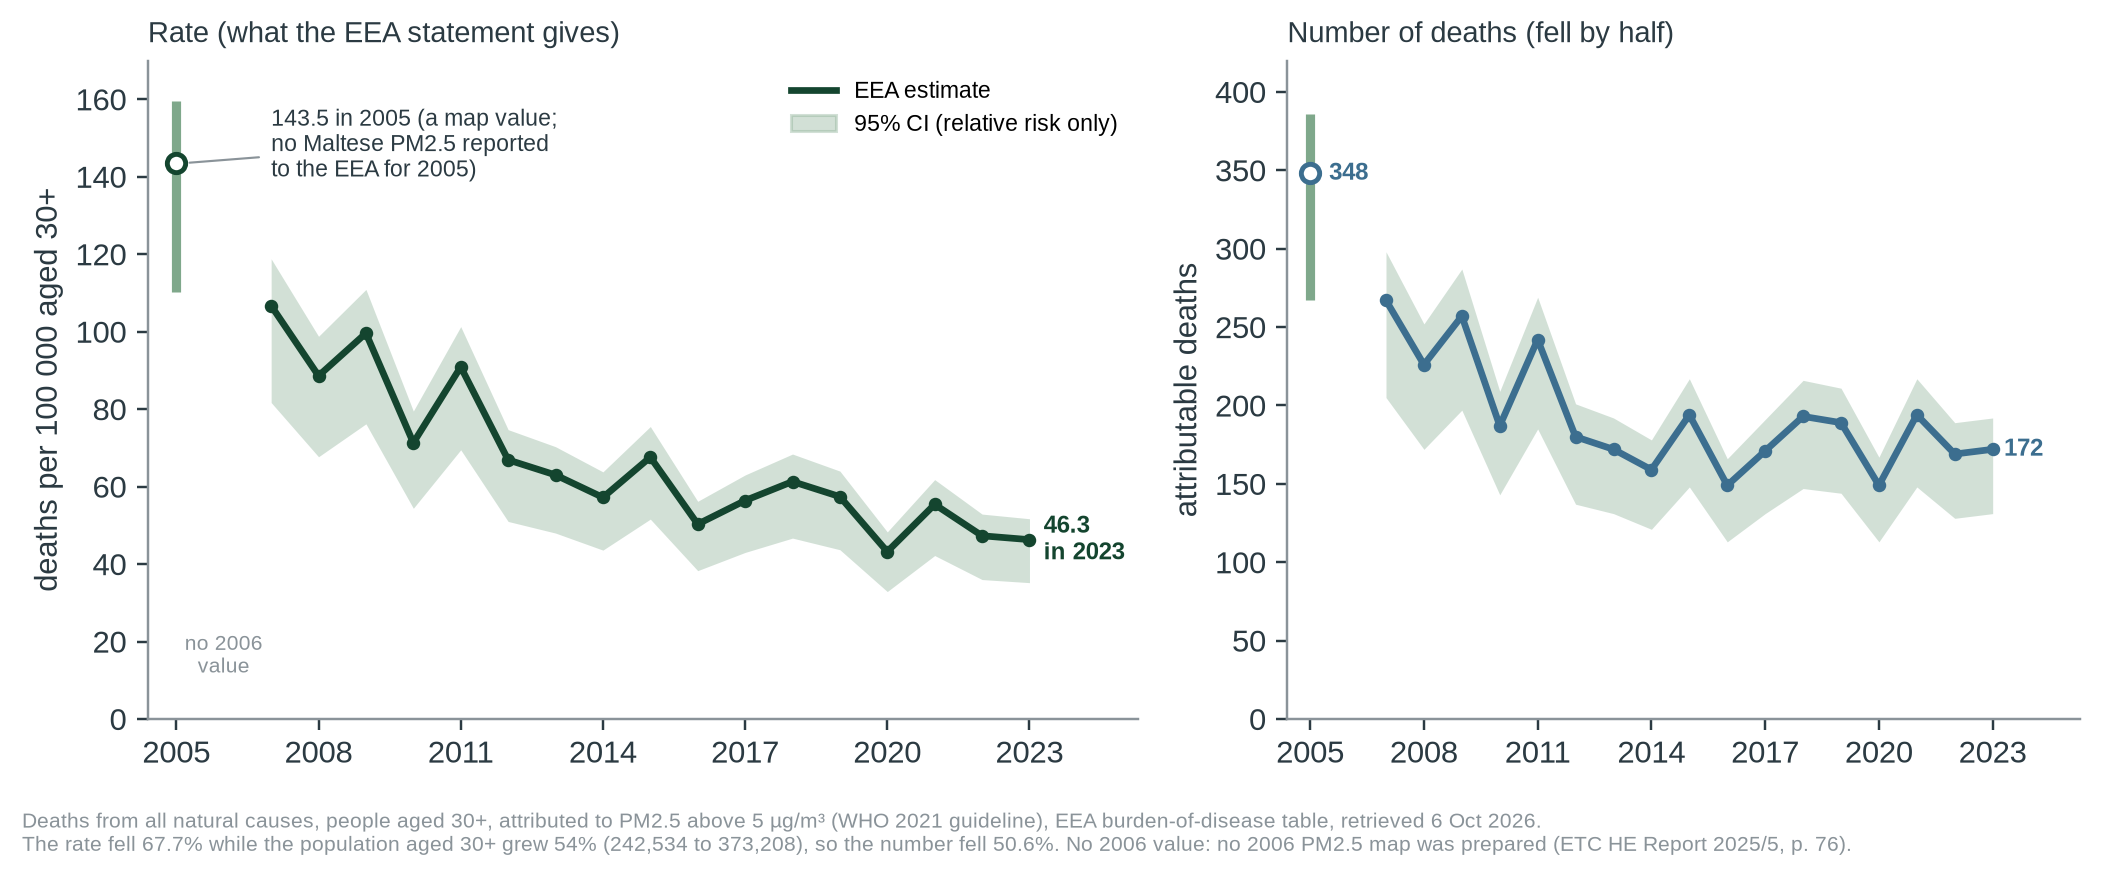
- CC-035A The rate was 143.5 per 100 000 aged 30+ in 2005EEA table: 143.5 (348 deaths, 242,534 people aged 30+) [2]; Eurostat: 348 deaths [3].
- CC-035B It was 46.3 in 2023EEA table and technical report: 46.3 (35.2–51.7) [2, 6].
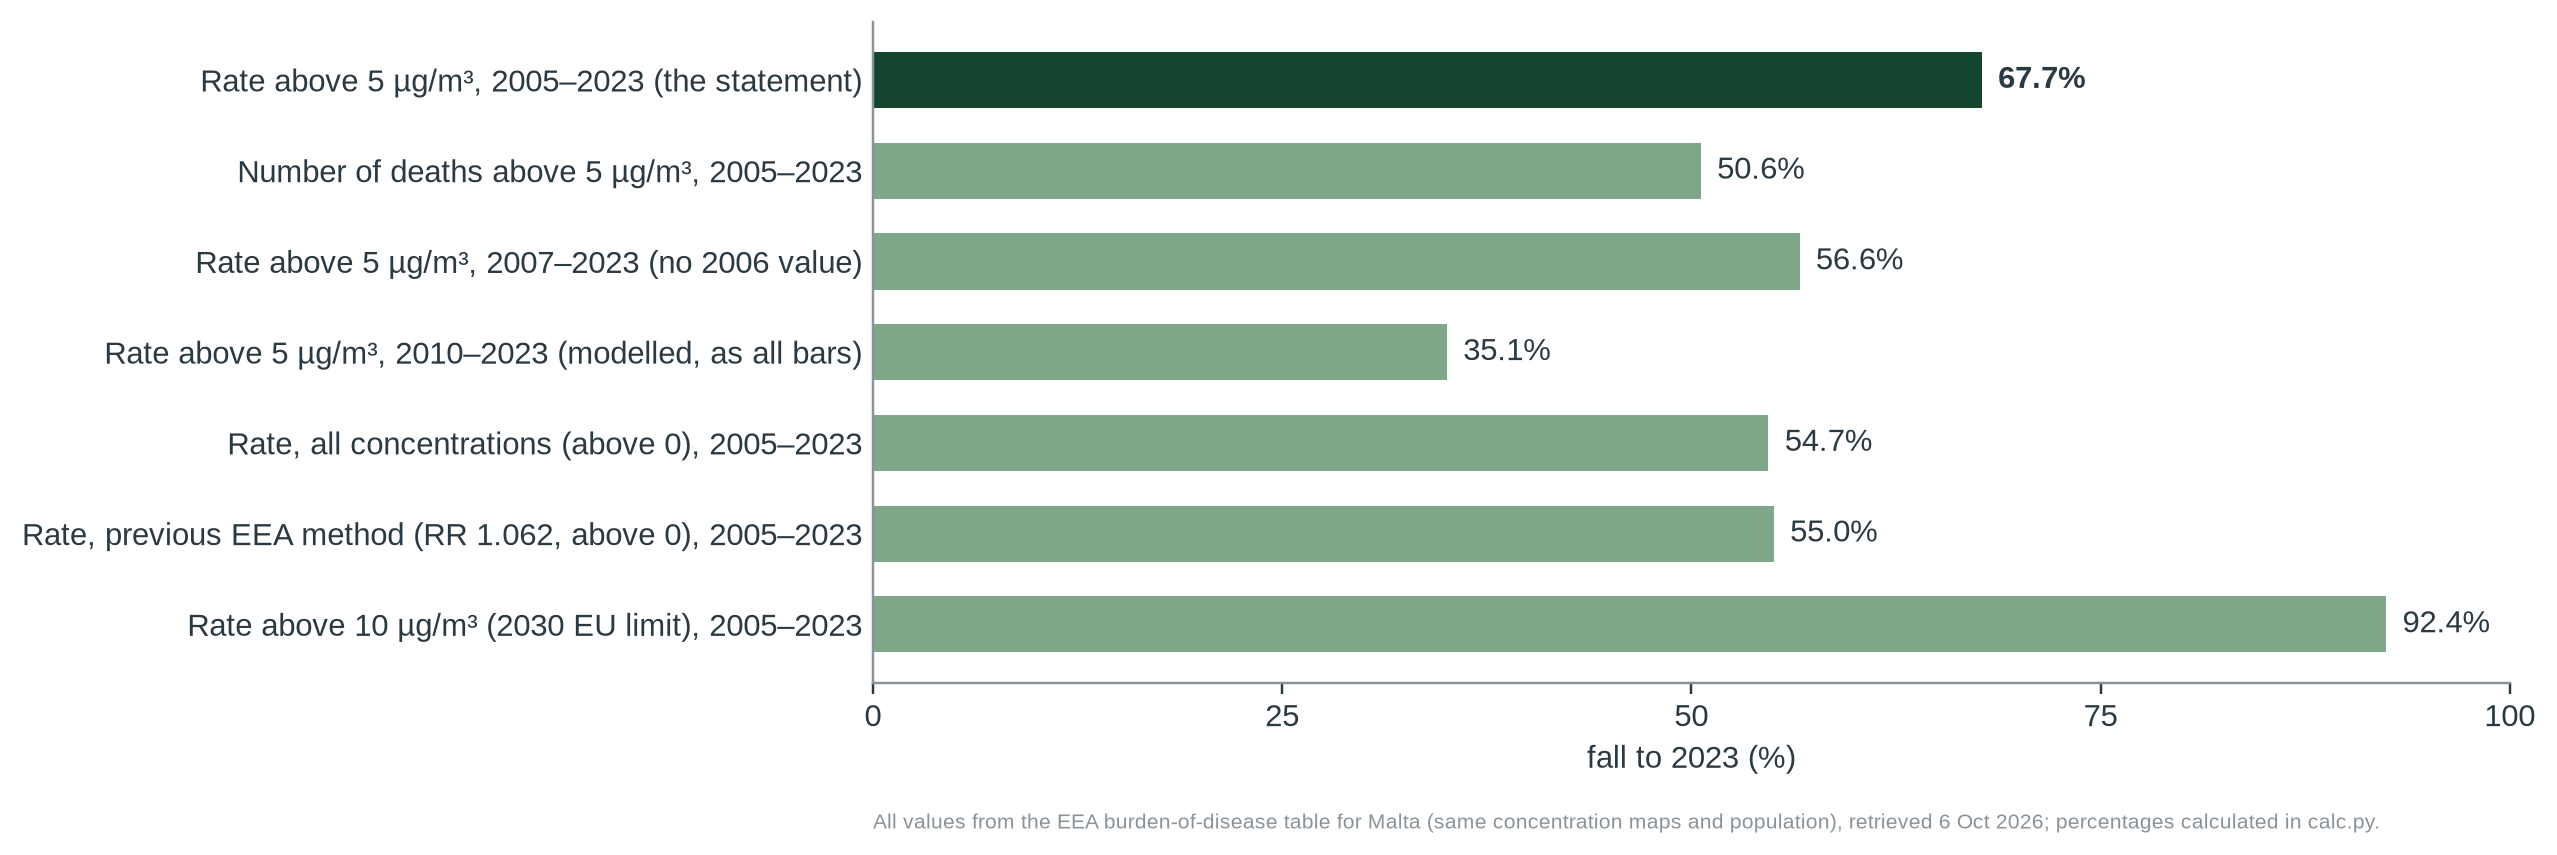
- CC-035C “reduced by 67.7% between 2005 and 2023”(143.5 − 46.3) / 143.5 = 67.74%. The 2005 value is a map value, from maps of another method and model, with no Maltese PM2.5 reported to the EEA [8, 10]; from 2007 the fall is 56.6%; the 95% CI covers the risk only [4].
- CC-035D “172 (95% CI: 131-192) attributable deaths in 2023”EEA table and Eurostat: 172 (131–192) [2, 3]. Technical report: 173 (132–193) [6]. The rate implies 172.8 deaths, but rounding does not explain the lower bound (35.2 → 131.4): a one-death difference, unexplained.
- CC-035E Natural deaths, long-term exposure above 5 µg/m³, people aged 30+Matches the documented method [4–6]; recomputed from Eurostat deaths within 1.2% (section 3).
Claim Check 035 · Air quality and health statistics
Did Malta’s PM2.5 death rate fall by two-thirds?
Testing the EEA’s own estimate against its data, its method and Malta’s station measurements
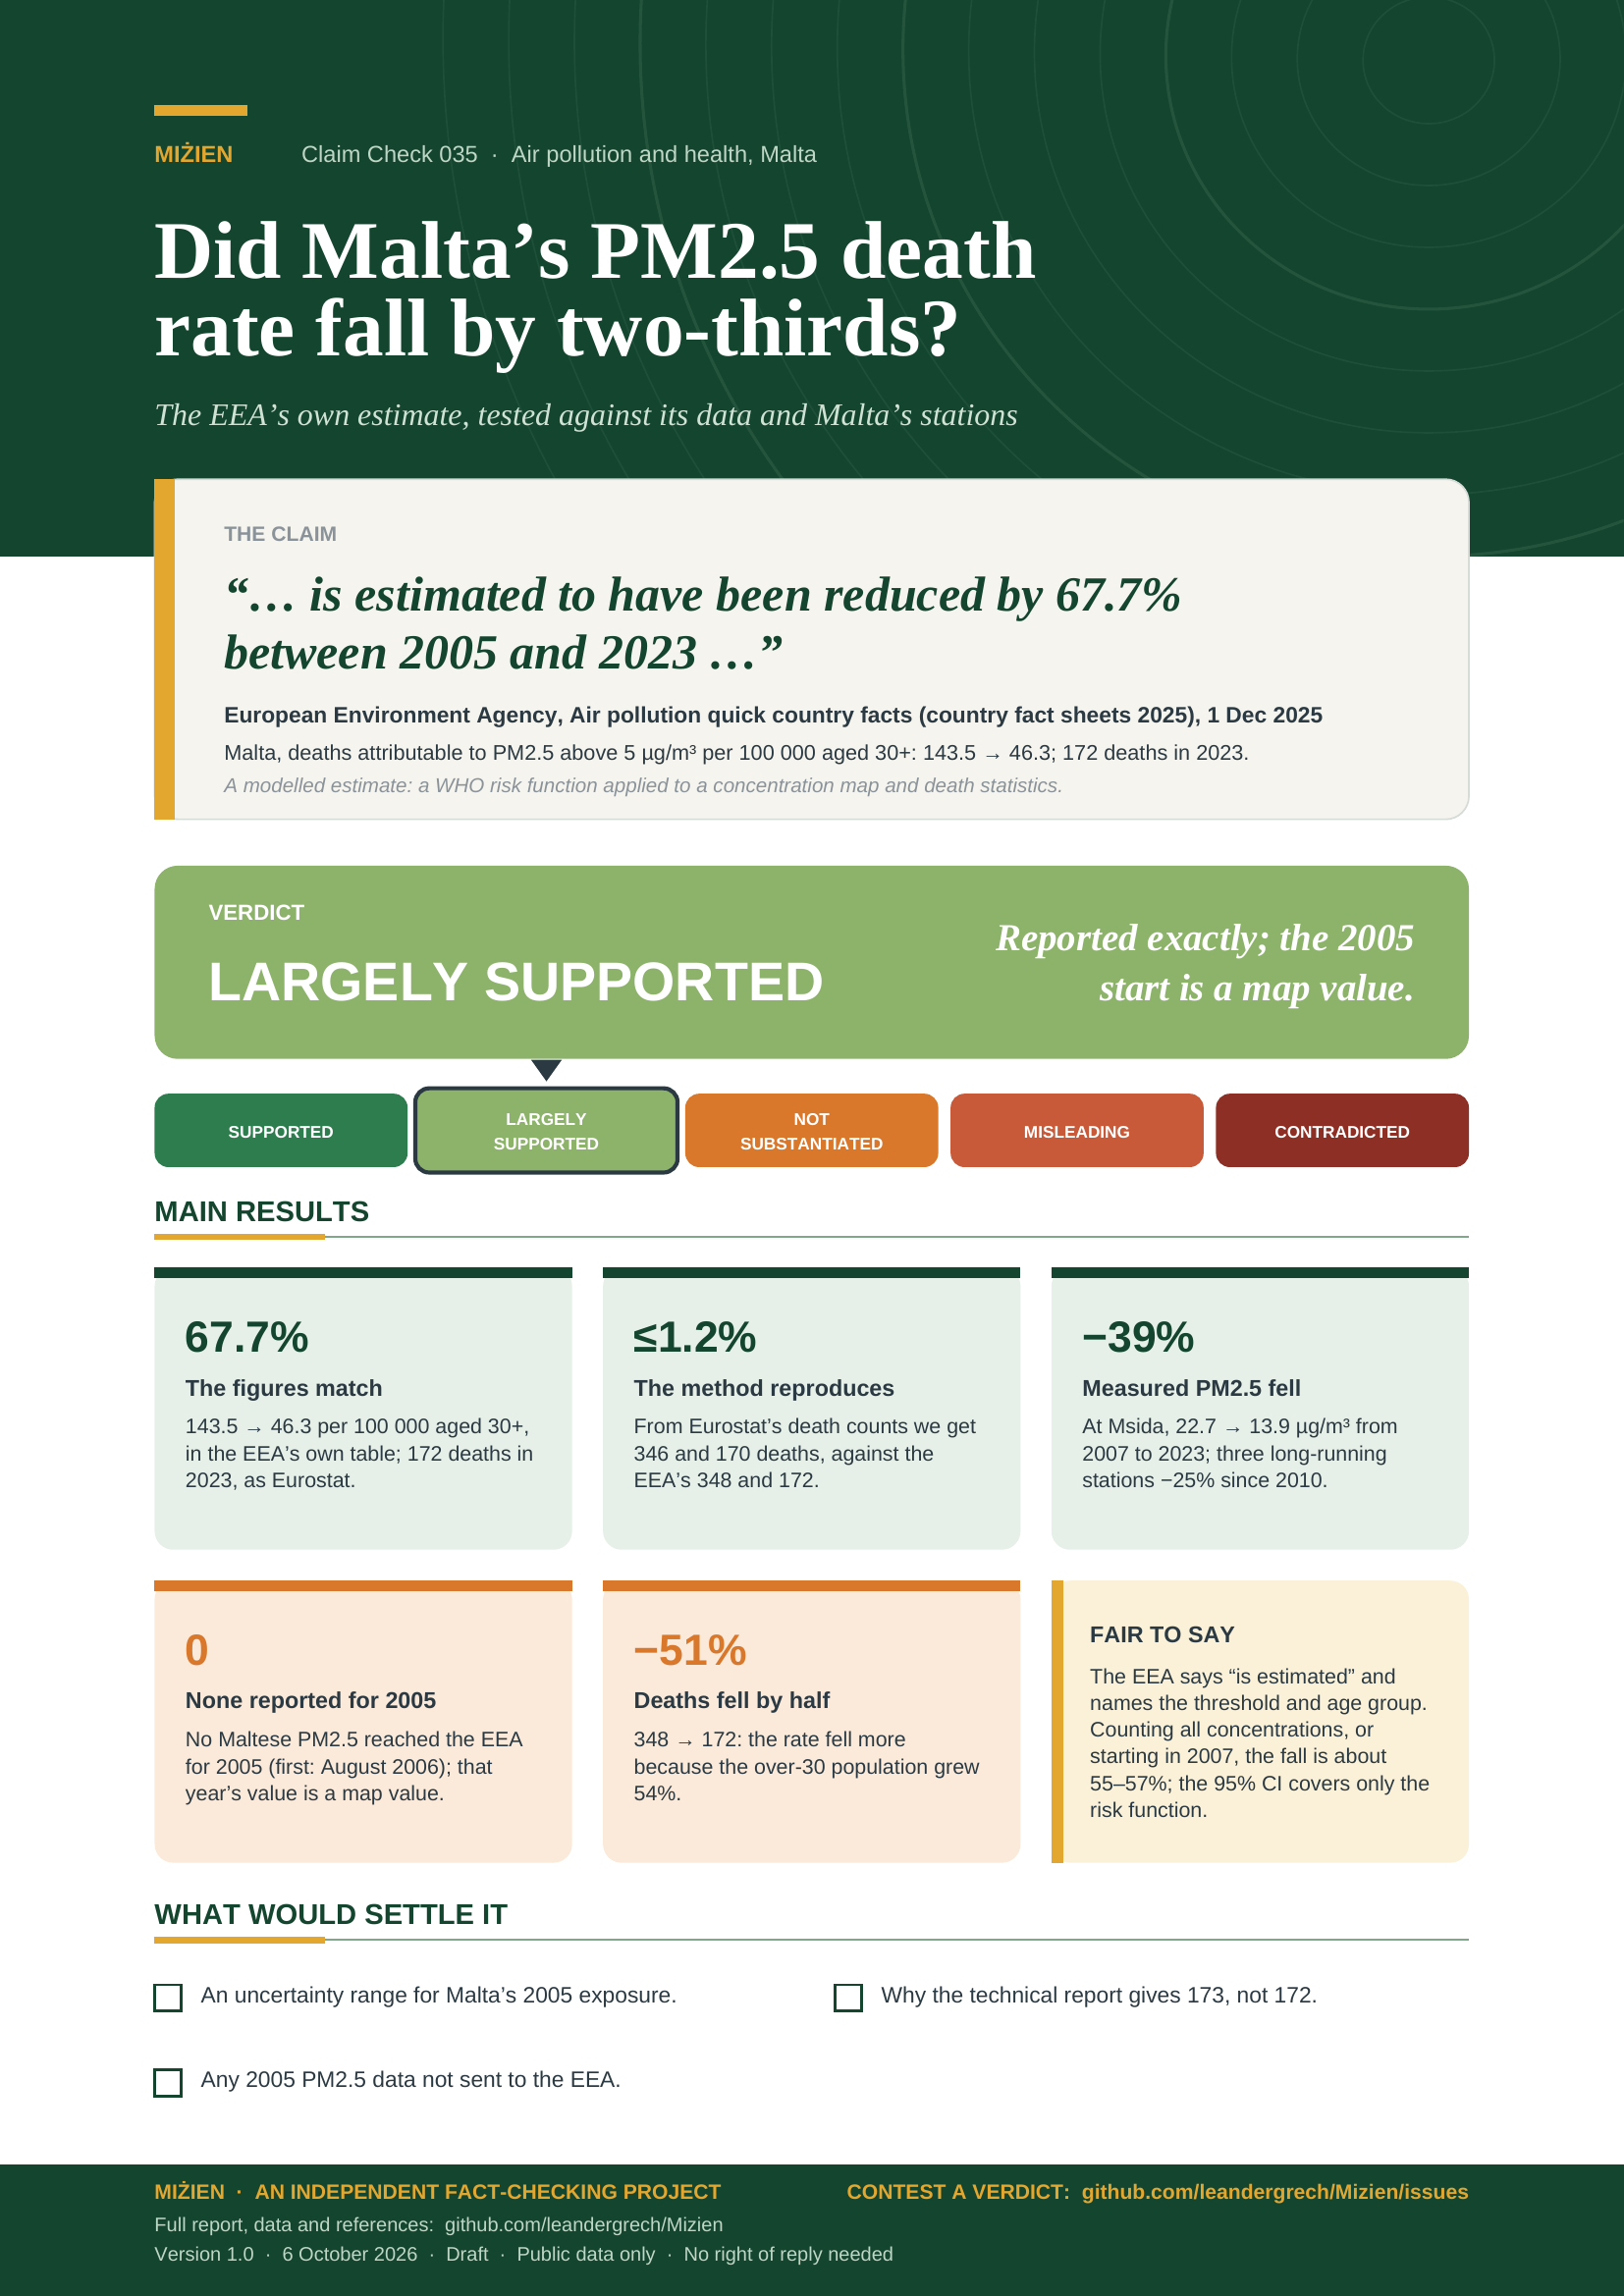
“… is estimated to have been reduced by 67.7% between 2005 and 2023 (from 143.5 to 46.3, respectively), resulting in 172 (95% CI: 131-192) attributable deaths in 2023.”
European Environment Agency, Air pollution quick country facts (country fact sheets 2025), 1 Dec 2025.
The rate: deaths attributable to PM2.5 above 5 µg/m³ per 100 000 people aged 30+, Malta.
Verdict: Largely supported Accurate report of an estimate; 2005 is a map value
Version 1.0 · 6 October 2026
TL;DR
The European Environment Agency’s Air pollution quick country facts (page modified 1 December 2025) say that in Malta the rate of natural deaths attributable to long-term exposure to PM2.5 above 5 µg/m³, per 100 000 people aged 30 or over, “is estimated to have been reduced by 67.7% between 2005 and 2023 (from 143.5 to 46.3, respectively), resulting in 172 (95% CI: 131-192) attributable deaths in 2023.”
- The figures are the EEA’s own, reported exactly. The EEA’s table gives 143.5 (2005) and 46.3 (2023), a fall of 67.74%, and 172 deaths (95% CI 131–192) in 2023; Eurostat republishes the same. The technical report gives 173 (132–193): one death.
- The method is the documented one, and it reproduces. 8% more deaths per 10 µg/m³ (WHO), counted above 5 µg/m³, applied to natural deaths of people aged 30+. From Eurostat’s own death counts we get 346 and 170 deaths for 2005 and 2023, within 1.2% of the EEA’s 348 and 172.
- Measured PM2.5 fell; 2005 is a map value. At Msida PM2.5 fell 39% from 2007 to 2023, and at three long-running stations 25% from 2010: direct evidence of a fall. The EEA’s map is built on these stations, so they anchor it rather than check it. No Maltese PM2.5 was reported to the EEA for 2005; that year’s 21.0 µg/m³ comes from an older map method and model.
- It is a rate, and the start and threshold matter. The number of deaths fell by half (348 to 172) because the over-30 population grew 54%. Counting all concentrations, or starting in 2007, the fall is about 55–57%.
- Verdict: largely supported (high confidence). The statement accurately reports the EEA’s estimate and says it is an estimate. The caveat: the exact 67.7% rests on a 2005 map value, and the 95% CI covers only the risk function.
- Supported
- Largely supported
- Not substantiated
- Misleading
- Contradicted
What would move the verdict up
The EEA’s confirmation of which 2005 map it used, with an uncertainty range for Malta’s 2005 exposure that keeps the fall near two-thirds.
What would move it down
An EEA revision of the series, or evidence that the 2005 map was off by much more than its typical error (about 3 µg/m³), so that the 2005–2023 fall changes materially.
IN THIS REPORT
1 The claim and what we could verify
The statement is the EEA’s own text on its Air pollution quick country facts page, part of the 2025 air pollution country fact sheets, read in the page HTML on 6 October 2026 [1]. The page gives a sentence of the same form for each country it covers. The EEA is the EU’s environment agency; we assess the wording of its statement, not the agency. Because it is the EEA’s own statistic, the questions are whether the sentence reports the EEA’s estimate accurately, and what that estimate does and does not mean.
| What | Where | Access |
|---|---|---|
| The Malta sentence (quoted on the cover and in the TL;DR) | Air pollution quick country facts [1] | Read in full, 6 Oct 2026 |
| The estimates by year and scenario, with population and concentration | EEA burden-of-disease table [2]; Eurostat sdg_11_52 [3] | Downloaded, 6 Oct 2026 |
| The method and its history | EEA briefing [4] and indicator [5]; ETC HE technical report [6]; map reports for 2005 [7] and 2023 [8] | [4, 5] read in full; [6–8] pages read |
| Measured PM2.5 and PM10 in Malta, 2004–2025, and station types | EEA station files [10] and metadata [17]; PQ 29696 table via CC-007 [15] | Downloaded; reused |
Our intake record first paraphrased the statement as “PM2.5 deaths down two-thirds”. The EEA speaks of the rate, and the number of deaths fell by about half (section 6), so the record title is now “PM2.5 death rate down two-thirds”. The EEA’s Europe’s environment 2025 page for Malta draws the same series as a chart, with data to 2022 [14]; it is context, not the statement checked.
2 Method
Question. Do 143.5, 46.3, 67.7% and 172 (131–192) match the EEA’s own estimates; is the method as described; is the 2005 starting point comparable with 2023; and did Malta’s measured PM2.5 fall?
Evidence. We downloaded the EEA’s Burden of disease of air pollution (Countries & NUTS) table through its Table publisher [2]: Malta for every scenario, all countries, and the EU-27. We downloaded Eurostat sdg_11_52 (the same estimates, republished [3]), Eurostat population, deaths and causes of death [11] and emissions [12], every Malta PM2.5 and PM10 file in the EEA’s station archive [10] and the EEA’s station metadata [17], all on 6 October 2026 with Eurostat’s flags (none on the Malta values used). tools/cc-035-report/calc.py recomputes every figure from data/cc-035/. We read the EEA’s briefing and indicator [4, 5], the relevant parts of the technical report behind the estimates [6] and of the two map reports [7, 8], and searched Crossref and Europe PMC for peer-reviewed work on the risk function and on Malta’s PM2.5 [9, 13].
Grades. Official estimates and statistics are grade C, as is the meta-analysis behind the risk function (a review); Malta’s source-apportionment study is grade B. Verdicts follow the five-point scale in Appendix A.
3 How the estimate is made
The EEA’s estimate combines four things, cell by cell on a 1 km grid, and adds up the cells [6, Annex 1]:
- Concentration. An annual PM2.5 map that interpolates between monitoring stations, with “pseudo” PM2.5 values estimated from PM10 stations, a chemical transport model and other data (altitude, meteorology, population) [6, 8]. For Malta in 2023 its population-weighted mean is 10.9 µg/m³ [6].
- Population. Gridded population scaled to Eurostat totals; for all-cause deaths, people aged 30 or over (373,208 in Malta in 2023; Eurostat 373,224 [2, 11]).
- Baseline deaths. Deaths from natural causes (all causes except injuries and other external causes) by age and sex, from Eurostat. Cause-of-death data begin in 2011, so 2011 stands in for 2005–2010 [6].
- Risk. 8% more natural deaths per 10 µg/m³ (95% CI 6–9%), the WHO 2021 recommendation from Chen and Hoek’s meta-analysis of 107 studies [6, 9], counted only above 5 µg/m³, the WHO 2021 guideline level [4].
The attributable fraction in a cell is 1 − exp(−β × (C − 5)), with β = ln(1.08)/10, and the deaths are that fraction of the cell’s baseline deaths [6, Annex 1]. Using Malta’s national mean concentration and Eurostat’s natural deaths aged 30+ [11], we get 346 deaths for 2005 and 170 for 2023, against the EEA’s 348 and 172 (−0.6% and −1.2%). The small gap is expected, since the EEA works cell by cell [6, pp. 45–46].
What changed in the method. The health calculation is now the same for every year. Until 2021 the EEA used a risk of 6.2% per 10 µg/m³ counted from 0 µg/m³; from 2022 it uses 8% counted above 5 µg/m³, and since 2024 it gives rates per person aged 30 or over; it recalculated every year back to 2005 this way [5]. The concentration maps are not one method: PM2.5 maps use an updated mapping method only from 2017, 2005 and 2009 exist in old and updated versions, the ETC’s own trend uses old-method maps for 2005–2014 [8, pp. 74–77], and the chemical transport model changed from EMEP to CAMS from 2020 [8, p. 108]. Which 2005 version the EEA’s table uses is not stated. No 2006 map was prepared, hence no 2006 value [8, p. 76]. The 95% CI reflects the uncertainty in the risk only; “other possible uncertainties (for instance, the one related to exposure assessments) are not quantified” [4].
4 What the measurements show
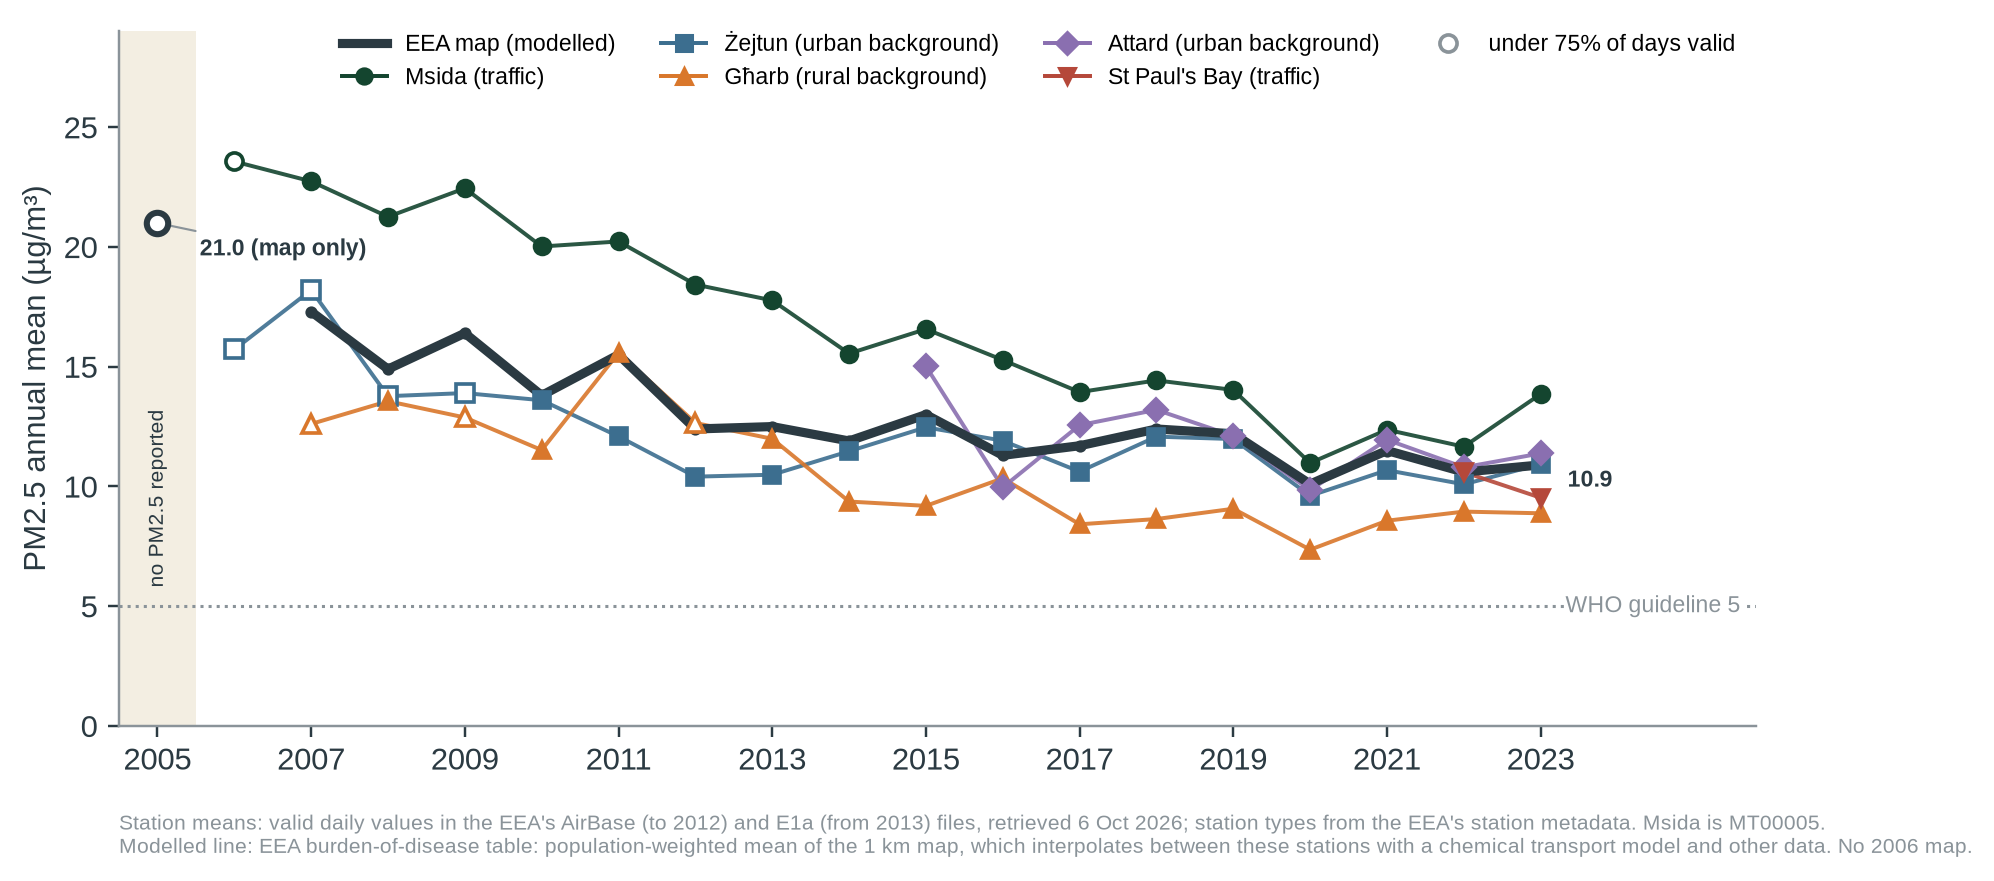
Measured PM2.5 fell. At Msida (a traffic station) PM2.5 went from 22.7 µg/m³ in 2007 to 13.9 in 2023 (−39%); the mean of Msida, Żejtun and Għarb, the three stations with at least 75% of days in every year from 2010 (except 2012), fell from 15.1 to 11.2 (−25%) [10]. This is direct evidence that PM2.5 fell. It is not an independent check of the map: the map interpolates between these same stations [6, 8], so it is anchored to them. In 2023 the five stations in the parliamentary table used in CC-007 average 10.9 µg/m³, the map’s value, but that is an unweighted mean of two traffic, two urban background and one rural station [10, 15, 17].
Two cautions. PM10 at the same stations did not fall (Msida 42.5 µg/m³ in 2009 and 43.7 in 2023; Żejtun 29.3 in 2007 and 28.7 in 2023) while their PM2.5 fell by about 40% [10]. And the PM2.5 instruments changed: beta-attenuation monitors from 2006, gravimetric reference samplers from 2014, an optical (GRIMM) monitor at Msida from 24 September 2021, and a TEOM-FDMS at Għarb [17]; where two sampling points report the same day, our means average them. We have not untangled these effects.
2005. The EEA’s station archive has no Maltese PM2.5 before 29 August 2006 (Żejtun) [10]. For 2005 Malta reported PM10 at two stations: Kordin, which the EEA’s metadata classes as industrial, and MT00002, whose type is not in the current metadata [10, 17]. The ETC maps use background and traffic stations only [7, Table A.1], so Kordin probably did not feed the 2005 map, and the 2005 value may rest on no Maltese measurement at all. Our identification of the 2005 map is ETC/ATNI Report 2020/1 (updated method), which gives Malta 21.2 µg/m³ [7]; the EEA’s table has 21.0 [2], a gap we cannot explain. That map’s typical cross-validation error was 2.9 µg/m³ in urban background areas [7]. As a rough test, the 2007 PM2.5/PM10 ratios at Msida (0.54) and Żejtun (0.62) applied to the 2005 PM10 means (49.0 at MT00002, 42.4 at Kordin) give 23–30 µg/m³ at those two sites, not below the map’s 21.0. This is indicative only: one site is industrial, the other’s type is unknown, and the ratios come from other sites and another year.
Context. Malta’s reported primary PM2.5 emissions fell from 750 to 310 tonnes between 2005 and 2023, with public electricity and heat production down from 420 to 3 tonnes [12]. Emissions are not the whole story: at Msida in 2016, Saharan dust and sea salt made up about a third of PM2.5 [13], and the method treats all PM2.5 mass alike [6, Annex 1].
| Indicator | Malta | Comparison | Source | Grade |
|---|---|---|---|---|
| Rate per 100 000 aged 30+, 2005 → 2023 | 143.5 → 46.3 | EU-27 153.0 → 59.7 | [2] | C |
| Fall in the rate, 2005–2023 | 67.7% | EU-27 61.0%; Malta 14th of 27 | calculated | C |
| Attributable deaths, 2005 → 2023 | 348 → 172 | EU-27 423,593 → 182,399 | [2, 3] | C |
| Modelled population-weighted PM2.5 (µg/m³) | 21.0 → 10.9 | EU-27 19.4 → 10.2 | [2] | C |
| Measured PM2.5 at Msida, 2007 → 2023 (µg/m³) | 22.7 → 13.9 | three stations, 2010 → 2023: 15.1 → 11.2 | [10] | C |
| Natural deaths aged 30+, baseline rate per 100 000 | 1,238 → 1,038 | implied by the EEA figures; Eurostat 1,231 → 1,026 | calculated [11] | C |
All values in data/cc-035/checks.csv, station_vs_model.csv and eu27_rate_change.csv.
5 Where the evidence points different ways
Q1 Is the 2005 starting point comparable with 2023?
SAME HEALTH METHOD; MAPS DIFFER; 2005 A MAP VALUEEVIDENCE FOR THE CLAIM'S IMPRESSION
The health calculation is the same for every year: the EEA recalculated 2005–2023 with the current risk function, threshold and age group [5, 6]. Our approximation, using the EEA’s concentrations and Eurostat’s death counts, matches both ends within 1.2%. Measured PM2.5 at Malta’s stations fell from 2007 (section 4).
EVIDENCE AGAINST
The maps are not one method: PM2.5 maps use the updated method only from 2017, 2005 exists in old and updated versions, and the model changed from EMEP to CAMS from 2020 [8, pp. 74–77, 108]; which 2005 version the table uses is not stated. No Maltese PM2.5 was reported to the EEA for 2005 [10], and both the 2005 and 2023 maps use PM10-based pseudo stations [7; 8, pp. 108, 118]. Shifting Malta’s 2005 value by the map’s typical error (2.9 µg/m³) gives a fall of 61% to 72% (indicative). The 95% CI leaves exposure error out [4].
Q2 Does a 67.7% fall in the rate mean two-thirds fewer deaths?
ACCURATE AS WORDEDEVIDENCE FOR THE CLAIM'S IMPRESSION
The EEA says “rate”, names the threshold (above 5 µg/m³) and the age group, and says “is estimated”. A rate per person at risk is how the EEA compares countries [4]. Eurostat’s rate per inhabitant of all ages fell 64% [3].
EVIDENCE AGAINST
The number of deaths fell 50.6% (348 to 172), because the over-30 population grew 54% [2]. Part of the rate’s fall is a 16% lower baseline death rate among people over 30, not cleaner air (section 6). Counting all concentrations the fall is 54.7% [2]. And 5 µg/m³ is not a no-effect level: studies at low concentrations find similar or higher risks [9], and the EEA notes no evidence of a threshold [4].
6 Testing the claim
| Sub-claim | What the evidence shows | Rating |
|---|---|---|
| A. The rate was 143.5 per 100 000 aged 30+ in 2005 | EEA table: 143.5 (348 deaths, 242,534 people aged 30+) [2]; Eurostat: 348 deaths [3]. | ACCURATE |
| B. It was 46.3 in 2023 | EEA table and technical report: 46.3 (35.2–51.7) [2, 6]. | ACCURATE |
| C. “reduced by 67.7% between 2005 and 2023” | (143.5 − 46.3) / 143.5 = 67.74%. The 2005 value is a map value, from maps of another method and model, with no Maltese PM2.5 reported to the EEA [8, 10]; from 2007 the fall is 56.6%; the 95% CI covers the risk only [4]. | LARGELY ACCURATE |
| D. “172 (95% CI: 131-192) attributable deaths in 2023” | EEA table and Eurostat: 172 (131–192) [2, 3]. Technical report: 173 (132–193) [6]. The rate implies 172.8 deaths, but rounding does not explain the lower bound (35.2 → 131.4): a one-death difference, unexplained. | ACCURATE |
| E. Natural deaths, long-term exposure above 5 µg/m³, people aged 30+ | Matches the documented method [4–6]; recomputed from Eurostat deaths within 1.2% (section 3). | ACCURATE |
Why the rate fell. Splitting the change: the attributable fraction fell from 11.6% to 4.4% of natural deaths (×0.383), as the modelled excess above 5 µg/m³ fell from 16.0 to 5.9 µg/m³; and the baseline natural death rate among people aged 30+ fell 16% (×0.838) [2, 11]. Together: ×0.321, a fall of 68%. On the attributable fraction alone the fall would be 61.7%.
7 Verdict and requests for evidence
The statement reports the EEA’s own estimate exactly and calls it an estimate; its 2005 starting value is a map value, with no Maltese PM2.5 reported to the EEA for that year. Confidence: high.
Why. (1) Every figure in the sentence reproduces exactly from the EEA’s own table (Eurostat republishes the same estimates, so it is not a separate source). (2) Recomputed from Eurostat’s own death counts and the EEA’s concentrations, the deaths come within 1.2% of the EEA’s, so the method is as described. (3) The sentence is carefully worded: a rate, above 5 µg/m³, people aged 30+, “is estimated”. (4) Measured PM2.5 fell at Malta’s stations from 2007, direct evidence that the exposure behind the estimate fell; the map is built on these stations, so their agreement with it is not a separate check. (5) The caveat is the start: the 2005 value is a map value, from an older map method and model, with no Maltese PM2.5 reported to the EEA, and the 95% CI leaves exposure error out, so the exact 67.7% is less certain than it looks. That is a minor caveat; it does not change the substance, a large fall. Confidence is high because three separate lines agree: the figures reproduce exactly, the deaths reproduce from Eurostat’s death counts, and measured PM2.5 has declined since 2007. We do not count Eurostat’s sdg_11_52 (the EEA’s estimate republished) or the station–map match (the map is anchored to the stations).
What this verdict does not say. It does not say that two-thirds fewer people died because of PM2.5 (the number fell by about half), that Malta’s air meets the WHO guideline (10.9 µg/m³ against 5 in 2023), or anything about the causes of the fall or any authority’s policy.
Evidence we are asking for
- From the EEA: which 2005 PM2.5 map (old or updated method) the burden-of-disease table uses, and an uncertainty range for Malta’s modelled exposure in 2005, which the 95% CI does not include.
- From the EEA: why the quick-facts page gives 172 (131–192) and the technical report 173 (132–193).
- From the Environment and Resources Authority, which runs Malta’s stations: any 2005 PM2.5 measurements not reported to the EEA, and the type of station MT00002.
8 Limitations
- The statement is a modelled estimate; we tested it against the EEA’s own data, its documented method and measured concentrations, not against an independent mortality study for Malta (we found none).
- Our recomputation uses Malta’s national mean concentration, not the EEA’s 1 km grid, so it is a check on the order of the result, not a replication.
- The stations anchor the map, so they show that PM2.5 fell but cannot test the map’s values; the 2023 match (10.9) is largely by construction.
- PM10 at Msida and Żejtun did not fall while PM2.5 did, and the PM2.5 instruments changed over the period (section 4); we have not untangled the two.
- The map errors we quote are Europe-wide cross-validation statistics, not Malta-specific; the 61–72% range and the 2005 PM10-ratio test are indicative.
- The 2005 map is our identification (ETC/ATNI 2020/1); the EEA does not say which version it used.
- Station annual means are averages of valid days from the EEA’s files, not the authority’s official annual statistics; for 2023 they match the PQ 29696 table to 0.1 µg/m³.
- Chen and Hoek [9] and Scerri et al. [13] were read as abstracts; a corrigendum to Scerri et al. (Chemosphere 219:1061–1062, 2019) was not read (Europe PMC lists no abstract and no open-access text).
- The quick-facts and Malta pages were not archived (the Wayback Machine refused requests on 6 October 2026).
References
- [1] European Environment Agency. Air pollution quick country facts (Air pollution country fact sheets 2025). Modified 1 Dec 2025. Read 6 Oct 2026. https://www.eea.europa.eu/en/topics/in-depth/air-pollution/air-pollution-country-fact-sheets-2025/quick-country-facts
- [2] European Environment Agency. Burden of disease of air pollution (Countries & NUTS), Table publisher. Retrieved 6 Oct 2026. https://discomap.eea.europa.eu/App/AQViewer/index.html?fqn=Airquality_Dissem.ebd.countries_and_nuts
- [3] Eurostat. sdg_11_52 Premature deaths due to exposure to fine particulate matter (PM2.5); updated 9 Dec 2025, retrieved 6 Oct 2026. doi:10.2908/SDG_11_52. (Republishes the EEA’s estimates.) https://ec.europa.eu/eurostat/databrowser/view/sdg_11_52/default/table
- [4] European Environment Agency (2025). Harm to human health from air pollution in Europe: burden of disease status, 2025. EEA Briefing 16/2025. doi:10.2800/8961999. Read 6 Oct 2026. https://www.eea.europa.eu/en/analysis/publications/harm-to-human-health-from-air-pollution-burden-of-disease-status-2025
- [5] European Environment Agency. Premature deaths due to exposure to fine particulate matter in Europe (indicator). Published 30 Nov 2025. Read 6 Oct 2026. https://www.eea.europa.eu/en/analysis/indicators/health-impacts-of-exposure-to
- [6] Soares J., Plass D., Kienzler S., González Ortiz A., Gsella A., Horálek J. (2025). Assessing the environmental burden of disease related to air pollution in Europe in 2023. ETC HE Report 2025/8. doi:10.5281/zenodo.17658760. Table 1.1, section 2.1, Annexes 1–4. https://doi.org/10.5281/zenodo.17658760
- [7] Horálek J., Schreiberová M., Marková J. (2020). Reference air quality maps 2005 and 2009. ETC/ATNI Report 2020/1. doi:10.5281/zenodo.4293744. Table 2.3, Tables A.1 and A.4. https://doi.org/10.5281/zenodo.4293744
- [8] Horálek J. et al. (2025). Air quality maps of EEA member and cooperating countries for 2023. ETC HE Report 2025/5. doi:10.5281/zenodo.17427294. Table 2.3, pp. 74–77, 108 and 118. https://doi.org/10.5281/zenodo.17427294
- [9] Chen J., Hoek G. (2020). Long-term exposure to PM and all-cause and cause-specific mortality: a systematic review and meta-analysis. Environment International 143:105974. doi:10.1016/j.envint.2020.105974. (Abstract read.) https://doi.org/10.1016/j.envint.2020.105974
- [10] European Environment Agency. Air Quality download service: AirBase and E1a station files for Malta, PM2.5 and PM10. Retrieved 6 Oct 2026; file list and SHA-256 in data/cc-035/eea_station_file_manifest.csv. https://eeadmz1-downloads-webapp.azurewebsites.net/
- [11] Eurostat. demo_pjan (population on 1 January by age), demo_magec (deaths by age), hlth_cd_aro (causes of death). Retrieved 6 Oct 2026. https://ec.europa.eu/eurostat/databrowser/view/demo_pjan/default/table
- [12] Eurostat. env_air_emis Air pollutants by source sector; updated 7 Sep 2026, retrieved 6 Oct 2026. https://ec.europa.eu/eurostat/databrowser/view/env_air_emis/default/table
- [13] Scerri M.M., Kandler K., Weinbruch S., Yubero E., Galindo N., Prati P., Caponi L., Massabò D. (2018). Estimation of the contributions of the sources driving PM2.5 levels in a Central Mediterranean coastal town. Chemosphere 211:465–481. doi:10.1016/j.chemosphere.2018.07.104. (Abstract read; corrigendum doi:10.1016/j.chemosphere.2018.12.121, Crossref-verified, not read.) https://doi.org/10.1016/j.chemosphere.2018.07.104
- [14] European Environment Agency. Health impacts of air pollution: Malta (Europe’s environment 2025). Published 29 Sep 2025. Read 6 Oct 2026. https://www.eea.europa.eu/en/europe-environment-2025/countries/malta/health-impacts-of-air-pollution
- [15] Miżien. Claim Check 007: Within EU limits vs WHO guideline (PQ 29696 station table). data/cc-007/.
- [16] Miżien. Data and calculations: data/cc-035/; tools/cc-035-report/calc.py.
- [17] European Environment Agency. Air quality station metadata (PanEuropean_metadata.csv): Malta’s PM10 and PM2.5 sampling points, station types and sampling processes. Retrieved 6 Oct 2026 (data/cc-035/eea_station_metadata_mt.csv). https://discomap.eea.europa.eu/map/fme/metadata/PanEuropean_metadata.csv
Appendix A: series standards and verdict scale
Every investigation in this series follows the same rules so that verdicts are comparable and challengeable.
| Verdict | Meaning |
|---|---|
| SUPPORTED | Evidence consistently backs the claim as stated. |
| LARGELY SUPPORTED | Backed by the evidence, with minor caveats that do not change the substance. |
| NOT SUBSTANTIATED | Stated more strongly than the evidence offered or available allows. May be true in some conditions but has not been shown. |
| MISLEADING | Omits material facts so that the overall impression is inaccurate, even if individual statements are defensible. |
| CONTRADICTED | The available evidence points against the claim. |
Confidence
High: multiple independent lines of evidence agree. Moderate: evidence is relevant but incomplete or indirect. Low: evidence is thin, second-hand or conflicting.
Evidence grades
A experiment · B observational study with a control or gradient · C review, guidance or official statistics · D assertion or anecdote. ◆ marks a source known only second-hand (none in this report).
Standards
- Quote the speaker, not the headline, with outlet and date, and link the original where possible.
- Separate the claim from the evidence offered for it, and say who made which statement.
- Grade the evidence and show differing views side by side where the evidence is unsettled.
- State what we could not access or verify, and what would change the verdict either way.
- Ask for the missing evidence in specific, answerable requests.
- Offer a right of reply where a check finds a claim Not substantiated, Misleading or Contradicted (or a pledge Not measurable, Off track or Missed), before wider circulation, and append responses.
- Correct errors openly with a version number and change log.
- Whistle-blow only on evidence: a verdict of Misleading or Contradicted requires documents or data that can be shown, not inference.
- Check every side. Government, opposition, NGOs and developers are held to the same standard.
Appendix B: revision log
| Version | Date | Change |
|---|---|---|
| 1.0 | 6 Oct 2026 | First issue. Verdict Largely supported (high confidence); no right of reply needed. |
Sources and archived copies
-
Air pollution quick country facts, European Environment Agency, 1 Dec 2025.
Original · Archived copy
The claim. Page 'Modified 01 Dec 2025'. Supplied by the maintainer on 5 Oct 2026 (literature/CC-035/primary-source.md) and read again in the page HTML on 6 Oct 2026 (SHA-256 in literature/CC-035/README.md). EEA content is CC BY 4.0. -
Health impacts of air pollution: Malta (Europe's environment 2025), European Environment Agency, 29 Sep 2025.
Original · fetched and fingerprinted 2026-10-10; no public snapshot yet
Earlier country page; the figures are in a chart covering 2005-2022 (previous release). Context, not the statement checked. Read 6 Oct 2026. -
Burden of disease of air pollution (Countries & NUTS), Table publisher, European Environment Agency, retrieved 6 Oct 2026.
Original · Archived copy
Primary evidence. The EEA's own estimates by year and scenario, with population at risk and population-weighted concentration (data/cc-035/eea_ebd_*.csv). -
Harm to human health from air pollution in Europe: burden of disease status, 2025 (EEA Briefing 16/2025), European Environment Agency, 1 Dec 2025.
Original · Archived copy
Method, counterfactuals, and what the 95% CI covers (relative risk only). doi:10.2800/8961999. Read 6 Oct 2026. -
Assessing the environmental burden of disease related to air pollution in Europe in 2023 (ETC HE Report 2025/8), European Topic Centre on Human Health and the Environment, 30 Nov 2025.
Original · fetched and fingerprinted 2026-10-10; no public snapshot yet
Technical report behind the estimates; Malta 173 (132-193) deaths, 46.3 per 100 000 aged 30+ (Table A4.1). Read in full 6 Oct 2026. -
Reference air quality maps 2005 and 2009 (ETC/ATNI Report 2020/1), European Topic Centre on Air pollution, transport, noise and industrial pollution, 20 Nov 2020.
Original · fetched and fingerprinted 2026-10-10; no public snapshot yet
How the 2005 map was made (PM2.5 stations plus PM10-based pseudo stations, background and traffic stations only (Table A.1), EMEP model); Malta 2005 21.2 µg/m³. Our identification of the 2005 map: the EEA does not say which version its table uses, and its 21.0 differs from 21.2 without explanation. The maps are not one method across the series (updated PM2.5 method only from 2017; 2005 exists in old and updated versions; EMEP to CAMS from 2020; ETC HE 2025/5, pp. 74-77, 108). Read in full 6 Oct 2026. -
EEA Air Quality download service (AirBase and E1a station files, Malta), European Environment Agency, retrieved 6 Oct 2026.
Original · Archived copy
Measured PM2.5 and PM10 reported to the EEA by Malta's stations, 2004-2025 (data/cc-035/eea_stations_malta_annual.csv); station types and instruments from the EEA's station metadata (data/cc-035/eea_station_metadata_mt.csv). Data never reported to the EEA would not appear.
Right of reply
Not needed: this check finds the claim supported. A right of reply is sought when a check finds a claim Not substantiated, Misleading or Contradicted.
Connections
How this claim relates to the others: who made it, the themes it shares with other claims, and the patterns it shows. A connection is a reason to read two checks side by side. It does not make either one right or wrong. How connections are found.
Who made it
Other claims by European Environment Agency 1
Linked directly 1
Claims that share a theme with this one. A theme is a cause, a mechanism, a target or a way of presenting figures that the editors have found in several claims; its strength says how close the link is.
Transport, air and climate Shared driver · Weak (indicative)
Fleet growth links traffic claims, air quality and emissions. The climate report names transport and buildings as the lagging sectors.
Two steps away 9
Not linked to this claim directly, but linked to a claim that is. These are found by following the links, not chosen by the editors, so they are looser: they show where one theme meets another.
- CC-003 Per-capita emissions vs 2030 projection (Misleading)through Transport, air and climateCC-007Transport, air and climate
- CC-004 'Strong progress' in waste separation (Not substantiated)through Transport, air and climateCC-007Selective-metric pattern
- CC-008 Flyovers and congestion (Not substantiated)through Transport, air and climateCC-007Transport, air and climate
- CC-010 Tree-planting counts (Largely supported)through Transport, air and climateCC-007Selective-metric pattern
- CC-016 Shore-to-ship: 90% less harbour pollution (Misleading)through Transport, air and climateCC-007Transport, air and climate
- CC-020 EP study: noise law not the cause (Largely supported)through Transport, air and climateCC-007Compliance-not-health pattern
- CC-021 Malta-Gozo tunnel traffic (not yet checked)through Transport, air and climateCC-007Transport, air and climate
- CC-033 Delimara: 'much cleaner air' (not yet checked)through Transport, air and climateCC-007Compliance-not-health pattern
- CC-110 EU: 37.7% of new cars zero-emission (Supported)through Transport, air and climateCC-007Selective-metric pattern
Three steps away 26
One step further again. At this distance a connection says more about how the themes fit together than about this claim.
- CC-001 Upper Barrakka concrete (Not substantiated)through Transport, air and climateCC-007Transport, air and climateCC-008Sealed soil and concrete
- CC-002 Comino tree compensation (Largely supported)through Transport, air and climateCC-007Selective-metric patternCC-004Waste and construction
- CC-011 Ten minutes' walk to green space (pledge: Not measurable)through Transport, air and climateCC-007Transport, air and climateCC-0032030 carbon target
- CC-012 Ta' Qali gravel and grass (Contradicted)through Transport, air and climateCC-007Transport, air and climateCC-008Sealed soil and concrete
- CC-017 Land reclamation outside the Freeport (Not substantiated)through Transport, air and climateCC-007Selective-metric patternCC-004Waste and construction
- CC-019 830,000 m2 of land lost in five years (Not substantiated)through Transport, air and climateCC-007Transport, air and climateCC-008Sealed soil and concrete
- CC-025 Per-capita emissions down 44% since 2005 (Largely supported)through Transport, air and climateCC-007Transport, air and climateCC-0032030 carbon target
- CC-026 EU's largest rise in emissions (Largely supported)through Transport, air and climateCC-007Transport, air and climateCC-003Transport, air and climate
- CC-054 Project Green: 100,000 m2 a year (not yet checked)through Transport, air and climateCC-007Selective-metric patternCC-010Replanting as currency
- CC-056 Central Link: 'only 254 trees' (not yet checked)through Transport, air and climateCC-007Transport, air and climateCC-008Replanting as currency
- CC-057 1,649 compensation trees (not yet checked)through Transport, air and climateCC-007Selective-metric patternCC-010Replanting as currency
- CC-069 82 million bus trips (not yet checked)through Transport, air and climateCC-007Transport, air and climateCC-008Transport, air and climate
- CC-072 EUR 15m to take cars off the road (not yet checked)through Transport, air and climateCC-007Transport, air and climateCC-008Transport, air and climate
- CC-075 Seventh in the EU for cars (Misleading)through Transport, air and climateCC-007Selective-metric patternCC-110Transport, air and climate
- CC-076 36 more vehicles a day (Supported)through Transport, air and climateCC-007Transport, air and climateCC-008Transport, air and climate
- CC-079 Waste-to-energy: 4.5% of energy (Misleading)through Transport, air and climateCC-007Selective-metric patternCC-004Waste and construction
- CC-081 Landfill share rising (not yet checked)through Transport, air and climateCC-007Selective-metric patternCC-004Waste and construction
- CC-094 Commission: Malta to emit more in 2030 than in 2005 (Supported)through Transport, air and climateCC-007Transport, air and climateCC-0032030 carbon target
- CC-104 PN: Malta fails EU noise law (not yet checked)through Transport, air and climateCC-007Compliance-not-health patternCC-020Noise governance
- CC-105 ADPD: no study of Freeport and airport noise (Largely supported)through Transport, air and climateCC-007Compliance-not-health patternCC-020Noise governance
- CC-109 EU: transport is 48% of effort-sharing emissions (Largely supported)through Transport, air and climateCC-007Transport, air and climateCC-0032030 carbon target
- CC-111 EU: 621 kg of waste a head, 74% landfilled (Supported)through Transport, air and climateCC-007Selective-metric patternCC-004Waste and construction
- CC-114 PN: only EU state with rising emissions intensity (Misleading)through Transport, air and climateCC-007Transport, air and climateCC-003Selective-metric pattern
- CC-115 Chamber: congestion cost EUR 770m, 3.4% of GDP (Not substantiated)through Transport, air and climateCC-007Transport, air and climateCC-008Transport, air and climate
- CC-117 EU: Malta missed recycling targets (reasoned opinion) (not yet checked)through Transport, air and climateCC-007Selective-metric patternCC-004Waste and construction
- CC-120 EP study: 54,000 exposed to road noise, likely an underestimate (Largely supported)through Transport, air and climateCC-007Compliance-not-health patternCC-020Noise governance
Timeline
What was said, what was published before and after it, and each step of this check, in date order. Statements and sources carry the date they were published. The steps of the check carry the date the research was done, from the check's research log. Other statements by the same body on the same topic show whether a position was repeated, changed or corrected.
2018
2020
- 2020 Evidence published Long-term exposure to PM and all-cause and cause-specific mortality: a systematic review and meta-analysis (Chen and Hoek, Environment International 143:105974), Elsevier
- 20 November 2020 Evidence published Reference air quality maps 2005 and 2009 (ETC/ATNI Report 2020/1, Horálek et al.), European Topic Centre on Air pollution, transport, noise and industrial pollution
2025
- 2025 Evidence published Health impacts of air pollution: Malta (Europe's environment 2025), European Environment Agency
- 2025 Evidence published Air pollution country fact sheets 2025: quick country facts, European Environment Agency
- 21 November 2025 Evidence published Air quality maps of EEA member and cooperating countries for 2023 (ETC HE Report 2025/5, Horálek et al.), European Topic Centre on Human Health and the Environment
- 30 November 2025 Evidence published Premature deaths due to exposure to fine particulate matter in Europe (indicator), European Environment Agency
- 30 November 2025 Evidence published Assessing the environmental burden of disease related to air pollution in Europe in 2023 (ETC HE Report 2025/8, Soares et al.), European Topic Centre on Human Health and the Environment
- 1 December 2025 The statement European Environment Agency (this claim)
- 1 December 2025 Evidence published Harm to human health from air pollution in Europe: burden of disease status, 2025 (EEA Briefing 16/2025), European Environment Agency
2026
- 4 October 2026 Added to the claims to check
- 5 October 2026 Note Worker B attempt: the Europe's environment 2025 Malta page draws the figures in a chart; the maintainer then supplied the quick-facts wording (literature/CC-035/primary-source.md).
- 6 October 2026 Check started Check started in the maintainer session. EEA burden-of-disease table downloaded through the EEA Table publisher (Malta, every scenario; all countries; EU-27); Eurostat sdg_11_52, demo_pjan, demo_magec, hlth_cd_aro and env_air_emis downloaded with flags; all 30 Malta PM2.5 and PM10 station files downloaded from the EEA download service.
- 6 October 2026 Exact wording found Verbatim wording read in the quick-facts page HTML (page modified 1 Dec 2025); it matches the maintainer's primary-source.md word for word. Record text and title restated from the EEA's wording: it gives a rate, and the number of deaths fell by about half, so the title is now 'PM2.5 death rate down two-thirds'.
- 6 October 2026 Note Method read: EEA briefing 16/2025, the EEA indicator page, ETC HE Report 2025/8 (Soares et al.), ETC/ATNI Report 2020/1 (2005 reference maps) and ETC HE Report 2025/5 (2023 maps); Chen and Hoek (2020) and Scerri et al. (2018) read as abstracts; DOIs checked in Crossref and DataCite. Figures reproduced (143.5, 46.3, 67.74%, 172 (131-192)); method recomputed within 1.2%; measured PM2.5 compared with the modelled series.
- 6 October 2026 Note Research added after review, before the first issue: ETC HE 2025/5 pp. 74-77, 108 and 118 and ETC/ATNI 2020/1 Table A.1 reread (the maps are not one method: updated PM2.5 method only from 2017, old and updated versions of 2005, EMEP to CAMS from 2020, pseudo stations still used in 2023; the 2005 map was built from background and traffic stations only); EEA station metadata downloaded (station types and instruments); PM10 trends at Msida and Żejtun and an indicative 2005 PM2.5 estimate from 2005 PM10 and 2007 PM2.5/PM10 ratios added; Crossref confirms a corrigendum to Scerri et al. (not read). The stations are now presented as evidence that PM2.5 fell, not as a check of the map.
- 6 October 2026 Version 1.0: first issue First issue. Verdict Largely supported (high confidence); no right of reply needed. Verdict in this version: Largely supported, high confidence.
- 6 October 2026 Evidence reviewed
2027
- 6 October 2027 Coming up: Evidence review due Each finished check is reviewed against new evidence within a year.
Every change to this claim's record is public: history of the record.
Download the report and flyer