CC-124 · Climate & Energy · Emissions & targets
CCPI 2026: Malta 25th, car use not down
Largely supported Moderate confidence Draft: no right of reply needed
Parts of this claim
The claim is split into parts that are tested separately, as in the report below. Each part has its own number.
- CC-124A Malta “ranks 25th … up nine spots and a medium performer”Internally consistent with 34th in 2025 (second-hand ◆); scores, weights and method not read [1, 2].
- CC-124B Low rating for renewable energy; “low renewable energy share”17.2% in 2024, 4th lowest of 27 (EU-27 25.2%); rising faster than the EU [3].
- CC-124C “Automobile use has not decreased” since free public transport beganCars +5.8% (2022–25) and road energy +4.6% (2022–24); per resident flat to slightly lower; car share of passenger-km 82.9% to 80.3% (estimate) [3].
- CC-124D “A substantial increase in the number of electric vehicles”Battery-electric cars 1,783 (2021) to 9,790 (2025); 2.9% of the fleet, as in the EU-27 [3].
- CC-124E Offshore wind “not moved beyond the planning stage”Competitive dialogue and a metocean data tender (Apr 2026); no wind generation in Malta [4, 5].
- CC-124F Experts criticise “the lack of concrete efforts to reduce” GHG emissionsA judgement. Emissions per resident −11.6% (2022–24) but 82.7% of the 1990 level [3].
Claim Check 124 · Climate performance index, Malta
CCPI 2026: Malta 25th
Testing the Climate Change Performance Index’s Malta page against Eurostat and operator data
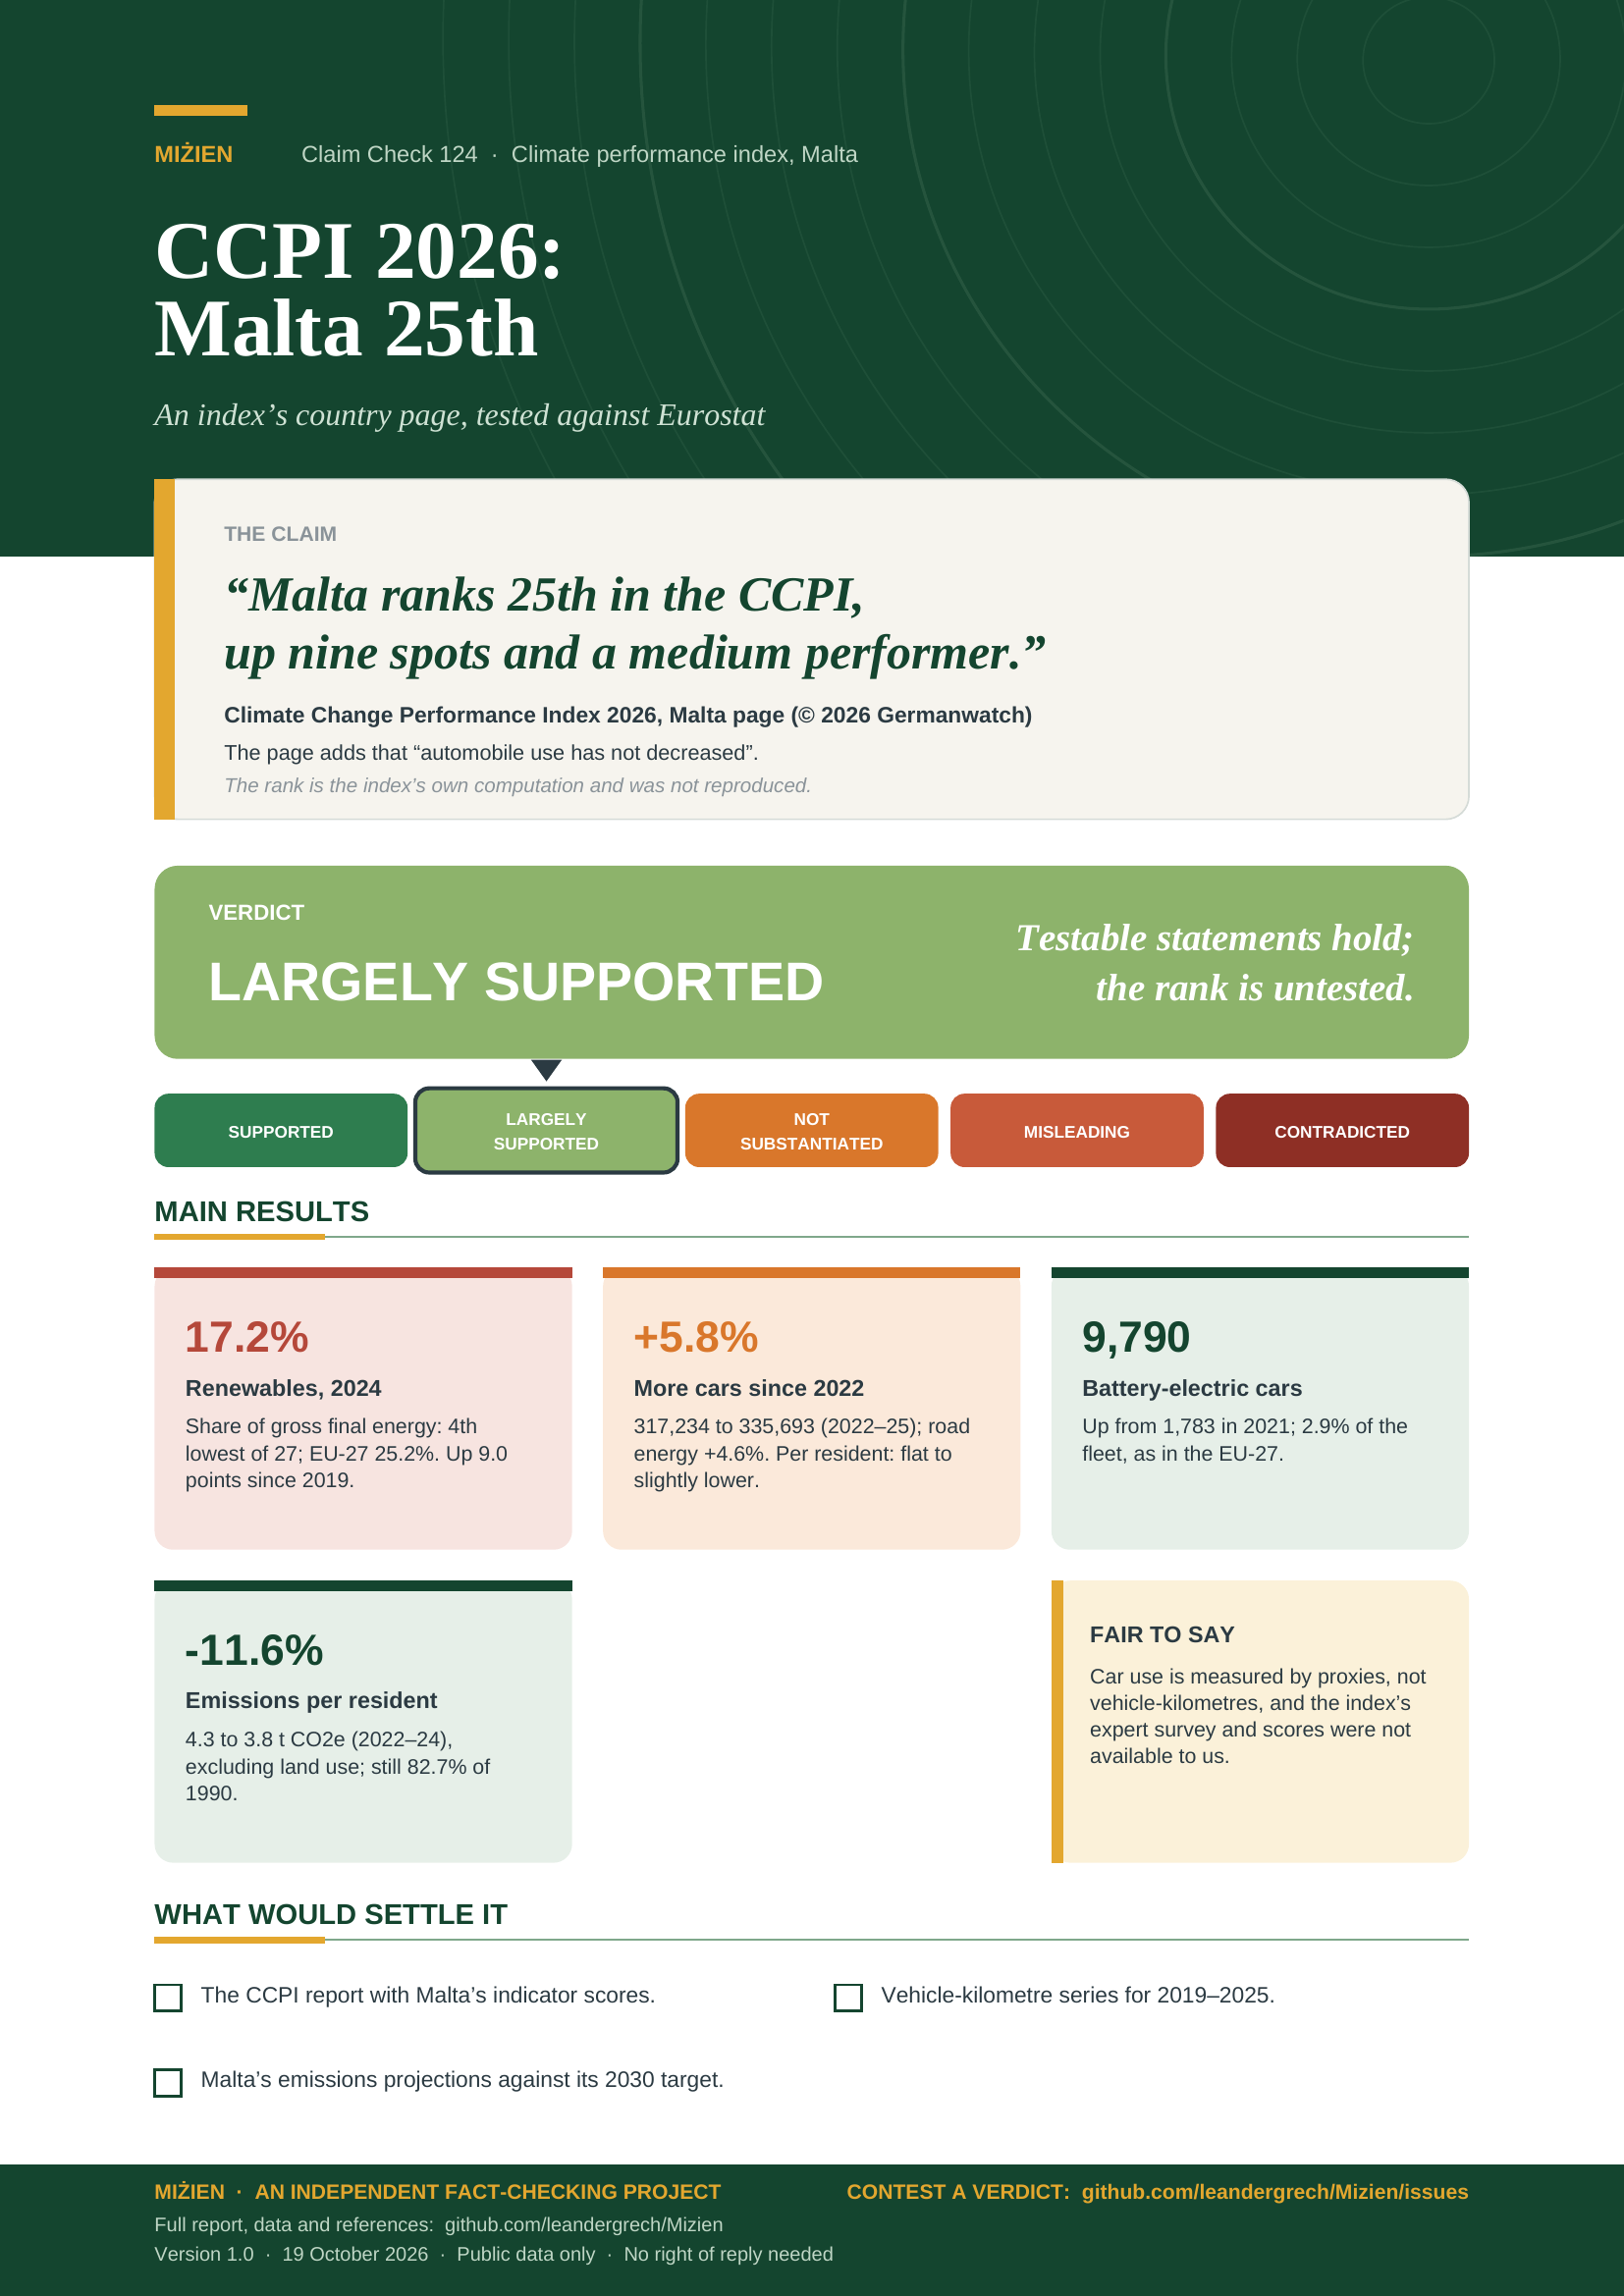
“Malta ranks 25th in the CCPI, up nine spots and a medium performer.”
Climate Change Performance Index 2026, Malta country page (ccpi.org; © 2026 Germanwatch).
The page adds that “automobile use has not decreased” and that offshore wind has “not moved beyond the planning stage”.
Verdict: Largely supported Testable statements hold; rank untested
Version 1.0 · 19 October 2026
TL;DR
The Climate Change Performance Index (CCPI) 2026 country page for Malta, published under Germanwatch’s copyright notice, says “Malta ranks 25th in the CCPI, up nine spots and a medium performer.” Its text adds that the country experts “criticise the lack of concrete efforts to reduce greenhouse (GHG) emissions”, that Malta’s share of renewable energy is low, that “automobile use has not decreased” although public transport has been free since October 2022, and that offshore wind has “not moved beyond the planning stage”. We tested what Eurostat and the operator’s own pages can answer; the rank itself was not reproduced.
- Renewables are low, but rising fast. Renewables were 17.2% of gross final energy consumption in 2024 (EU-27 25.2%), the 4th lowest of 27 Member States; Malta gained 9.0 points since 2019, the EU-27 5.4.
- Car use has not fallen in total. Passenger cars rose 5.8% from 2022 to 2025 (317,234 to 335,693) and road-transport energy 4.6% from 2022 to 2024. Per head the picture is flatter: cars per 1,000 residents fell from 585 to 571 and Eurostat’s estimated car share of passenger-km from 82.9% to 80.3%.
- Electric cars have risen sharply, from a small base. Battery-electric cars grew from 1,783 (2021) to 9,790 (2025), 2.9% of the fleet, the same share as the EU-27 (2.9%).
- Offshore wind is still at the procurement stage. InterConnect Malta’s April 2026 tender for two years of wind and wave data calls the project Malta’s possible “first-ever wind generation”; no turbine exists (see CC-029).
- Verdict: largely supported (moderate confidence). The testable statements hold; car use is up in total but flat or slightly down per head. The rank and the experts’ judgement are not testable from public data.
- Supported
- Largely supported
- Not substantiated
- Misleading
- Contradicted
What would move the verdict up
The CCPI report with Malta’s indicator scores, weights and the anonymous experts’ questionnaire; vehicle-kilometre or traffic-count data for 2022 to 2025 that Eurostat’s estimates do not provide.
What would move it down
Traffic counts showing a clear fall in car-kilometres per resident since October 2022 (against our finding of flat or slightly lower per-head use), or a wind-farm contract and a turbine in the water (against the “planning stage” finding).
IN THIS REPORT
1 The claim and what we could verify
The text is on the CCPI’s Malta country page [1], read in full on 18 and 19 October 2026 and archived. The page is undated; it belongs to the 2026 edition, which the CCPI’s download page dates 18 November 2025 [2]. Its footer carries a “© 2026 Germanwatch” notice and its authors are not named on the country page. It says the national experts “chose to remain anonymous”. We treat the page as the index’s own statement and rate the sentences below as written. The MaltaToday listing that locates the story could not be read (403) and is not used.
| What the page says (verbatim; the page’s own words) | Access |
|---|---|
| “Malta ranks 25th in the CCPI, up nine spots and a medium performer. The country receives medium ratings in GHG Emissions, Energy Use, and Climate Policy, and low in Renewable Energy.” | Read in full [1] |
| “…the CCPI country experts criticise the lack of concrete efforts to reduce greenhouse (GHG) emissions, as well as poor climate policy implementation.” | Read in full [1] |
| “Malta’s energy consumption still has a low renewable energy share. While the experts note some progress in solar energy use, they denounce offshore wind energy as having not moved beyond the planning stage.” | Read in full [1] |
| “While public transport in Malta has been free since October 2022, at least for citizens holding a tallinja card, the experts note that automobile use has not decreased …”; “a substantial increase in the number of electric vehicles” | Read in full [1] |
2 Method
Question. Do Eurostat’s series and the operator’s own pages support the testable statements on Malta’s country page, and can the rank be checked?
Evidence. Eurostat: passenger cars by power source (road_eqs_carpda) and per 1,000 residents (road_eqs_carhab), final energy in road transport (nrg_bal_c), modal split (tran_hv_psmod), renewable share (nrg_ind_ren), greenhouse-gas emissions (sdg_13_10) and population (demo_gind), retrieved 19 October 2026 with status flags [3]; InterConnect Malta’s project pages [4, 5]; two peer-reviewed papers [6, 7]. Every number was recomputed by tools/cc-124-report/calc.py from files in data/cc-124/.
Grades. Official statistics are grade C; peer-reviewed studies are grade B; an index’s expert opinion is grade D. Verdicts follow the five-point scale in Appendix A.
3 What the research says
Composite indices turn many indicators into one rank, and the rank can move with construction choices. Saisana, Saltelli and Tarantola propose uncertainty and sensitivity analysis to assess how reliable such country rankings are [7]. We could not obtain the CCPI report, so we cannot say how stable Malta’s 25th place is. It also depends on the results of the other countries scored (63 countries and the EU [2]).
Free fares do not by themselves guarantee fewer car trips. In Tallinn’s full-scale fare-free scheme, public-transport use rose 14% almost a year after introduction, less than earlier studies reported because service was already good and fares already low [6]. The abstract does not give the effect on car use, and Tallinn is not Malta; it shows only that a ridership gain and a car-use fall are separate questions.
4 What the data show
Car use
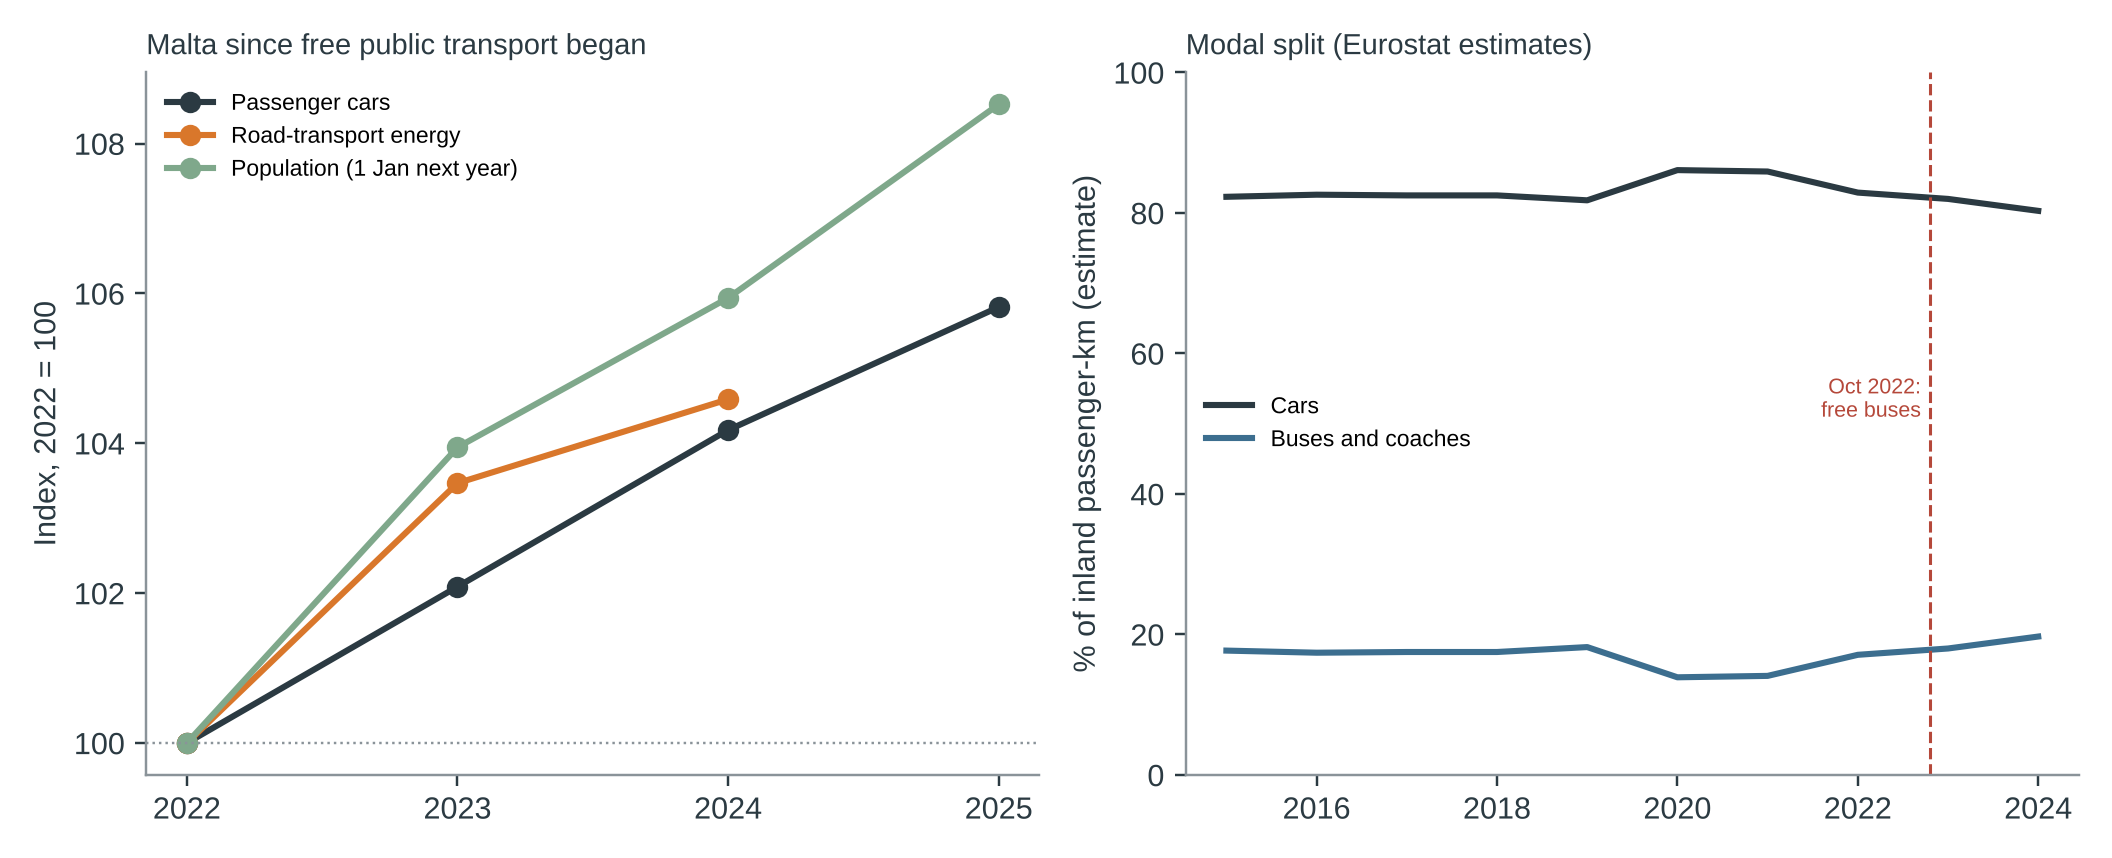
Free public transport began in October 2022 [1]. Between 2022 and 2025 passenger cars rose from 317,234 to 335,693 (+5.8%); population grew 8.5% over the same span, so cars per 1,000 residents fell from 585 to 571 (EU-27: 564 to 584; Malta was 609 in 2018). Road-transport final energy rose from 232.2 to 242.8 ktoe (+4.6%) between 2022 and 2024, 7.3% above 2019; per resident it was roughly flat (428 to 423 kg of oil equivalent, −1.3%; population timing differs by a year). Eurostat’s modal-split estimates put the car share at 82.9% in 2022 and 80.3% in 2024, and the bus share at 17.1% and 19.7%. Total car use, in cars and fuel, has therefore not fallen; per resident it is flat to slightly lower. We have no vehicle-kilometre series.
Renewables and electric cars
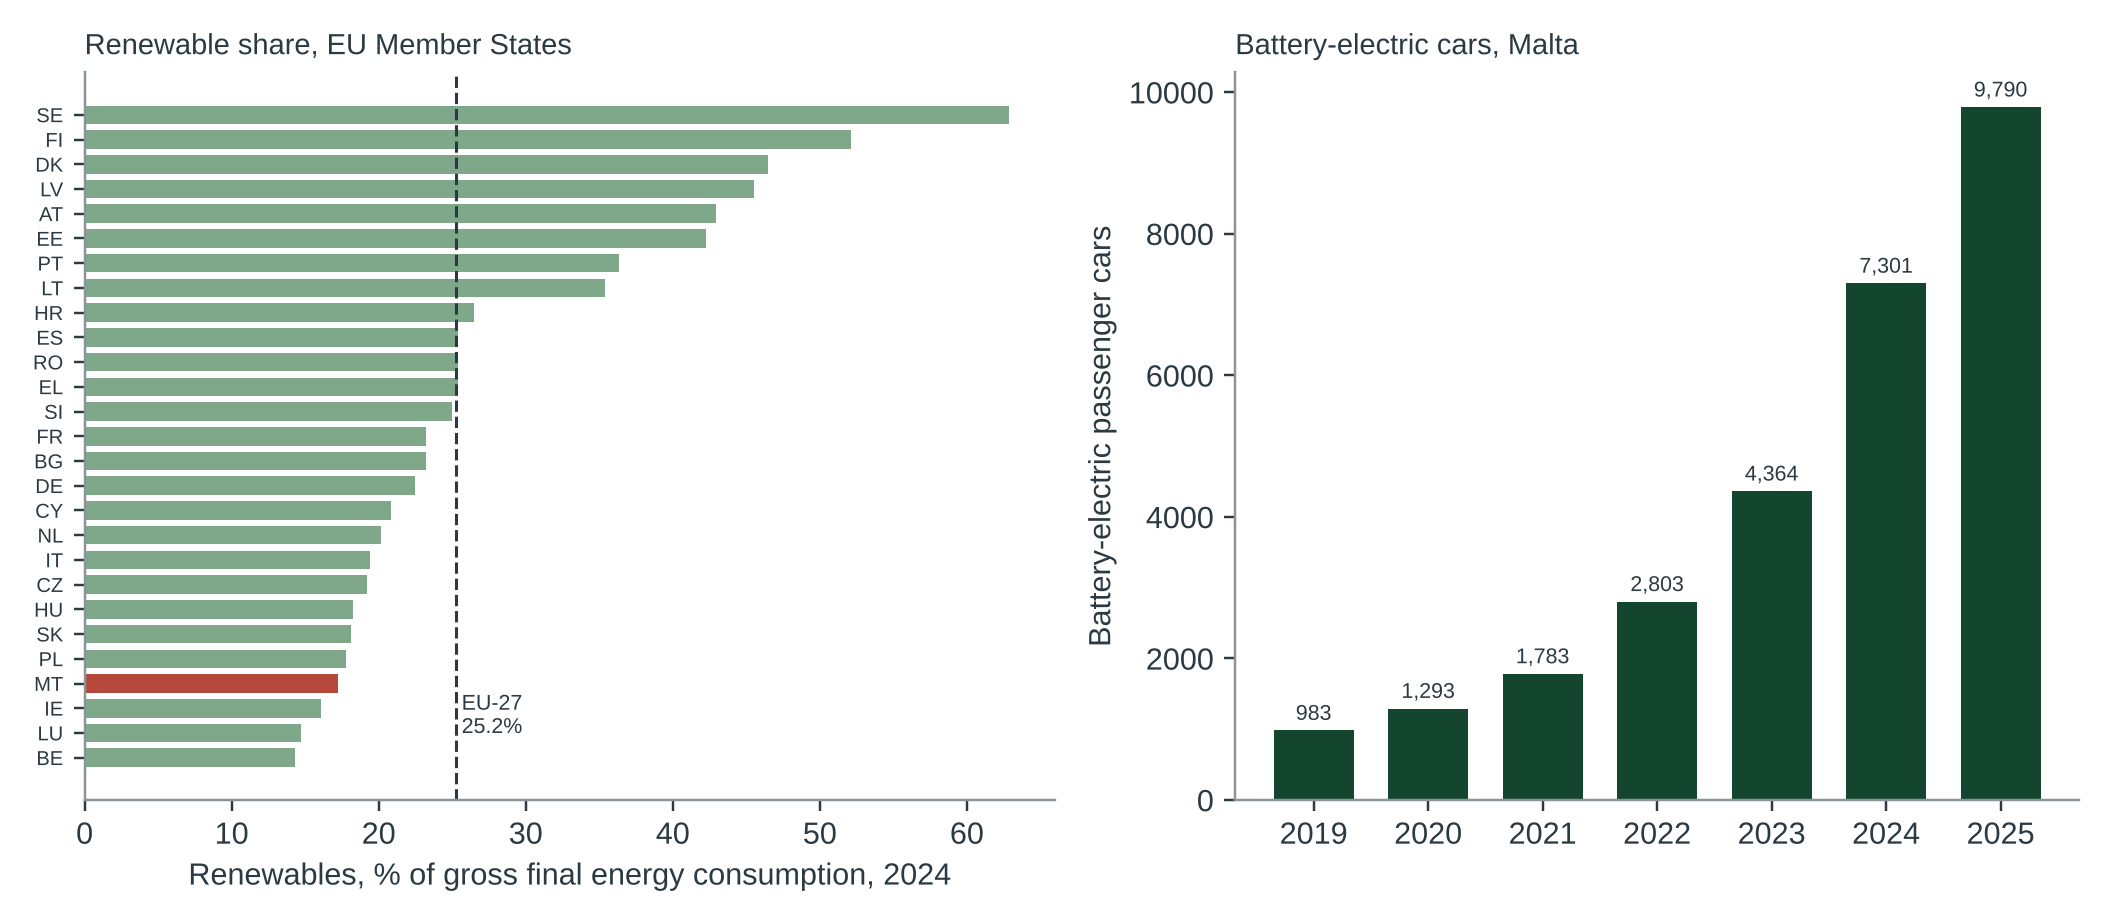
Malta’s renewable share was 8.2% in 2019 and 17.2% in 2024 (EU-27: 25.2%); the provisional 2025 value is 18.8% (EU-27 26.2%), 5th lowest. Malta ranked 4th lowest in 2024 behind Belgium (14.3%), Luxembourg (14.7%) and Ireland (16.1%). The CCPI’s renewable indicator is “% of TPES” (total primary energy supply) and a target comparison, not the final-consumption share we use, so “low” is tested here only as a direction. Battery-electric cars rose from 983 (2019) to 1,783 (2021) and 9,790 (2025), 2.92% of the fleet against 2.88% in the EU-27; with plug-in hybrids the share is 4.45% (EU-27 4.64%). That is a large increase, from a small base, and no faster than in the EU as a whole.
Emissions and offshore wind
Greenhouse-gas emissions excluding land use (Eurostat sdg_13_10) were 4.3 t CO2e per resident in 2022, 4.0 in 2023 and 3.8 in 2024 (−11.6%), and 82.7% of the 1990 level in 2024 (85.9% in 2022). Total emissions fell about 4% over the period (2.3 to 2.2 Mt CO2e, rounded values). A fall is not the same as “concrete efforts”, and we did not compare it with Malta’s targets or the EU-27 (no EU-27 series in this dataset). On wind, InterConnect Malta describes a competitive-dialogue process for a floating wind farm of about 300 MW beyond 12 nautical miles [4]; its 22 April 2026 release announces a EUR 3.6 million tender to collect two years of wind, wave and wildlife data and speaks of Malta’s “first-ever wind generation” [5]. No turbine or concession contract has been announced; claim check CC-029 records the timetable and the lack of a public notice of the next stage as of 6 October 2026.
5 Where the evidence points different ways
Q1 Has car use not decreased?
IN TOTAL YES; PER HEAD FLATEVIDENCE FOR THE CLAIM'S IMPRESSION
Cars are up 5.8% since 2022 and road-transport energy up 4.6% (2022 to 2024), above its pre-COVID level.
EVIDENCE AGAINST
Population grew faster than the fleet: cars per 1,000 residents fell from 585 to 571 and Eurostat’s estimated car share of passenger-km fell 2.6 points to 80.3%, while the bus share rose to 19.7% (all Malta values are estimates).
Q2 Does the “lack of concrete efforts” on emissions hold?
A JUDGEMENT; DATA MIXEDEVIDENCE FOR THE CLAIM'S IMPRESSION
Emissions per resident fell 11.6% from 2022 to 2024 and the total fell about 4%; per-resident fell from 4.2 t in 2018 to 3.8 t.
EVIDENCE AGAINST
Emissions are still 82.7% of the 1990 level, renewables are among the EU’s lowest, and road-transport energy is above 2019. The experts’ questionnaire is unseen.
Q3 Is Malta’s rank evidence of performance?
NOT TESTEDEVIDENCE FOR THE CLAIM'S IMPRESSION
The rank moved from 34th to 25th (second-hand: Wikipedia lists 55.78 and 60.44 points), consistent with the page’s “up nine spots”.
EVIDENCE AGAINST
The rank depends on other countries’ results, on indicator weights and on an expert survey, and rankings can be sensitive to such choices [7]. The report was not read.
6 Testing the claim
| Sub-claim | What the evidence shows | Rating |
|---|---|---|
| A. Malta “ranks 25th … up nine spots and a medium performer” | Internally consistent with 34th in 2025 (second-hand ◆); scores, weights and method not read [1, 2]. | NOT TESTED |
| B. Low rating for renewable energy; “low renewable energy share” | 17.2% in 2024, 4th lowest of 27 (EU-27 25.2%); rising faster than the EU [3]. | SUPPORTED |
| C. “Automobile use has not decreased” since free public transport began | Cars +5.8% (2022–25) and road energy +4.6% (2022–24); per resident flat to slightly lower; car share of passenger-km 82.9% to 80.3% (estimate) [3]. | LARGELY SUPPORTED |
| D. “A substantial increase in the number of electric vehicles” | Battery-electric cars 1,783 (2021) to 9,790 (2025); 2.9% of the fleet, as in the EU-27 [3]. | SUPPORTED |
| E. Offshore wind “not moved beyond the planning stage” | Competitive dialogue and a metocean data tender (Apr 2026); no wind generation in Malta [4, 5]. | SUPPORTED |
| F. Experts criticise “the lack of concrete efforts to reduce” GHG emissions | A judgement. Emissions per resident −11.6% (2022–24) but 82.7% of the 1990 level [3]. | JUDGEMENT |
7 Verdict and requests for evidence
The testable statements hold with minor caveats; the rank and the experts’ judgement could not be tested. Confidence: moderate.
Why. (1) Renewables are among the EU’s lowest, as the page says, although they have risen faster than the EU’s. (2) Cars and road fuel are up in total since free public transport began, which supports “has not decreased”; the per-head measures are flat to slightly down, a caveat that does not reverse it. (3) Electric-car numbers rose sharply and offshore wind has no installation. Confidence is moderate because the index’s rank and expert survey are unseen and car use is measured by proxies.
What this verdict does not say. It does not say Malta’s rank is right or wrong, that free public transport has failed, or that any government or agency has not acted. It says the page’s testable statements broadly match public data.
Evidence we are asking for
- The CCPI 2026 report and methodology, with Malta’s indicator scores and weights (it is behind a terms-of-use form).
- Vehicle-kilometre or traffic-count series for Malta 2019–2025 from Transport Malta or the NSO.
- Malta’s greenhouse-gas projections against its 2030 target, to compare with the emissions trend.
8 Limitations
- The CCPI report and methodology PDFs were not obtained (terms-of-use form); the 2025 rank and scores are second-hand (Wikipedia), marked ◆.
- Car use is measured by cars registered, road-transport energy and Eurostat’s modal-split estimates (flag e); none is vehicle-kilometres. Road-transport energy covers all road vehicles, not only cars.
- Road-transport energy for 2025 is not yet published; renewable share for 2025 is provisional.
- The CCPI’s renewable and emissions indicators (share of primary supply, per capita and target comparisons) differ from the Eurostat measures used here.
- Both papers were read as abstracts; neither concerns Malta [6, 7].
- The date of free public transport (October 2022) is the page’s statement; we did not re-verify it in this check.
References
- [1] Climate Change Performance Index (Germanwatch). Malta: Climate Performance Ranking 2026. Country page, read 18 and 19 Oct 2026. https://ccpi.org/country/mlt/
- [2] Climate Change Performance Index 2026 (report page; publication date 18 Nov 2025; download behind a terms-of-use form). https://ccpi.org/download/climate-change-performance-index-2026/
- [3] Eurostat. road_eqs_carpda, road_eqs_carhab, nrg_bal_c, tran_hv_psmod, nrg_ind_ren, sdg_13_10, demo_gind; retrieved 19 Oct 2026 with status flags. https://ec.europa.eu/eurostat/databrowser/
- [4] InterConnect Malta. Offshore Renewable Energy Project (project page), read 19 Oct 2026. https://icm.mt/projects/offshore-renewable-energy-project/
- [5] InterConnect Malta (22 Apr 2026). Offshore floating wind farm: ICM issues tender to collect data on wind, wave conditions. https://icm.mt/offshore-floating-wind-farm-icm-issues-tender-to-collect-data-on-wind-wave-conditions/
- [6] Cats O., Susilo Y.O., Reimal T. (2017). The prospects of fare-free public transport: evidence from Tallinn. Transportation 44(5):1083–1104. doi:10.1007/s11116-016-9695-5. (Abstract read.) https://doi.org/10.1007/s11116-016-9695-5
- [7] Saisana M., Saltelli A., Tarantola S. (2005). Uncertainty and sensitivity analysis techniques as tools for the quality assessment of composite indicators. Journal of the Royal Statistical Society A 168(2):307–323. doi:10.1111/j.1467-985X.2005.00350.x. (Abstract read.) https://doi.org/10.1111/j.1467-985X.2005.00350.x
- [8] Wikipedia. Climate Change Performance Index (table of ranks; second-hand ◆, read 19 Oct 2026). https://en.wikipedia.org/wiki/Climate_Change_Performance_Index
- [9] Miżien. Claim check CC-029: First offshore wind farm.
- [10] Miżien. Data and calculations: data/cc-124/; tools/cc-124-report/calc.py.
Appendix A: series standards and verdict scale
Every investigation in this series follows the same rules so that verdicts are comparable and challengeable.
| Verdict | Meaning |
|---|---|
| SUPPORTED | Evidence consistently backs the claim as stated. |
| LARGELY SUPPORTED | Backed by the evidence, with minor caveats that do not change the substance. |
| NOT SUBSTANTIATED | Stated more strongly than the evidence offered or available allows. May be true in some conditions but has not been shown. |
| MISLEADING | Omits material facts so that the overall impression is inaccurate, even if individual statements are defensible. |
| CONTRADICTED | The available evidence points against the claim. |
Confidence
High: multiple independent lines of evidence agree. Moderate: evidence is relevant but incomplete or indirect. Low: evidence is thin, second-hand or conflicting.
Evidence grades
A experiment · B observational study with a control or gradient · C review, guidance or official statistics · D assertion or anecdote. ◆ marks a source known only second-hand.
Standards
- Quote the speaker, not the headline, with outlet and date, and link the original where possible.
- Separate the claim from the evidence offered for it, and say who made which statement.
- Grade the evidence and show differing views side by side where the evidence is unsettled.
- State what we could not access or verify, and what would change the verdict either way.
- Ask for the missing evidence in specific, answerable requests.
- Offer a right of reply where a check finds a claim Not substantiated, Misleading or Contradicted (or a pledge Not measurable, Off track or Missed), before wider circulation, and append responses.
- Correct errors openly with a version number and change log.
- Whistle-blow only on evidence: a verdict of Misleading or Contradicted requires documents or data that can be shown, not inference.
- Check every side. Government, opposition, NGOs and developers are held to the same standard.
Appendix B: revision log
| Version | Date | Change |
|---|---|---|
| 1.0 | 19 Oct 2026 | First issue. No right of reply needed (verdict Largely supported). |
Sources and archived copies
-
Malta: Climate Performance Ranking 2026, Climate Change Performance Index (ccpi.org), 2026.
Original · Archived copy
The claim. Country page read in full on 18 Oct 2026 (HTTP 200 to a scripted request). The page is undated; the 2026 edition is the ranking year. National experts are anonymous (the page says they chose to remain anonymous). -
Malta climbs nine places in climate change index but progress remains slow, MaltaToday, 2026.
Original · not yet archived
Locates the claim (listing page; 403 to scripts). Not evidence.
Right of reply
Not needed: this check finds the claim supported. A right of reply is sought when a check finds a claim Not substantiated, Misleading or Contradicted.
Connections
How this claim relates to the others: who made it, the themes it shares with other claims, and the patterns it shows. A connection is a reason to read two checks side by side. It does not make either one right or wrong. How connections are found.
Who made it
No other claim by this body is listed yet.
Linked directly 6
Claims that share a theme with this one. A theme is a cause, a mechanism, a target or a way of presenting figures that the editors have found in several claims; its strength says how close the link is.
Energy subsidies Shared driver · Weak (indicative)
Claims about what energy support costs and what it shields: the lowest-electricity-burden claim, the Finance Minister's EUR 400 million a year (2026-27), and the EEA ranking of fossil-fuel subsidies by share of GDP. They rest on different definitions of subsidy. CC-095 (10 Oct 2026) set them side by side: the IMF figures used in CC-022 and the Government's own 2023 figure fit Eurostat's COFOG fuel-and-energy subsidies, while the Commission database's 2023 entries for Malta used in CC-113 equal the October 2022 budget allocation (EUR 595m), 2.5 times the Government's later 2023 figure (EUR 242.5m, energy and food).
Renewables delivery Shared target · Weak (indicative)
Claims about how much of Malta's energy is renewable and when more will arrive: the 2030 renewables target (CC-024), the first offshore wind farm (CC-029) and the Council's July 2026 statement that the share is 17.2% and almost all solar (CC-119). Indicative until a report tests the figures against Eurostat generation data.
Two steps away 3
Not linked to this claim directly, but linked to a claim that is. These are found by following the links, not chosen by the editors, so they are looser: they show where one theme meets another.
- CC-011 Ten minutes' walk to green space (pledge: Not measurable)through Renewables deliveryCC-0242030 carbon target
- CC-025 Per-capita emissions down 44% since 2005 (Largely supported)through Energy subsidiesCC-022Selective-metric pattern
- CC-051 'Over 30% of our seas protected' (Misleading)through Energy subsidiesCC-022Selective-metric pattern
Three steps away 3
One step further again. At this distance a connection says more about how the themes fit together than about this claim.
- CC-003 Per-capita emissions vs 2030 projection (Misleading)through Energy subsidiesCC-022Selective-metric patternCC-0252030 carbon target
- CC-026 EU's largest rise in emissions (Largely supported)through Energy subsidiesCC-022Selective-metric patternCC-025Selective-metric pattern
- CC-114 PN: only EU state with rising emissions intensity (Misleading)through Energy subsidiesCC-022Selective-metric patternCC-025Selective-metric pattern
Timeline
What was said, what was published before and after it, and each step of this check, in date order. Statements and sources carry the date they were published. The steps of the check carry the date the research was done, from the check's research log. Other statements by the same body on the same topic show whether a position was repeated, changed or corrected.
2005
- 2005 Evidence published Uncertainty and sensitivity analysis techniques as tools for the quality assessment of composite indicators (doi:10.1111/j.1467-985X.2005.00350.x), J R Stat Soc A 168
2016
- 2016 Evidence published The prospects of fare-free public transport: evidence from Tallinn (doi:10.1007/s11116-016-9695-5), Transportation 44
2026
- 2026 The statement Climate Change Performance Index (CCPI) (this claim)
- 2026 Statement published Malta: Climate Performance Ranking 2026, Climate Change Performance Index (ccpi.org)
- 2026 Reported Malta climbs nine places in climate change index but progress remains slow, MaltaToday
- 18 October 2026 Added to the claims to check
- 19 October 2026 Check started Check started by worker B. Speaker restated as the CCPI country page (Germanwatch copyright notice); the MaltaToday listing is a locator only (403).
- 19 October 2026 Exact wording found Verbatim wording found: ccpi.org/country/mlt read in full on 18 and 19 Oct 2026 and archived. The CCPI report and methodology PDFs are behind a terms-of-use form and were not obtained.
- 19 October 2026 Note Eurostat (cars, road energy, modal split, renewables, emissions, population) retrieved 19 Oct 2026; ICM project and tender pages read; two papers verified in Crossref. Calculations in tools/cc-124-report/calc.py.
- 19 October 2026 Version 1.0: first issue 1.0: first issue. Verdict Largely supported (moderate); no right of reply needed. Verdict in this version: Largely supported, moderate confidence.
- 19 October 2026 Evidence reviewed
2027
- 19 October 2027 Coming up: Evidence review due Each finished check is reviewed against new evidence within a year.
Every change to this claim's record is public: history of the record.
Download the report and flyer