CC-110 · Transport · Cars & traffic
EU: 37.7% of new cars zero-emission
Supported High confidence Draft: no right of reply needed
Parts of this claim
The claim is split into parts that are tested separately, as in the report below. Each part has its own number.
- CC-110A 7 700 new passenger cars in 2024, 37.7% of them zero-emission (Commission [1])Eurostat: 7,683 new cars, 2,893 battery electric, no hydrogen: 37.65%.
- CC-110B Up 17.4 points from 20.3% in 2023 (Commission [1])2023 share 20.31%. The rise is 17.34 points from unrounded shares, 17.35 from the report’s own annex values.
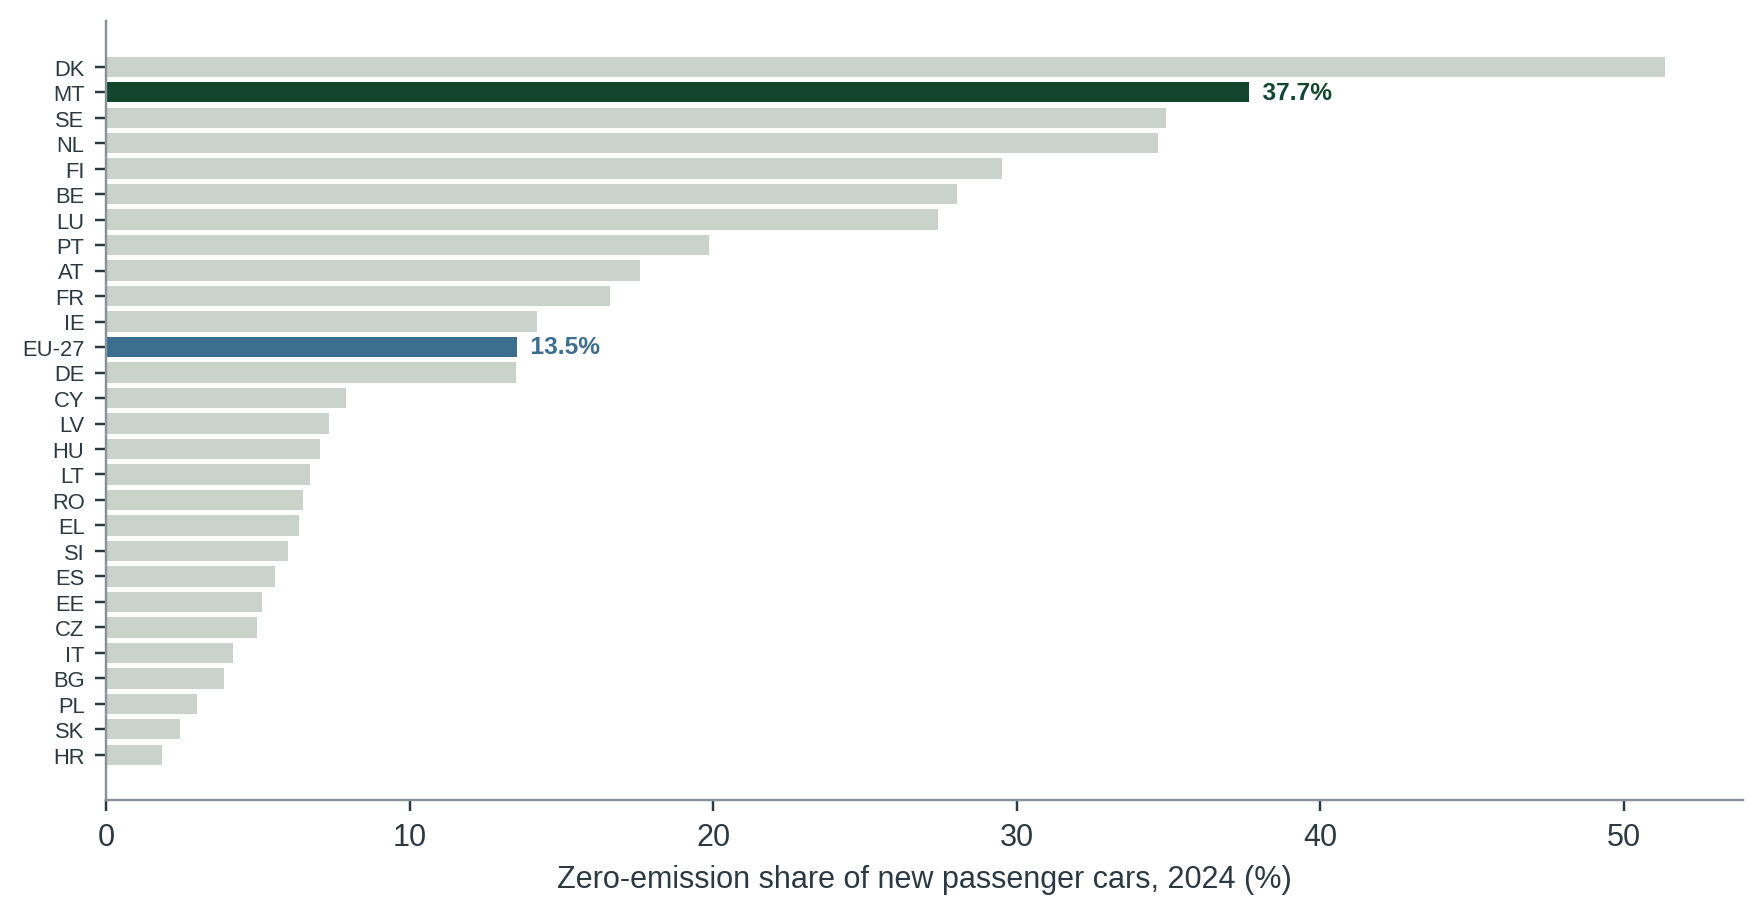
- CC-110C Well above the EU average of 13.6% (Commission [1])Eurostat EU-27: 13.53%. Malta is second of 27 member states, after Denmark.
Claim Check 110 · Statistics and EU data
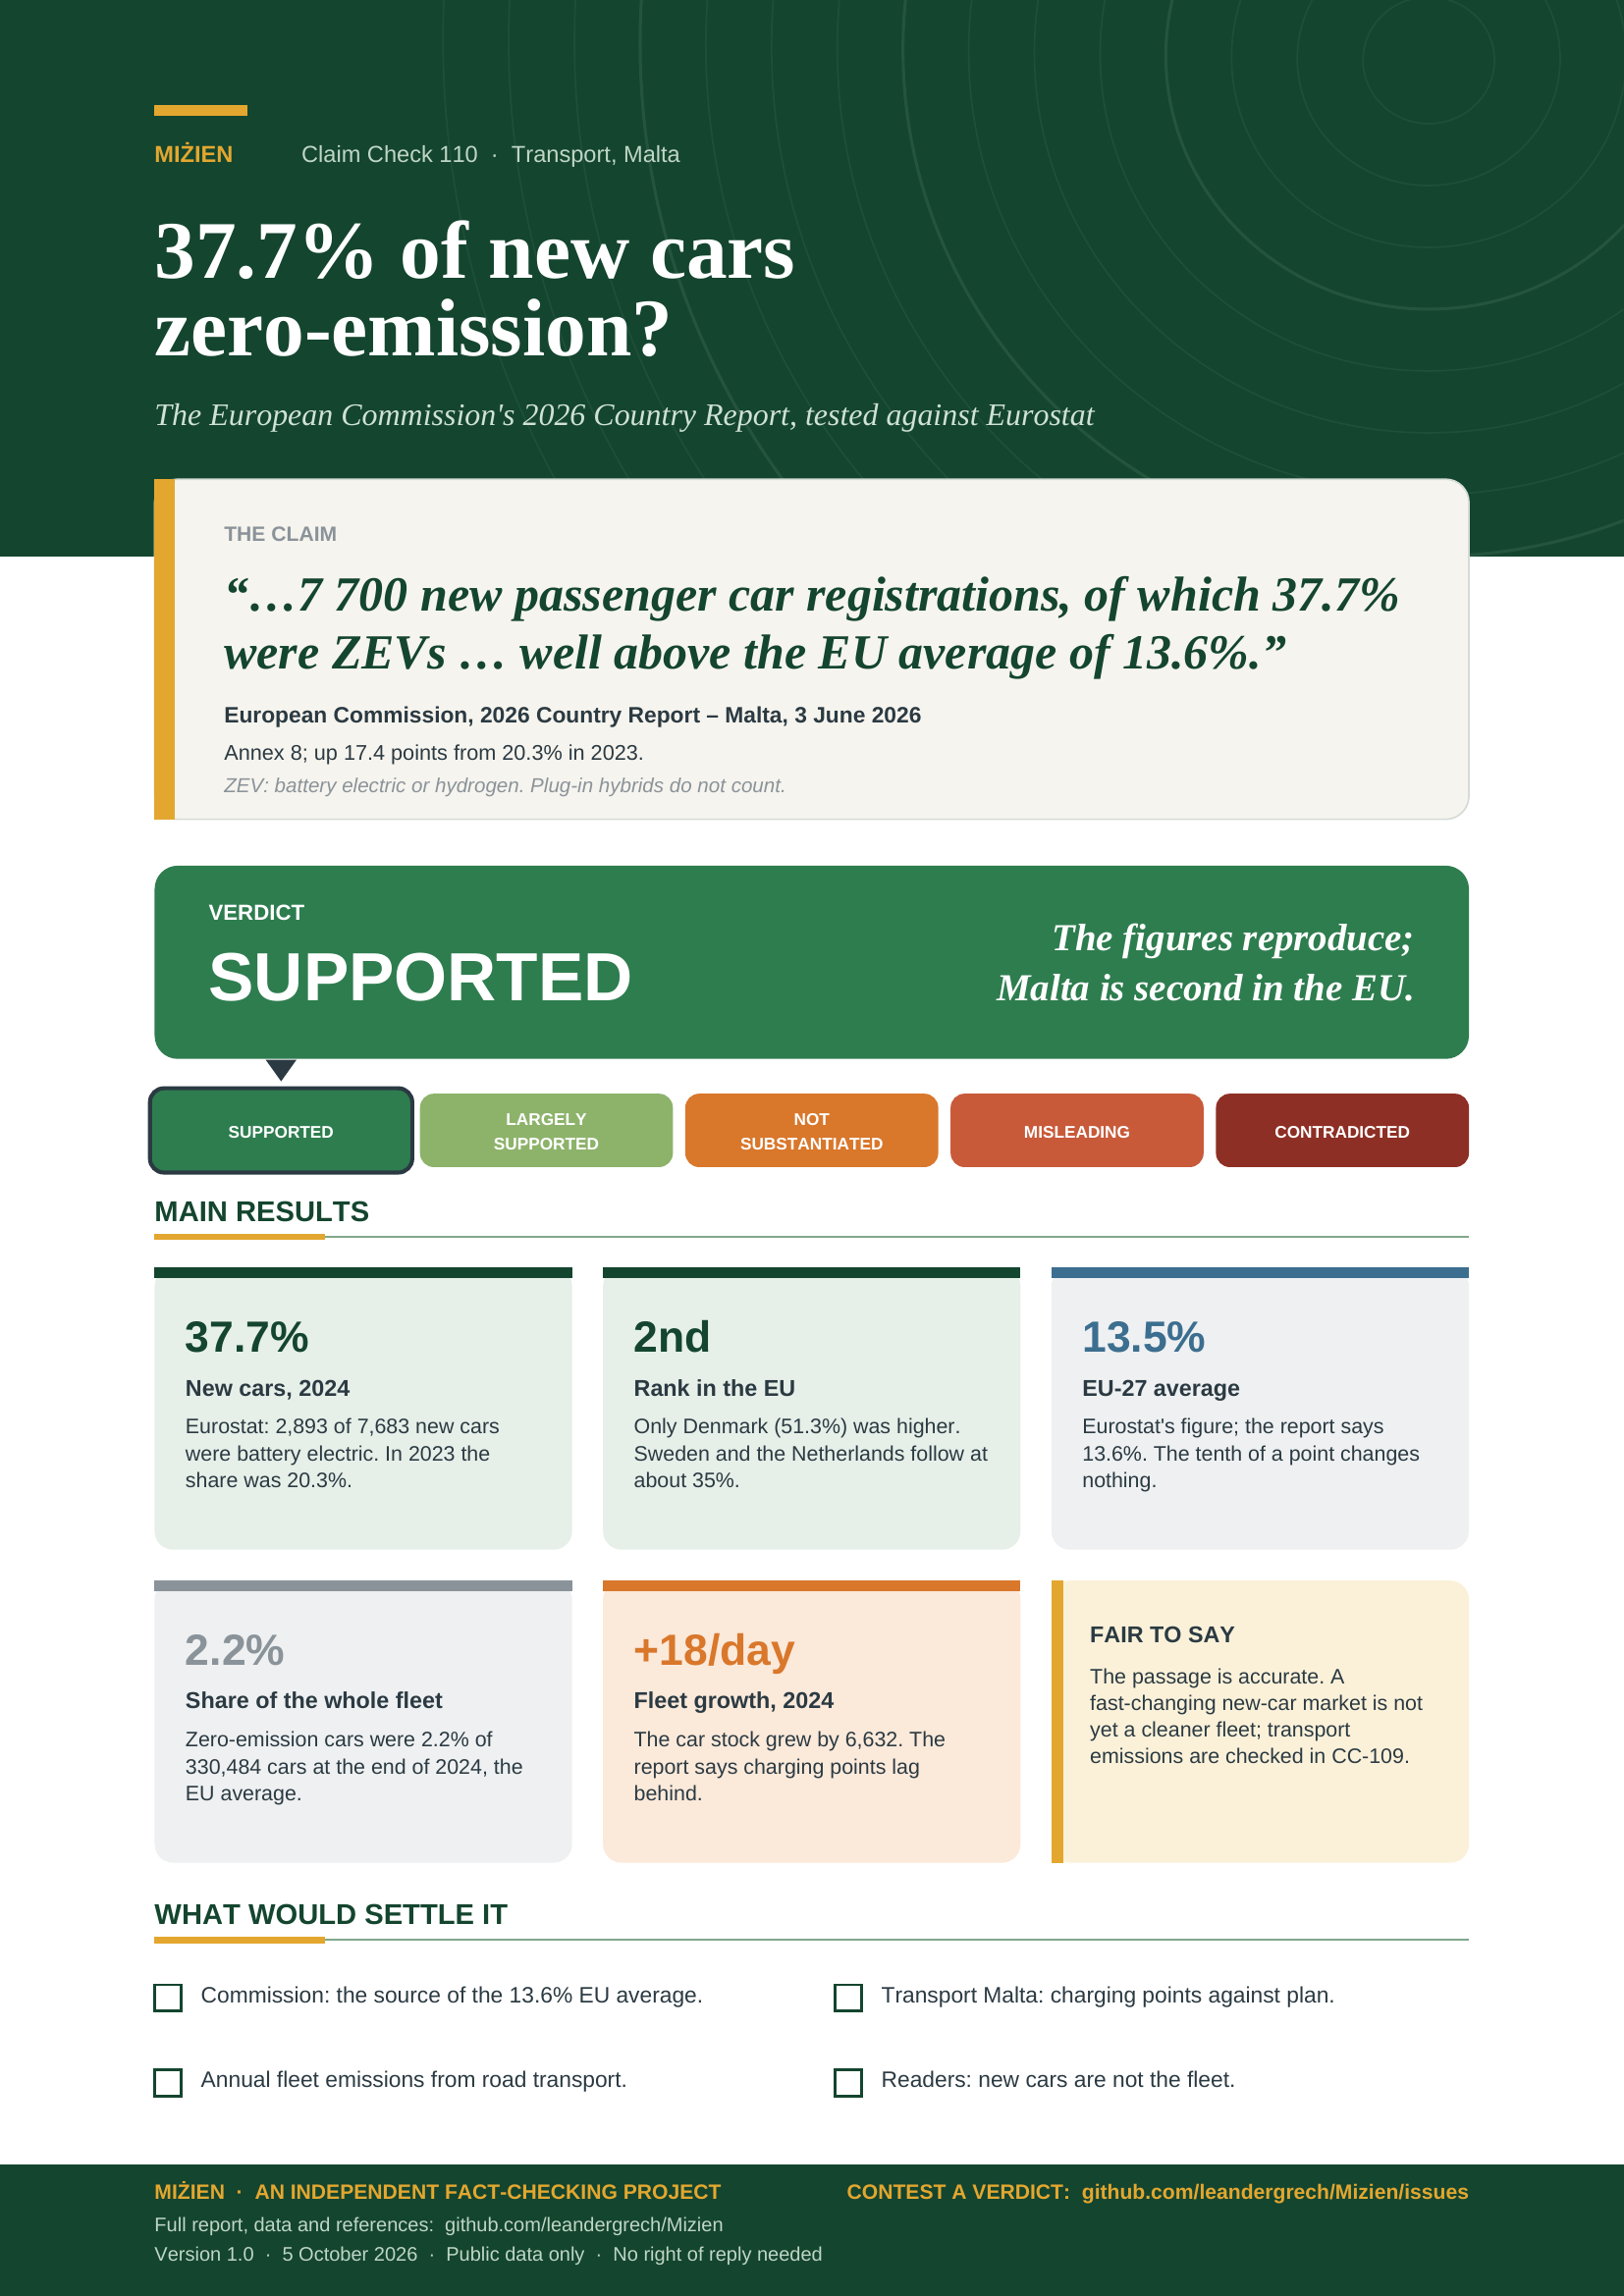
37.7% of new cars zero- emission?
Testing the European Commission’s 2026 Country Report against Eurostat registration data
“In 2024, Malta recorded 7 700 new passenger car registrations, of which 37.7% were ZEVs … well above the EU average of 13.6%.”
European Commission, 2026 Country Report – Malta, 3 June 2026.
Annex 8, on the decarbonisation of Malta’s vehicle fleet.
Verdict: Supported Malta is second in the EU for zero-emission new cars
Version 1.0 · 5 October 2026
TL;DR
In its 2026 Country Report on Malta (3 June 2026), the European Commission wrote: “In 2024, Malta recorded 7 700 new passenger car registrations, of which 37.7% were ZEVs – a 17.4 percentage point increase since 2023 (20.3%) and well above the EU average of 13.6%.” We re-ran the figures from Eurostat’s registration data.
- Malta’s figures are right. Eurostat records 7,683 new passenger cars in Malta in 2024, of which 2,893 were battery electric (none ran on hydrogen): 37.65%. In 2023 the share was 20.31%. The rise is 17.3–17.4 points depending on rounding.
- Malta is second in the EU. Only Denmark (51.3%) had a higher zero-emission share of new cars in 2024. Sweden (34.9%) and the Netherlands (34.6%) follow.
- The EU average differs by a tenth of a point. Eurostat’s EU-27 figure is 13.53% (13.5%); the report says 13.6% and we could not identify the source of the extra tenth. The difference does not affect the comparison.
- New cars are not the fleet. Zero-emission cars were 2.2% of Malta’s passenger-car stock at the end of 2024, the same as the EU average, and the stock grew by 6,632 cars (18 a day). The report itself goes on to say charging infrastructure is lagging.
- Verdict: supported (high confidence). The statement is accurate and its comparison with the EU holds. 2025 data show the share stable at 37.6%.
- Supported
- Largely supported
- Not substantiated
- Misleading
- Contradicted
What would move the verdict up
None: Supported is the top of the scale.
What would move it down
A revision of the registration data, or evidence that the Maltese figure counts plug-in hybrids as zero-emission (Eurostat does not).
IN THIS REPORT
1 The claim and what we could verify
The passage is in Annex 8 of the Commission’s 2026 Country Report for Malta, SWD(2026) 218 final [1], read in full from the Council copy on 5 October 2026. Footnote (142) cites Eurostat’s “Passenger cars in the EU”. The report’s statistical annex gives the same series (“New zero-emission vehicles, electricity motor, %”: 15.40, 20.31, 37.66 for 2022–2024), and the report’s summary repeats the 37.7%. The passage also gives light commercial vehicles (16.6%, EU 6.1%); that is outside the claim as recorded and not tested.
| Source | What it says | Our access | Status |
|---|---|---|---|
| European Commission, 2026 Country Report – Malta, Annex 8 [1] | “In 2024, Malta recorded 7 700 new passenger car registrations, of which 37.7% were ZEVs – a 17.4 percentage point increase since 2023 (20.3%) and well above the EU average of 13.6%.” | Full text read (Council PDF), 5 Oct 2026. | The claim |
| Eurostat, road_eqr_carpda and road_eqs_carpda [2, 3] | New passenger cars and the car stock by type of motor energy, every member state. | Downloaded 5 Oct 2026 (data/cc-110/). | Primary data |
2 Method
Question. Do the figures reproduce, and is Malta “well above” the EU average?
Evidence. We downloaded Eurostat’s new passenger cars by type of motor energy (road_eqr_carpda, updated 1 September 2026) for every member state and the EU-27, 2019–2025, and the passenger-car stock (road_eqs_carpda) for Malta and the EU-27 (tools/cc-110-report/fetch.py). A zero-emission vehicle is battery electric or hydrogen fuel cell; plug-in hybrids are excluded. Every figure is recomputed in calc.py (outputs in data/cc-110/checks.csv). No Eurostat flags apply to the Malta values.
Grades. Official statistics are grade C. The claim is statistical; no literature is needed to test it. Verdicts follow the five-point scale in Appendix A.
3 What the data show
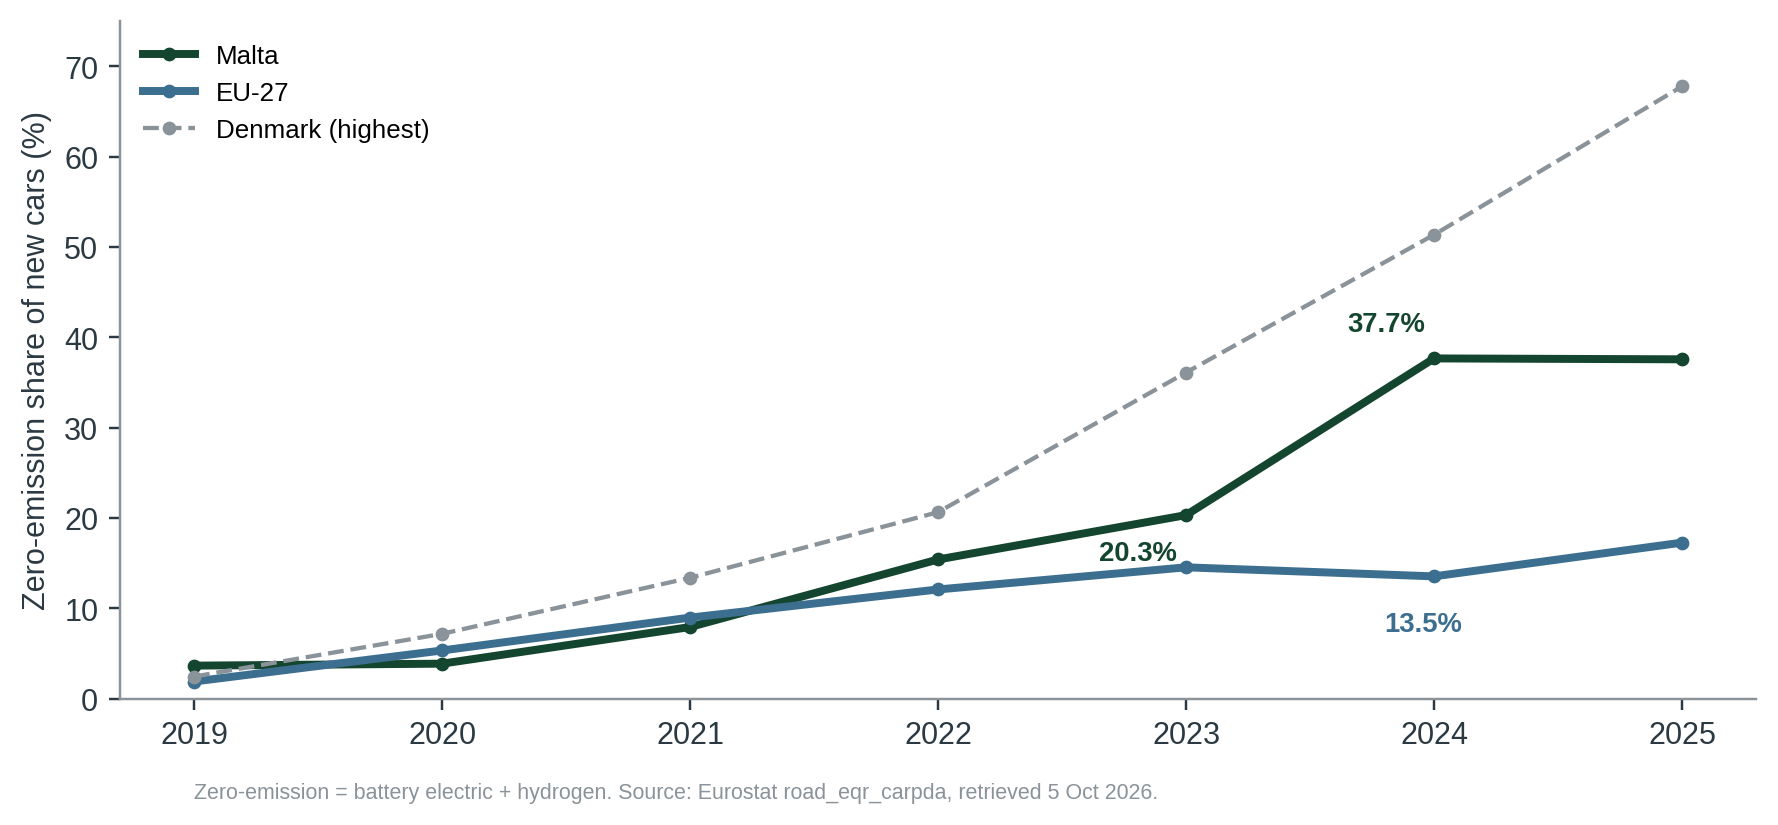
Malta’s share rose from 3.7% in 2019 to 15.4% in 2022, 20.3% in 2023 and 37.7% in 2024, and held at 37.6% in 2025. The EU-27 share was 14.5% in 2023 and 13.5% in 2024, before rising to 17.3% in 2025. Of Malta’s 7,683 new cars in 2024, 2,893 were battery electric and 508 plug-in hybrids (6.6%, not counted).
4 Where the evidence points different ways
Does a high share of new cars mean a cleaner fleet?
NOT YETWHAT THE SHARE SHOWS
Malta’s new-car market moved faster than all but one member state, and the stock of zero-emission cars nearly doubled in 2024 (4,364 to 7,301).
WHAT IT DOES NOT SHOW
Zero-emission cars were 2.2% of the 330,484 passenger cars at the end of 2024, the EU average. The fleet grew by 6,632 cars in 2024, about 18 a day. The same report notes that Malta had installed about a quarter of the charging infrastructure needed for its 2030 targets.
5 Testing the claim
| Sub-claim | Said by | What the evidence shows | Rating |
|---|---|---|---|
| A. 7 700 new passenger cars in 2024, 37.7% of them zero-emission | Commission [1] | Eurostat: 7,683 new cars, 2,893 battery electric, no hydrogen: 37.65%. | ACCURATE |
| B. Up 17.4 points from 20.3% in 2023 | Commission [1] | 2023 share 20.31%. The rise is 17.34 points from unrounded shares, 17.35 from the report’s own annex values. | ACCURATE |
| C. Well above the EU average of 13.6% | Commission [1] | Eurostat EU-27: 13.53%. Malta is second of 27 member states, after Denmark. | ACCURATE |
6 Verdict and requests for evidence
The figures reproduce from Eurostat and Malta is second in the EU. Confidence: high.
Why. The registration count, both shares and the comparison with the EU reproduce from Eurostat; the EU average differs by 0.07 points, which changes nothing. What this verdict does not say. It does not say Malta’s car fleet or transport emissions are falling: new cars are a small part of the fleet, and the fleet keeps growing. Transport emissions are checked in CC-109.
Evidence we are asking for
- From the Commission: the source of the EU average of 13.6% (Eurostat gives 13.5%).
7 Limitations
- Registration statistics count first registrations in the country, including imported used cars only where national practice does; definitions follow Eurostat’s road transport methodology.
- We did not test the light commercial vehicle figures in the same passage.
- We read the report in its Council copy; the Commission’s own publication should be identical.
References
- [1] European Commission (3 June 2026). 2026 Country Report – Malta. SWD(2026) 218 final; Council document 10135/26 ADD 1. Annex 8 and statistical annex. https://data.consilium.europa.eu/doc/document/ST-10135-2026-ADD-1/en/pdf
- [2] Eurostat. New passenger cars by type of motor energy (road_eqr_carpda), updated 1 Sep 2026, retrieved 5 Oct 2026. https://ec.europa.eu/eurostat/databrowser/view/road_eqr_carpda/default/table
- [3] Eurostat. Passenger cars by type of motor energy (road_eqs_carpda), retrieved 5 Oct 2026. https://ec.europa.eu/eurostat/databrowser/view/road_eqs_carpda/default/table
- [4] MiŻien. Calculation script and outputs: tools/cc-110-report/calc.py; data/cc-110/checks.csv.
Appendix A: series standards and verdict scale
Every investigation in this series follows the same rules so that verdicts are comparable and challengeable.
| Verdict | Meaning |
|---|---|
| SUPPORTED | Evidence consistently backs the claim as stated. |
| LARGELY SUPPORTED | Backed by the evidence, with minor caveats that do not change the substance. |
| NOT SUBSTANTIATED | Stated more strongly than the evidence offered or available allows. May be true in some conditions but has not been shown. |
| MISLEADING | Omits material facts so that the overall impression is inaccurate, even if individual statements are defensible. |
| CONTRADICTED | The available evidence points against the claim. |
Confidence
High: multiple independent lines of evidence agree. Moderate: evidence is relevant but incomplete or indirect. Low: evidence is thin, second-hand or conflicting.
Evidence grades
A experiment · B observational study with a control or gradient · C review, guidance or official statistics · D assertion or anecdote. ◆ marks a source known only second-hand.
Standards
- Quote the speaker, not the headline, with outlet and date, and link the original where possible.
- Separate the claim from the evidence offered for it, and say who made which statement.
- Grade the evidence and show differing views side by side where the evidence is unsettled.
- State what we could not access or verify, and what would change the verdict either way.
- Ask for the missing evidence in specific, answerable requests.
- Offer a right of reply where a check finds a claim Not substantiated, Misleading or Contradicted (or a pledge Not measurable, Off track or Missed), before wider circulation, and append responses.
- Correct errors openly with a version number and change log.
- Whistle-blow only on evidence: a verdict of Misleading or Contradicted requires documents or data that can be shown, not inference.
- Check every side. Government, opposition, NGOs and developers are held to the same standard.
Appendix B: revision log
| Version | Date | Change |
|---|---|---|
| 1.0 | 5 Oct 2026 | First issue. Verdict Supported (high confidence); no right of reply needed. |
Sources and archived copies
-
2026 Country Report - Malta, SWD(2026) 218 final (Council doc. 10135/26 ADD 1), European Commission (via Council of the EU), 2026-06-03.
Original · Archived copy
The claim. Full text read 5 Oct 2026: Annex 8 (quoted passage; footnote 142 cites Eurostat) and statistical annex. -
New passenger cars by type of motor energy (road_eqr_carpda); passenger cars (road_eqs_carpda), Eurostat, updated 1 Sep 2026.
Original · Archived copy
Primary data, retrieved 5 Oct 2026; extract and checks in data/cc-110/.
Right of reply
Not needed: this check finds the claim supported. A right of reply is sought when a check finds a claim Not substantiated, Misleading or Contradicted.
Connections
How this claim relates to the others: who made it, the themes it shares with other claims, and the patterns it shows. A connection is a reason to read two checks side by side. It does not make either one right or wrong. How connections are found.
Who made it
Other claims by European Commission 10
- CC-005 “92% excellent” bathing water (Supported)
- CC-094 Commission: Malta to emit more in 2030 than in 2005 (Supported)
- CC-101 EU: no registration or prior authorisation of water abstraction in Malta (Largely supported)
- CC-109 EU: transport is 48% of effort-sharing emissions (Largely supported)
- CC-111 EU: 621 kg of waste a head, 74% landfilled (Supported)
- CC-117 EU: Malta missed recycling targets (reasoned opinion) (not yet checked)
- CC-125 EU: Malta Social Climate Plan EUR 60.6 million (not yet checked)
- CC-127 EU: Malta has the lowest organic share in the EU (not yet checked)
- CC-128 EU: Malta missed the water-plan timetable (not yet checked)
- CC-129 EU: Malta has not updated its air pollution programme (not yet checked)
Linked directly 5
Claims that share a theme with this one. A theme is a cause, a mechanism, a target or a way of presenting figures that the editors have found in several claims; its strength says how close the link is.
Transport, air and climate Shared driver · Strong
Fleet growth links traffic claims, air quality and emissions. The climate report names transport and buildings as the lagging sectors.
Selective-metric pattern Rhetorical pattern · Pattern, not causal
A favourable metric is cited while the regulator-relevant metric looks worse. Useful for tagging, not for implying a common cause.
Two steps away 15
Not linked to this claim directly, but linked to a claim that is. These are found by following the links, not chosen by the editors, so they are looser: they show where one theme meets another.
- CC-003 Per-capita emissions vs 2030 projection (Misleading)through Selective-metric patternCC-007Transport, air and climate or Transport, air and climateCC-026Transport, air and climate or Transport, air and climateCC-1092030 carbon target
- CC-004 'Strong progress' in waste separation (Not substantiated)through Selective-metric patternCC-007Selective-metric pattern
- CC-008 Flyovers and congestion (Not substantiated)through Selective-metric patternCC-007Transport, air and climate or Transport, air and climateCC-072Transport, air and climate or Transport, air and climateCC-109Transport, air and climate
- CC-010 Tree-planting counts (Largely supported)through Selective-metric patternCC-007Selective-metric pattern
- CC-016 Shore-to-ship: 90% less harbour pollution (Misleading)through Selective-metric patternCC-007Transport, air and climate
- CC-020 EP study: noise law not the cause (Largely supported)through Selective-metric patternCC-007Compliance-not-health pattern
- CC-021 Malta-Gozo tunnel traffic (not yet checked)through Selective-metric patternCC-007Transport, air and climate
- CC-025 Per-capita emissions down 44% since 2005 (Largely supported)through Transport, air and climateCC-026Selective-metric pattern
- CC-031 Gozo, first climate-neutral region (Largely supported)through Transport, air and climateCC-026Shared emissions figures or Transport, air and climateCC-109Shared emissions figures
- CC-033 Delimara: 'much cleaner air' (not yet checked)through Selective-metric patternCC-007Compliance-not-health pattern
- CC-035 PM2.5 death rate down two-thirds (Largely supported)through Selective-metric patternCC-007Transport, air and climate
- CC-071 EUR 100m a year for free buses (Not substantiated)through Transport, air and climateCC-072Transport, air and climate
- CC-094 Commission: Malta to emit more in 2030 than in 2005 (Supported)through Transport, air and climateCC-1092030 carbon target
- CC-114 PN: only EU state with rising emissions intensity (Misleading)through Transport, air and climateCC-026Shared emissions figures
- CC-115 Chamber: congestion cost EUR 770m, 3.4% of GDP (Not substantiated)through Transport, air and climateCC-109Transport, air and climate
Three steps away 21
One step further again. At this distance a connection says more about how the themes fit together than about this claim.
- CC-001 Upper Barrakka concrete (Not substantiated)through Selective-metric patternCC-007Transport, air and climateCC-008Sealed soil and concrete
- CC-002 Comino tree compensation (Largely supported)through Selective-metric patternCC-007Selective-metric patternCC-004Waste and construction
- CC-011 Ten minutes' walk to green space (pledge: Not measurable)through Selective-metric patternCC-007Transport, air and climateCC-0032030 carbon target
- CC-012 Ta' Qali gravel and grass (Contradicted)through Selective-metric patternCC-007Transport, air and climateCC-008Sealed soil and concrete
- CC-017 Land reclamation outside the Freeport (Not substantiated)through Selective-metric patternCC-007Selective-metric patternCC-004Waste and construction
- CC-019 830,000 m2 of land lost in five years (Not substantiated)through Selective-metric patternCC-007Transport, air and climateCC-008Sealed soil and concrete
- CC-022 'Lowest electricity burden in the EU' (Largely supported)through Transport, air and climateCC-026Selective-metric patternCC-025Selective-metric pattern
- CC-054 Project Green: 100,000 m2 a year (not yet checked)through Selective-metric patternCC-007Selective-metric patternCC-010Replanting as currency
- CC-056 Central Link: 'only 254 trees' (not yet checked)through Selective-metric patternCC-007Transport, air and climateCC-008Replanting as currency
- CC-057 1,649 compensation trees (not yet checked)through Selective-metric patternCC-007Selective-metric patternCC-010Replanting as currency
- CC-069 82 million bus trips (not yet checked)through Selective-metric patternCC-007Transport, air and climateCC-008Transport, air and climate
- CC-076 36 more vehicles a day (Supported)through Selective-metric patternCC-007Transport, air and climateCC-008Transport, air and climate
- CC-079 Waste-to-energy: 4.5% of energy (Misleading)through Selective-metric patternCC-007Selective-metric patternCC-004Waste and construction
- CC-081 Landfill share rising (not yet checked)through Selective-metric patternCC-007Selective-metric patternCC-004Waste and construction
- CC-092 PN: afforestation in a net-zero Gozo (pledge: Not measurable)through Transport, air and climateCC-026Shared emissions figuresCC-031Net-zero Gozo
- CC-104 PN: Malta fails EU noise law (not yet checked)through Selective-metric patternCC-007Compliance-not-health patternCC-020Noise governance
- CC-105 ADPD: no study of Freeport and airport noise (Largely supported)through Selective-metric patternCC-007Compliance-not-health patternCC-020Noise governance
- CC-107 A net-zero Gozo by 2040 (pledge: Not measurable)through Transport, air and climateCC-026Shared emissions figuresCC-031Net-zero Gozo
- CC-111 EU: 621 kg of waste a head, 74% landfilled (Supported)through Selective-metric patternCC-007Selective-metric patternCC-004Waste and construction
- CC-117 EU: Malta missed recycling targets (reasoned opinion) (not yet checked)through Selective-metric patternCC-007Selective-metric patternCC-004Waste and construction
- CC-120 EP study: 54,000 exposed to road noise, likely an underestimate (Largely supported)through Selective-metric patternCC-007Compliance-not-health patternCC-020Noise governance
Timeline
What was said, what was published before and after it, and each step of this check, in date order. Statements and sources carry the date they were published. The steps of the check carry the date the research was done, from the check's research log. Other statements by the same body on the same topic show whether a position was repeated, changed or corrected.
2026
- 3 June 2026 The statement European Commission (this claim)
- 3 June 2026 Statement by European Commission on Transport CC-109 EU: transport is 48% of effort-sharing emissions (Largely supported)
- 3 June 2026 Evidence published 2026 Country Report - Malta, SWD(2026) 218 final (Council doc. 10135/26 ADD 1), European Commission (via Council of the EU)
- 1 September 2026 Evidence published New passenger cars by type of motor energy (road_eqr_carpda), Eurostat
- 5 October 2026 Added to the claims to check
- 5 October 2026 Exact wording found Commission 2026 Country Report read in full (Council copy): Annex 8 passage, footnote 142 and statistical annex.
- 5 October 2026 Note Eurostat road_eqr_carpda and road_eqs_carpda downloaded for all member states; shares and ranking recomputed (tools/cc-110-report/calc.py).
- 5 October 2026 Version 1.0: first issue First issue. Verdict Supported (high confidence); no right of reply needed. Verdict in this version: Supported, high confidence.
- 5 October 2026 Evidence reviewed
2027
- 5 October 2027 Coming up: Evidence review due Each finished check is reviewed against new evidence within a year.
Every change to this claim's record is public: history of the record.
Download the report and flyer