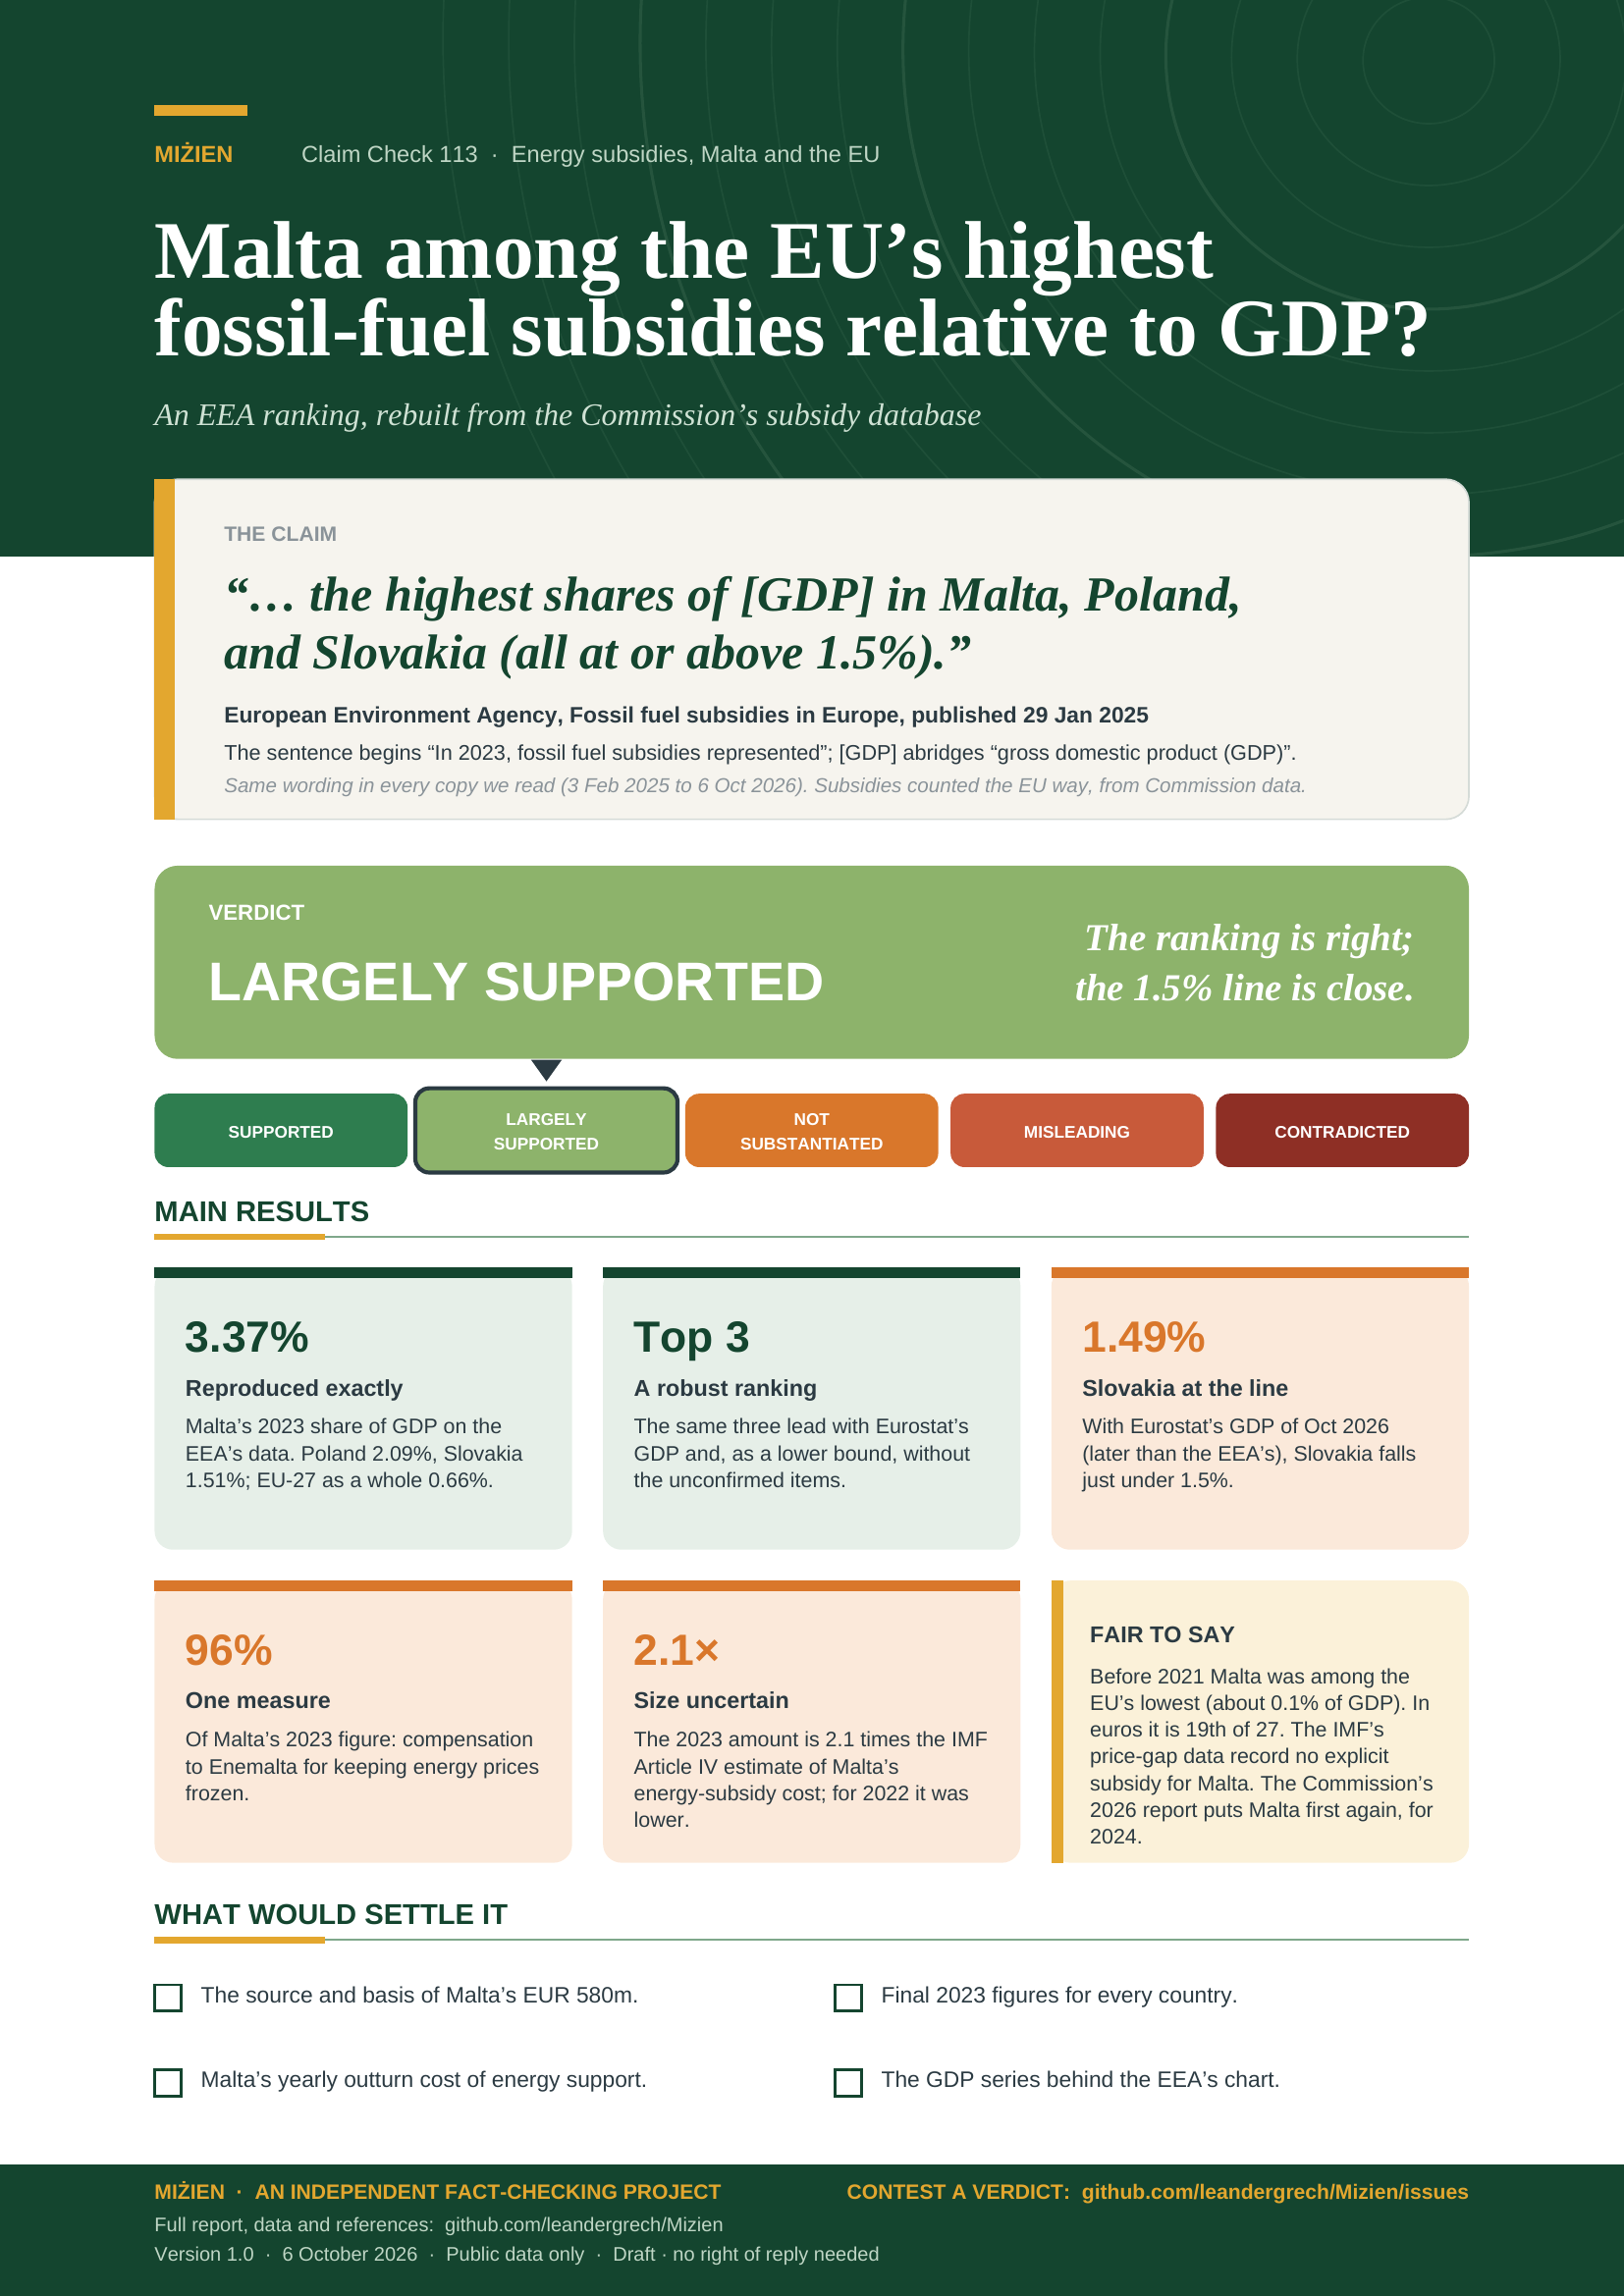
CC-113 · Climate & Energy · Electricity & grid
EEA: Malta among highest fossil-fuel subsidies relative to GDP
Largely supported Moderate confidence Draft: no right of reply needed
Parts of this claim
The claim is split into parts that are tested separately, as in the report below. Each part has its own number.
- CC-113A In 2023 the highest shares of GDP were in Malta, Poland and SlovakiaRebuilt from the Commission database: Malta 3.37%, Poland 2.09%, Slovakia 1.51%, then Croatia 1.15% [3, 4]; the Commission’s own chart of 28 Jan 2025 shows the same [19]. The same three lead with Eurostat’s GDP and, as a lower bound, with the unconfirmed items set to zero [5].
- CC-113B “all at or above 1.5%”True on the EEA’s basis (Slovakia 1.507%). With Eurostat’s GDP of 6 Oct 2026 (later than the EEA could have used) Slovakia is 1.49%; with the unconfirmed items set to zero (a lower bound), 1.39%. Malta and Poland clear the line in every version [4, 5].
- CC-113C Malta’s share, 3.37% of GDP, the highest (the EEA’s linked chart)Reproduced exactly; 3.03% with Eurostat’s GDP of 6 Oct 2026; first in the Commission’s 2024 data too [8]. 96% is one EUR 580m line; the total is 2.1 times the IMF Article IV estimate of the 2023 cost and 1.7 times the Government’s, though in 2022 the database was lower than both [10, 12].
- CC-113D Malta’s support is a fossil-fuel subsidyYes under the EU reporting method, which the EEA states; the IMF’s price-gap database records none, and the OECD/IISD tracker has no OECD or IEA estimate for Malta [9, 13, 14]. The database books Malta’s main line wholly to natural gas, although 21.7% of the 2023 electricity supply was imported [4, 20]; the rank does not change.
Claim Check 113 · EU data and energy subsidies
Malta among the EU’s highest fossil-fuel subsidies relative to GDP?
Testing an EEA ranking against the Commission’s subsidy database, Eurostat GDP and other measures
“In 2023, fossil fuel subsidies represented the highest shares of gross domestic product (GDP) in Malta, Poland, and Slovakia (all at or above 1.5%).”
European Environment Agency, Fossil fuel subsidies in Europe (indicator), published 29 Jan 2025.
Wording unchanged in every copy we read, 3 Feb 2025 to 6 Oct 2026; data from the European Commission.
Verdict: Largely supported Ranking reproduced; Slovakia sits at the 1.5% line
Version 1.0 · 6 October 2026
TL;DR
The European Environment Agency’s indicator page Fossil fuel subsidies in Europe (29 January 2025) says: “In 2023, fossil fuel subsidies represented the highest shares of gross domestic product (GDP) in Malta, Poland, and Slovakia (all at or above 1.5%).” We rebuilt the figures from the Commission’s subsidy database that the EEA used and compared other measures of Malta’s support.
- The EEA reports its data faithfully. Rebuilt from the Commission’s subsidy database, every share on the EEA’s chart reproduces to two decimals: Malta 3.37% of GDP, Poland 2.09%, Slovakia 1.51%, then Croatia 1.15%; the EU-27 as a whole 0.66% (total over EU GDP, not an average). The Commission’s report of 28 January 2025 shows the same top four [19]. In euros Malta is 19th of 27.
- The top three holds; the 1.5% line is a near thing. The same three lead with Eurostat’s GDP of 6 October 2026 (which the EEA could not have had) and, as a lower bound, with unconfirmed items set to zero. Slovakia then falls to 1.49% or 1.39%.
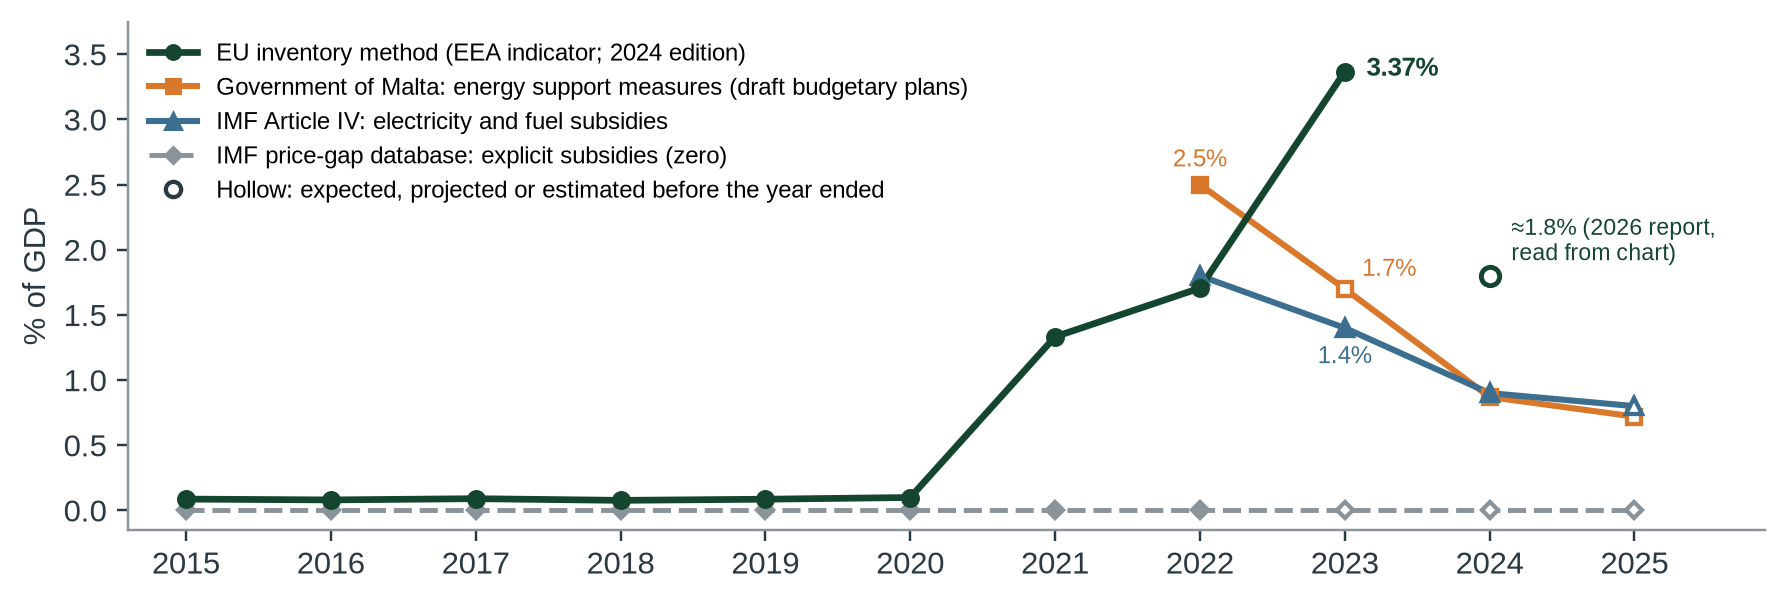
- Malta went from near the bottom to the top. Its share was 0.08–0.10% of GDP in 2015–2020 (24th to 27th of 27). In 2023, 96% of its EUR 605 million was one measure, compensation to Enemalta for keeping prices at pre-COVID levels, booked as natural-gas price support.
- Other yardsticks differ, and not in one direction. For 2022 the database is lower: 1.71% of GDP (Enemalta line EUR 247 million) against the Government’s 2.5% (about EUR 451 million) and the IMF’s 1.8% (about EUR 325 million). For 2023 it is higher: EUR 580 million against about EUR 356 million (Government, expected) and EUR 293 million (IMF). Over 2022–23 the line (EUR 827 million) is close to the Government’s expected cost (about EUR 806 million): timing or basis. For 2024 the gap persists (about 1.8% against 0.87%). The IMF’s price-gap data show no explicit subsidy.
- Verdict: largely supported (moderate confidence). The ranking is right on the EEA’s data and in every variant tested. Slovakia’s “at or above 1.5%” rests on provisional data; Malta’s EUR 580 million line (booked as actual costs) is not reconciled with other sources.
- Supported
- Largely supported
- Not substantiated
- Misleading
- Contradicted
What would move the verdict up
Final 2023 figures from the Commission’s 2025-edition database that keep Slovakia at or above 1.5%, and a documented source for Malta’s EUR 580 million that reconciles it with the Government’s and the IMF’s figures.
What would move it down
Final 2023 figures that take Malta, Poland or Slovakia below Croatia’s 1.15%. For Malta that is under about EUR 216 million (1.15% × EUR 18,797 million) on the EEA’s basis, below even the IMF-based EUR 293 million, for example if the EUR 580 million were misbooked or counted twice.
IN THIS REPORT
1 The claim and what we could verify
The claim is the EEA’s own text, on the indicator page that tracks the EU’s commitment to phase out fossil-fuel subsidies [1]. The EEA is an EU agency; we assess its statement, not any Maltese authority’s. Our claim record summarises the sentence; the quotation below is the EEA’s wording.
| What the EEA says | Where | Access |
|---|---|---|
| “In 2023, fossil fuel subsidies represented the highest shares of gross domestic product (GDP) in Malta, Poland, and Slovakia (all at or above 1.5%). Countries with the lowest shares were Austria, Denmark, and Estonia (less than 0.2% of GDP).” | Indicator page, “Disaggregate level assessment” [1] | Read in full, 6 Oct 2026; same wording on 3 Feb 2025 and 26 Nov 2025 [2] |
| Linked chart: “Fossil fuel subsidies as a share of national GDP, 2023”, with a note that 2023 data are provisional and use 2022 values for about 7% of the total | Chart page [3] | Chart data downloaded |
| Data source: “DG ENER study on energy subsidies” (“direct link to the datasets is not available”) | Indicator metadata [1] | Found: the Commission’s subsidy database on CIRCABC [4, 21] |
Has the page changed? It shows “Published 29 Jan 2025”; its metadata record an edit on 29 July 2025. We could not open archived copies (the Wayback Machine and archive.today refused connections from our network), but the EEA itself serves two fixed copies: a browser print made on 3 February 2025 and the PDF in its 8th EAP monitoring report 2025 (26 November 2025). Both carry the sentence word for word [2]. The only difference we found is the label of the linked chart: “2020” in February 2025, “2023” now; the chart itself is for 2023 [3]. Two smaller slips remain on the live page: its method note still says the data were “deflated to 2022 prices” (the figures are in 2023 prices), and it calls the Commission’s report “forthcoming”, although it was adopted on 28 January 2025 [19].
2 Method
Question. In 2023, were fossil-fuel subsidies the highest share of GDP in Malta, Poland and Slovakia, were all three at or above 1.5%, and how robust is that to the GDP series, to the provisional items and to the definition of a fossil-fuel subsidy?
Evidence. On 6 October 2026 we downloaded the EEA’s chart data [3], the Commission’s Inventory of energy subsidies in the EU27, 2024 edition, which lists every measure by country and year [4], Eurostat GDP at current prices [5], Eurostat’s general-government subsidies for Malta [15] and its electricity supply [20]. tools/cc-113-report/calc.py rebuilds each country’s 2023 total from the measure rows (kept locally: the database is Enerdata’s copyright, so only country totals and five Malta figures are in data/cc-113/) and recomputes the shares four ways: with the 2022 stand-ins (A, B) or, as a lower bound, with the unconfirmed items set to zero (C, D); with the database’s GDP (A, C) or Eurostat’s of 6 October 2026 (B, D). We compared the Government’s draft budgetary plans [10, 11], the IMF’s Article IV report [12], the IMF’s price-gap database [13] and the OECD/IISD tracker [14], and read the Commission’s 2024 report, COM(2025) 17 [19], whose Figure 16 gives the 2023 shares as of 28 January 2025 (we measured its bars), its newest report (17 September 2026) [8] and a paper on definitions [9]. Crossref was searched for peer-reviewed work on Malta’s energy price policy; none was found.
Grades. Official statistics, agency indicators and official reports are grade C under our scale. Verdicts follow the five-point scale in Appendix A.
3 What counts as a fossil-fuel subsidy
There is no single definition. A Commission discussion paper sets out the main approaches: inventories list budget transfers, tax breaks and price supports measure by measure; price-gap methods compare what users pay with a reference price; the IMF adds unpriced environmental costs [9]. Differences in scope and method “can have a large impact on total estimated amounts and comparability between countries” [9]. A peer-reviewed review discusses the common definitions [17], and a peer-reviewed study argues that subsidy inventories should be read together with carbon pricing, as a “net carbon price” [18].
| Measure | What it counts | Malta |
|---|---|---|
| EU inventory (EEA indicator; Commission subsidy reports under the Governance Regulation) [4, 8, 9] | WTO categories: direct transfers, tax expenditures, income or price support, R&D. Bottom-up, measure by measure. Electricity support counted as fossil by the share of fossil fuels in the power mix, but Malta’s main line is booked wholly to natural gas (below). | 2023: EUR 605m, or 633m with the 2022 stand-in; 3.37% of GDP on the EEA’s basis; first of 27 |
| Government of Malta, draft budgetary plans [10, 11] | Cost of energy support: lower indirect taxes on energy, and subsidies for the higher cost of imported fuels, electricity and other basic commodities | 2.5% of GDP (2022), 1.7% (2023, expected), 0.87% (2024) |
| IMF Article IV [12] | Fiscal cost of untargeted electricity and fuel subsidies | 1.8% of GDP (2022), 1.4% (2023), 0.9% (2024) |
| IMF price-gap database [13] | Explicit: supply cost above the retail price. Implicit: unpriced environmental costs and forgone VAT | Explicit: zero in every year. Explicit plus implicit: 2.27% (2023), 15th of 27 |
| OECD inventory, IEA price gap (via the OECD/IISD tracker) [9, 14] | OECD: budget transfers and tax expenditures. IEA: price gap | The tracker carries no OECD or IEA estimate for Malta, only the IMF’s zero |
Table 1. The same support, measured five ways. Shares of GDP as each source gives them.
Malta’s energy price stabilisation
Malta has kept retail energy prices fixed through the price crisis: the Commission’s 2024 country report notes that 2023 inflation reached 5.6% “with energy prices being kept at 2020 levels” [16]. The database describes its largest Maltese item, “Energy Support Measures”, as energy prices “frozen to their pre-COVID levels as the Governement [sic] is compensating Enemalta for the losses”, and classes it as natural-gas income or price support (a consumer price guarantee), created for the price crisis [4]. Under the EU method that is a fossil-fuel subsidy. The IMF’s price-gap database, which compares retail prices with supply costs fuel by fuel, records no explicit subsidy for Malta in any year [13]; we did not find why Malta’s frozen prices do not register in it.
Caveat on the power mix. The database books the Enemalta line wholly to natural gas, so the pro-rating by the power mix described in Table 1 was not applied to it. In 2023 Malta imported 648 of the 2,992 GWh of electricity it supplied from production plus imports (21.7%) [20]. Leaving out only that import share of the line would put Malta’s 2023 share at 2.70% on the EEA’s basis, still first of 27: a bound on one part of the question, not an estimate, since imports are not all non-fossil and we did not model the domestic mix.
4 What the data show
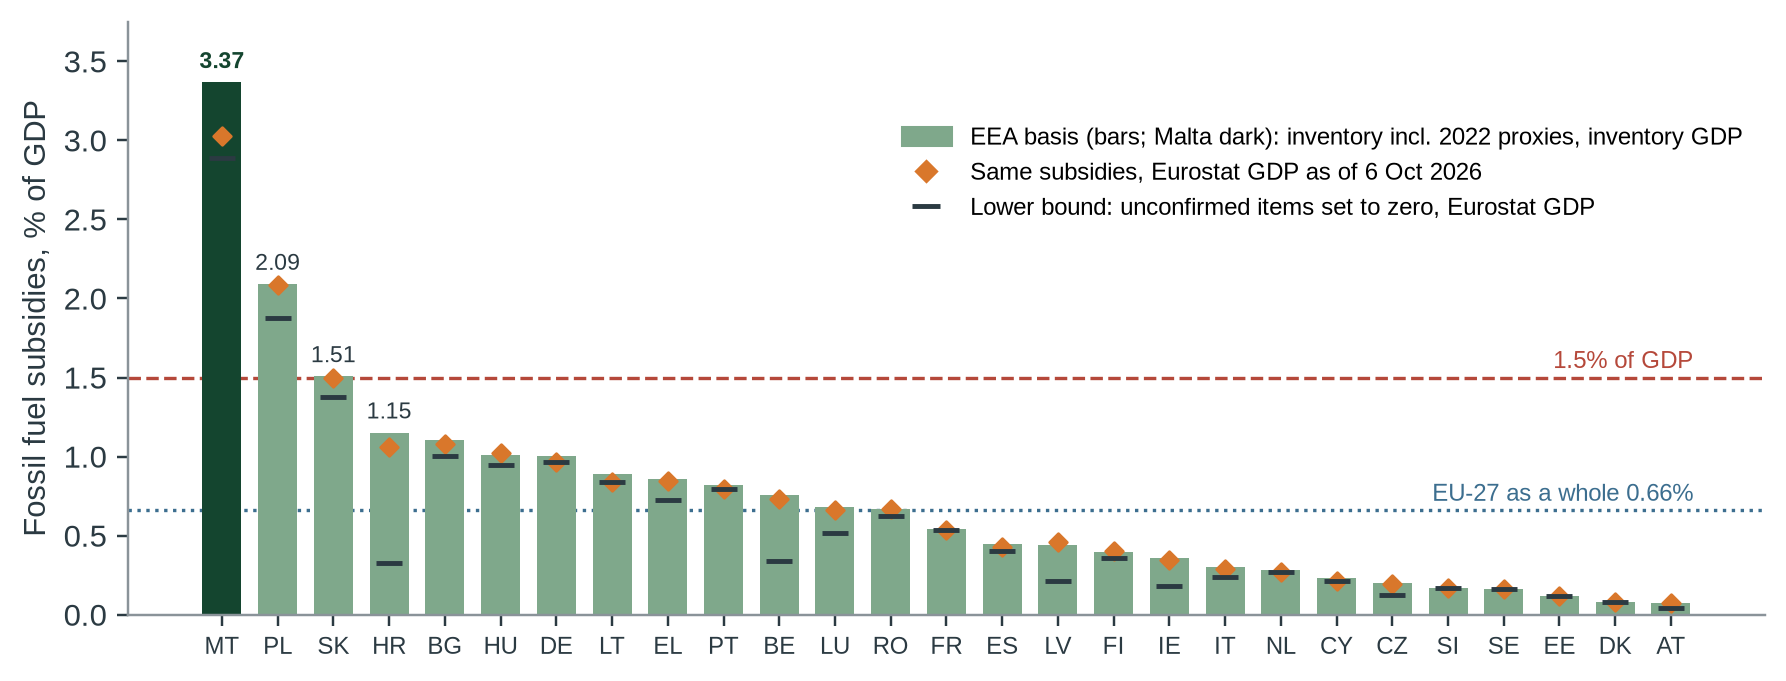
| Version (2023) | Malta | Poland | Slovakia | Fourth | At or above 1.5% |
|---|---|---|---|---|---|
| A. EEA basis: with stand-ins, database GDP | 3.37% | 2.09% | 1.51% | Croatia 1.15% | Malta, Poland, Slovakia |
| B. With stand-ins, Eurostat GDP of 6 Oct 2026 | 3.03% | 2.08% | 1.49% | Bulgaria 1.08% | Malta, Poland |
| C. Lower bound: unconfirmed items zero, database GDP | 3.22% | 1.89% | 1.39% | Bulgaria 1.02% | Malta, Poland |
| D. Lower bound: unconfirmed items zero, Eurostat GDP of 6 Oct 2026 | 2.89% | 1.88% | 1.38% | Bulgaria 1.00% | Malta, Poland |
Table 2. Sources: Commission subsidy database, 2024 edition [4]; Eurostat nama_10_gdp, current prices, no flags for 2023 [5]. C and D set the “to be confirmed” items to zero: a lower bound, not an equally valid version of the data. B and D use Eurostat’s GDP as of 6 October 2026, which the EEA could not have had in January 2025. The database’s GDP comes from IMF and World Bank data via Enerdata: for Malta EUR 18.8 billion, against Eurostat’s EUR 20.9 billion (11.3% higher); for Slovakia the gap is 0.9%. The stand-ins are 7.4% of the EU total (EEA: “about 7%”); Slovakia’s are EUR 146 million. All values in data/cc-113/checks.csv and shares_2023_variants.csv.
| Malta’s fossil-fuel subsidies in the database | 2022 | 2023 | Type |
|---|---|---|---|
| Energy Support Measures (compensation to Enemalta; crisis measure) | 246.6 | 580.0 | Natural gas; price support |
| Gas Stabilisation Fund (crisis measure) | 17.2 | 15.0 | Natural gas; price support |
| Cut in excise duty on petrol and diesel (crisis measure) | 28.2 | to be confirmed (28.2 used) | Oil; tax expenditure |
| Excise exemptions: inland navigation, fishing, domestic flights | 9.5 | 8.5 | Oil; tax expenditure |
| Melita TransGas pipeline (Malta–Sicily) | 1.4 | 1.2 | Natural gas; grant |
| Total (with the stand-in) | 302.8 | 604.7 (632.9) |
Table 3. EUR million in 2023 prices [4]. The Enemalta line, the Gas Stabilisation Fund and the pipeline grant are flagged “Actual costs” in the database, the excise lines are estimates, and only the petrol-and-diesel excise cut is to be confirmed. In 2023, 96% of the total was the one line, and 98% was flagged as created for the price crisis. Before the crisis Malta’s fossil-fuel subsidies were EUR 10–15 million a year, 0.08–0.10% of GDP, 24th to 27th of 27 in 2015–2020; in 2021 the share was already 1.33%, first in the EU; in 2022, 1.71%, second to Croatia.
5 Where the evidence points different ways
Q1 Is Slovakia “at or above 1.5%”?
YES ON THE EEA’S DATA; BORDERLINEEVIDENCE FOR THE CLAIM
On the EEA’s basis Slovakia is 1.507% of GDP, printed 1.51% [3, 4]; the Commission’s own chart of 28 January 2025 reads about 1.51% [19]. The sentence describes the data the EEA used, and on those data it is right.
EVIDENCE AGAINST
With Eurostat’s GDP as of 6 October 2026, which the EEA could not have had, Slovakia is 1.494%; with the EUR 146 million of 2022 stand-ins set to zero (a lower bound) it is 1.39% [4, 5]. Malta and Poland clear 1.5% in every version.
Q2 How large was Malta’s support in 2023?
UNRESOLVED; THE RANK HOLDSEVIDENCE FOR THE DATABASE’S SIZE
The database records EUR 580 million for the Enemalta compensation in 2023, all of it crisis-related and flagged “Actual costs” [4]. That line alone is 3.09% of GDP; with the other items the total is 3.37% (3.03% with Eurostat’s GDP). In the Commission’s 2026 report Malta is again first, for 2024, at about 1.8% of GDP, with 80% of its energy subsidies on fossil fuels [8].
EVIDENCE FOR A DIFFERENT SIZE
For 2023 the Government expected energy support of 1.7% of GDP, other basic commodities included (about EUR 356 million with Eurostat’s GDP) [10], and the IMF gives 1.4% (about EUR 293 million) [12]. But in 2022 the database was the lower: 1.71% of GDP, the Enemalta line EUR 246.6 million, against the Government’s 2.5% (about EUR 451 million) and the IMF’s 1.8% (about EUR 325 million). Over 2022–23 the line (EUR 826.5 million) is close to the Government’s expected cost (about EUR 806 million). For 2024 the gap persists: about 1.8% against the Government’s 0.87% [8, 11]. Eurostat’s all-purpose subsidies fell from EUR 824 million (2022) to EUR 660 million (2023) [15].
Q3 Does Malta’s support count as a fossil-fuel subsidy?
YES, UNDER THE EU METHODEVIDENCE FOR THE CLAIM
The EU’s reporting method, codified under the Governance Regulation, counts income and price supports such as consumer price guarantees; the database classes the Enemalta compensation as natural-gas price support, and the Commission’s own reports use the same data [4, 8, 9]. The EEA states this definition on its page [1].
EVIDENCE AGAINST
The IMF’s price-gap database records no explicit subsidy for Malta, and the OECD/IISD tracker carries no OECD or IEA estimate for Malta [13, 14]. On the IMF’s wider measure, which adds unpriced environmental costs, Malta is 15th of 27 [13].
6 Testing the claim
| Sub-claim | What the evidence shows | Rating |
|---|---|---|
| A. In 2023 the highest shares of GDP were in Malta, Poland and Slovakia | Rebuilt from the Commission database: Malta 3.37%, Poland 2.09%, Slovakia 1.51%, then Croatia 1.15% [3, 4]; the Commission’s own chart of 28 Jan 2025 shows the same [19]. The same three lead with Eurostat’s GDP and, as a lower bound, with the unconfirmed items set to zero [5]. | ACCURATE |
| B. “all at or above 1.5%” | True on the EEA’s basis (Slovakia 1.507%). With Eurostat’s GDP of 6 Oct 2026 (later than the EEA could have used) Slovakia is 1.49%; with the unconfirmed items set to zero (a lower bound), 1.39%. Malta and Poland clear the line in every version [4, 5]. | LARGELY ACCURATE |
| C. Malta’s share, 3.37% of GDP, the highest (the EEA’s linked chart) | Reproduced exactly; 3.03% with Eurostat’s GDP of 6 Oct 2026; first in the Commission’s 2024 data too [8]. 96% is one EUR 580m line; the total is 2.1 times the IMF Article IV estimate of the 2023 cost and 1.7 times the Government’s, though in 2022 the database was lower than both [10, 12]. | LARGELY ACCURATE |
| D. Malta’s support is a fossil-fuel subsidy | Yes under the EU reporting method, which the EEA states; the IMF’s price-gap database records none, and the OECD/IISD tracker has no OECD or IEA estimate for Malta [9, 13, 14]. The database books Malta’s main line wholly to natural gas, although 21.7% of the 2023 electricity supply was imported [4, 20]; the rank does not change. | ACCURATE (OFFICIAL METHOD) |
The lowest shares. The sentence that follows the claim also holds: Austria 0.07%, Denmark 0.08% and Estonia 0.12% of GDP, all below 0.2% [3].
7 Verdict and requests for evidence
The ranking reproduces exactly and holds in every variant; Slovakia’s 1.5% rests on provisional data, and Malta’s 2023 line is not reconciled with other sources. Confidence: moderate.
Why. (1) Every figure behind the EEA’s sentence reproduces from the Commission database it used. (2) Malta, Poland and Slovakia are the top three with either GDP series and with or without the provisional items (the lower bound), so the ranking is robust. (3) The claim that all three are “at or above 1.5%” holds on the EEA’s basis but Slovakia sits at the line, falling just below it with Eurostat’s GDP of 6 October 2026 (which the EEA could not have had): a minor caveat. (4) Confidence is moderate, not high: all the EU-method figures come from one database; its 2023 values are provisional for the items still to be confirmed (about 7–8% of the EU total; in Malta only the EUR 28.2 million excise cut); and Malta’s 2023 amount, booked as actual costs, is 1.7 to 2.1 times what the Government and the IMF report as the cost of energy support, a gap we could not explain (in 2022 the database was lower than both, and over 2022–23 the line is close to the Government’s figure, which suggests timing or basis).
What this verdict does not say. It does not say Malta’s energy price policy is right or wrong, that anyone misreported anything, or that other definitions are wrong. It says the EEA’s statement matches the EU’s official data as published, with the caveats above.
Evidence we are asking for
- DG ENER and its contractors: the budget source and accounting basis (outturn or allocation; cash or accrual; which year) of Malta’s “Energy Support Measures” line, EUR 246.6 million in 2022 and EUR 580 million in 2023, which the database flags “Actual costs”.
- DG ENER: the 2025-edition database, with final 2023 values by Member State, to show whether Slovakia stays at or above 1.5% and whether Malta’s 2023 amount was revised.
- Malta’s Ministry for Finance: the outturn cost of energy support measures for each year from 2021, separating electricity, fuels and other commodities.
- EEA: which GDP series its share chart uses (the Malta country page names Eurostat, but its values match the database’s IMF and World Bank series) and an update of the method note.
- DG ENER: whether Malta’s Enemalta line should be pro-rated by the power mix, as other electricity support is, given that 21.7% of Malta’s 2023 electricity supply was imported. The rank does not change on our test.
8 Limitations
- The 2023 values are provisional; the Commission’s 2025-edition database (final 2023 values) was not found. Its 2026 report raises the EU’s 2023 total from EUR 111 billion (2023 prices) to EUR 121 billion (2024 prices) [8].
- The Commission’s 2024 subsidy report, COM(2025) 17 (28 January 2025), was read from the EU Publications Office (EUR-Lex refused our requests) [19]. It gives the 2023 shares only as a chart (Figure 16), which we measured by pixel: Malta 3.37%, Poland 2.09%, Slovakia 1.51%, Croatia 1.15% (±0.01 points), the same as the CIRCABC file we rebuilt from, which was modified on 9 April 2025, after the report [4]. We could not read the smaller bars, which the chart’s EU-27 line and 2015 markers cross. The news item of 29 January 2025 [6] was also read.
- The original 29 January 2025 page could not be opened; the earliest copy we read is the EEA’s print of 3 February 2025.
- Malta’s 2024 value in the Commission’s 2026 report is read from a chart; no table is published.
- The IMF Article IV figures were read in full for earlier checks (CC-018 and CC-022, 5 October 2026) and not re-opened, as imf.org refused our requests. The IMF’s price-gap data are its 2023 update, published in August 2023, so their 2023 values were estimated before the year ended.
- The Government’s figures are expected costs written during the year and include other basic commodities.
- We found no peer-reviewed study of Malta’s energy price policy. A Central Bank of Malta discussion paper (Rapa 2025) was not read (403).
References
- [1] European Environment Agency (29 Jan 2025; modified 29 Jul 2025). Fossil fuel subsidies in Europe (8th EAP headline indicator). Read 6 Oct 2026. https://www.eea.europa.eu/en/analysis/indicators/fossil-fuel-subsidies
- [2] European Environment Agency. Fixed copies of the indicator: browser print of 3 Feb 2025 (8th EAP monitoring publication) and the 8th EAP monitoring report 2025 indicator PDF (26 Nov 2025). Read 6 Oct 2026. https://www.eea.europa.eu/en/analysis/publications/monitoring-progress-towards-8th-eap-objectives/indicators/19-fossil-fuel-subsidies/@@download/file
- [3] European Environment Agency. Chart data: Fossil fuel subsidies as a share of GDP 2023; Fossil fuel subsidies in EU Member States, 2015 and 2023; by energy vector (data packages). Retrieved 6 Oct 2026. https://www.eea.europa.eu/en/analysis/indicators/fossil-fuel-subsidies/fossil-fuel-subsidies-as
- [4] European Commission, DG ENER, with Enerdata and Trinomics. Inventory of energy subsidies in the EU27, 2024 edition (database, 6 Sep 2024), published with COM(2025) 17. Retrieved from CIRCABC 6 Oct 2026. https://circabc.europa.eu/ui/group/8f5f9424-a7ef-4dbf-b914-1af1d12ff5d2/library/4e6f2b2c-702b-429b-bb19-7aeb48f28f58/details
- [5] Eurostat. nama_10_gdp, GDP at current prices; updated and retrieved 6 Oct 2026. doi:10.2908/NAMA_10_GDP. https://ec.europa.eu/eurostat/databrowser/view/nama_10_gdp/default/table
- [6] European Commission, DG ENER (29 Jan 2025). Energy subsidies report shows progress in 2023. Read 6 Oct 2026. https://energy.ec.europa.eu/news/energy-subsidies-report-shows-progress-2023-2025-01-29_en
- [7] European Environment Agency (29 Sep 2025). Europe’s environment 2025, Malta: fossil fuel subsidies (chart). Retrieved 6 Oct 2026. https://www.eea.europa.eu/en/europe-environment-2025/countries/malta/fossil-fuel-subsidies
- [8] European Commission (17 Sep 2026). Report on energy subsidies in the EU, COM(2026) 472 final; Council document ST 13343/26. Read in full 6 Oct 2026. https://data.consilium.europa.eu/doc/document/ST-13343-2026-INIT/en/pdf
- [9] Nill, J. (2024). Fossil Fuel Subsidies in EU Member States – Trends and Analytical Challenges. European Economy Discussion Paper 214, DG ECFIN. doi:10.2765/28177. Read in full; pp. 6–8. https://economy-finance.ec.europa.eu/document/download/0ae8556a-14a3-4ac9-840f-7f86a5c58521_en?filename=dp214_en.pdf
- [10] Government of Malta (Oct 2023). Draft Budgetary Plan 2024, section 3.1 (PDF p.34). Read 6 Oct 2026. https://economy-finance.ec.europa.eu/document/download/4edb4e16-f5c7-4443-ba70-dc3c0dc4099b_en?filename=2024_dbp_mt_en.pdf
- [11] Government of Malta (Oct 2024). Draft Budgetary Plan 2025 (PDF p.40). Read 6 Oct 2026. https://economy-finance.ec.europa.eu/document/download/8d77183d-aad8-464a-9c97-8baded7f13a8_en?filename=2025_dbp_mt_en.pdf
- [12] International Monetary Fund (Feb 2026). Malta: 2025 Article IV Consultation, Country Report 26/29, Table 2 (PDF p.33). doi:10.5089/9798229038249.002. Read in full for CC-018/CC-022, 5 Oct 2026. https://www.imf.org/-/media/files/publications/cr/2026/english/1mltea2026001-source-pdf.pdf
- [13] Black, S., Liu, A., Parry, I. and Vernon-Lin, N. (2023). IMF Fossil Fuel Subsidies Data: 2023 Update. IMF Working Paper 23/169. doi:10.5089/9798400249006.001. Abstract read; data from the IMF Climate Data dashboard, retrieved 6 Oct 2026. https://climatedata.imf.org/datasets/d48cfd2124954fb0900cef95f2db2724_0
- [14] OECD and IISD. Fossil Fuel Subsidy Tracker, country data, 2024 update (file of Jan 2026). Retrieved 6 Oct 2026. https://fossilfuelsubsidytracker.org/country/
- [15] Eurostat. gov_10a_main, general government subsidies (D.3), Malta; updated 21 Jul 2026, retrieved 6 Oct 2026. doi:10.2908/GOV_10A_MAIN. https://ec.europa.eu/eurostat/databrowser/view/gov_10a_main/default/table
- [16] European Commission (19 Jun 2024). 2024 Country Report – Malta, SWD(2024) 618 final, PDF p.3. Read 6 Oct 2026. https://economy-finance.ec.europa.eu/document/download/b8357ca1-e31e-4a3a-b7e4-25ebf8d01121_en?filename=SWD_2024_618_1_EN_Malta.pdf
- [17] Rentschler, J. and Bazilian, M. (2017). Reforming fossil fuel subsidies: drivers, barriers and the state of progress. Climate Policy 17(7):891–914. doi:10.1080/14693062.2016.1169393. Abstract read. https://doi.org/10.1080/14693062.2016.1169393
- [18] Böhm, J. and Peterson, S. (2024). Fossil Fuel Subsidy Inventories vs. Net Carbon Prices. The Energy Journal 45(4):59–79. doi:10.1177/01956574241277304. Abstract read. https://doi.org/10.1177/01956574241277304
- [19] European Commission (28 Jan 2025). 2024 Report on Energy subsidies in the EU, COM(2025) 17 final, Figure 16 and footnote 6. Read 6 Oct 2026 from the EU Publications Office. http://publications.europa.eu/resource/cellar/7150e5a9-dd6f-11ef-be2a-01aa75ed71a1.0017.03/DOC_1
- [20] Eurostat. nrg_cb_e, electricity supply, transformation and consumption, Malta 2023 (gross production and imports); updated 11 Sep 2026, retrieved 6 Oct 2026. doi:10.2908/NRG_CB_E. https://ec.europa.eu/eurostat/databrowser/view/nrg_cb_e/default/table
- [21] European Commission, DG ENER (published 29 Jan 2025; modified 30 Jul 2026). 9th report on the state of the energy union (page listing the energy subsidies report COM/2025/17 and the subsidy database). Read 6 Oct 2026. https://energy.ec.europa.eu/strategy/energy-union/ninth-report-state-energy-union_en
- [22] Miżien. Data and calculations: data/cc-113/; tools/cc-113-report/calc.py.
Appendix A: series standards and verdict scale
Every investigation in this series follows the same rules so that verdicts are comparable and challengeable.
| Verdict | Meaning |
|---|---|
| SUPPORTED | Evidence consistently backs the claim as stated. |
| LARGELY SUPPORTED | Backed by the evidence, with minor caveats that do not change the substance. |
| NOT SUBSTANTIATED | Stated more strongly than the evidence offered or available allows. May be true in some conditions but has not been shown. |
| MISLEADING | Omits material facts so that the overall impression is inaccurate, even if individual statements are defensible. |
| CONTRADICTED | The available evidence points against the claim. |
Confidence
High: multiple independent lines of evidence agree. Moderate: evidence is relevant but incomplete or indirect. Low: evidence is thin, second-hand or conflicting.
Evidence grades
A experiment · B observational study with a control or gradient · C review, guidance or official statistics · D assertion or anecdote. ◆ marks a source known only second-hand (none is used for a figure in this report).
Standards
- Quote the speaker, not the headline, with outlet and date, and link the original where possible.
- Separate the claim from the evidence offered for it, and say who made which statement.
- Grade the evidence and show differing views side by side where the evidence is unsettled.
- State what we could not access or verify, and what would change the verdict either way.
- Ask for the missing evidence in specific, answerable requests.
- Offer a right of reply where a check finds a claim Not substantiated, Misleading or Contradicted (or a pledge Not measurable, Off track or Missed), before wider circulation, and append responses.
- Correct errors openly with a version number and change log.
- Whistle-blow only on evidence: a verdict of Misleading or Contradicted requires documents or data that can be shown, not inference.
- Check every side. Government, opposition, NGOs and developers are held to the same standard.
Appendix B: revision log
| Version | Date | Change |
|---|---|---|
| 1.0 | 6 Oct 2026 | First issue. No right of reply needed for a Largely supported verdict. |
Sources and archived copies
-
Fossil fuel subsidies in Europe, European Environment Agency, 2025-01-29.
Original · Archived copy
The claim. Read in full 6 Oct 2026 (page published 29 Jan 2025, modified 29 Jul 2025). Same sentence, word for word, in the EEA's browser-printed copy of 3 Feb 2025 and in the 8th EAP monitoring report 2025 PDF (26 Nov 2025). Wayback and archive.today refused connections from this network. -
Fossil fuel subsidies as a share of GDP 2023 (chart) and the indicator's chart data packages, European Environment Agency, 2025-01-29.
Original · fetched and fingerprinted 2026-10-10; no public snapshot yet
Malta 3.37%, Poland 2.09%, Slovakia 1.51%, EU-27 0.66% (2023, provisional: 2022 values used for about 7% of the total). Downloaded 6 Oct 2026 (data/cc-113/). -
Inventory of energy subsidies in the EU27, 2024 edition (subsidy database), European Commission (DG ENER; Enerdata, Trinomics), 6 Sep 2024.
Original · not yet archived
Primary evidence: the database behind the EEA indicator, published with COM(2025) 17 (file modified 9 Apr 2025; SHA-256 recorded). Every EEA share reproduced to two decimals (tools/cc-113-report/calc.py). The workbook is (c) Enerdata: only country totals and five Malta figures are committed; the measure rows are rebuilt locally. -
2024 Report on Energy subsidies in the EU, COM(2025) 17 final, European Commission, 28 Jan 2025.
Original · fetched and fingerprinted 2026-10-10; no public snapshot yet
Read 6 Oct 2026 from the EU Publications Office (EUR-Lex refused scripts). Figure 16, "Fossil fuel subsidies compared to GDP (%, 2015 and 2023)", shows MT about 3.37, PL about 2.09, SK about 1.51 (measured by pixel: 3.367, 2.091, 1.507): the values as of 28 Jan 2025, before the CIRCABC file was modified on 9 Apr 2025. Footnote 6: data "to be confirmed" were 8% of the 2023 total. -
9th report on the state of the energy union (page), European Commission, DG ENER, 2025-01-29.
Original · Archived copy
Read 6 Oct 2026 (modified 30 Jul 2026). Lists the energy subsidies report (COM/2025/17) and the subsidy database (xl file), and links to the CIRCABC file. -
Report on energy subsidies in the EU, COM(2026) 472 final (Council document ST 13343/26), European Commission, 17 Sep 2026.
Original · fetched and fingerprinted 2026-10-10; no public snapshot yet
Read in full 6 Oct 2026. EU fossil fuel subsidies 2023 revised to EUR 121bn (2024 prices); Malta first per unit of GDP in 2024 (Figure 15, about 1.8%, read from the chart). -
Malta: Draft Budgetary Plan 2024, Government of Malta, Oct 2023.
Original · Archived copy
Energy support measures (including other basic commodities) 2.5% of GDP in 2022 and 1.7% expected in 2023 (section 3.1, PDF p.34). -
Malta: Draft Budgetary Plan 2025, Government of Malta, Oct 2024.
Original · Archived copy
Keeping energy and basic-commodity costs unchanged cost 0.87% of GDP in 2024 and 0.72% in 2025 (PDF p.40). -
IMF Fossil Fuel Subsidies Data: 2023 Update (Climate Data dashboard), International Monetary Fund, Aug 2023.
Original · Archived copy
Price-gap method; Malta's explicit subsidies are zero in every year; explicit plus implicit 2.27% of GDP in 2023, 15th of 27.
Right of reply
Not needed: this check finds the claim supported. A right of reply is sought when a check finds a claim Not substantiated, Misleading or Contradicted.
Connections
How this claim relates to the others: who made it, the themes it shares with other claims, and the patterns it shows. A connection is a reason to read two checks side by side. It does not make either one right or wrong. How connections are found.
Who made it
Other claims by European Environment Agency 1
Linked directly 3
Claims that share a theme with this one. A theme is a cause, a mechanism, a target or a way of presenting figures that the editors have found in several claims; its strength says how close the link is.
Energy subsidies Shared driver · Weak (indicative)
Claims about what energy support costs and what it shields: the lowest-electricity-burden claim, the Finance Minister's EUR 400 million a year (2026-27), and the EEA ranking of fossil-fuel subsidies by share of GDP. They rest on different definitions of subsidy. CC-095 (10 Oct 2026) set them side by side: the IMF figures used in CC-022 and the Government's own 2023 figure fit Eurostat's COFOG fuel-and-energy subsidies, while the Commission database's 2023 entries for Malta used in CC-113 equal the October 2022 budget allocation (EUR 595m), 2.5 times the Government's later 2023 figure (EUR 242.5m, energy and food).
Two steps away 5
Not linked to this claim directly, but linked to a claim that is. These are found by following the links, not chosen by the editors, so they are looser: they show where one theme meets another.
- CC-024 Renewables target for 2030 (Not substantiated)through Energy subsidiesCC-124Renewables delivery
- CC-025 Per-capita emissions down 44% since 2005 (Largely supported)through Energy subsidiesCC-022Selective-metric pattern
- CC-029 First offshore wind farm (Largely supported)through Energy subsidiesCC-124Renewables delivery
- CC-051 'Over 30% of our seas protected' (Misleading)through Energy subsidiesCC-022Selective-metric pattern
- CC-119 Council: renewables 17.2% of energy, almost all solar (not yet checked)through Energy subsidiesCC-124Renewables delivery
Three steps away 4
One step further again. At this distance a connection says more about how the themes fit together than about this claim.
- CC-003 Per-capita emissions vs 2030 projection (Misleading)through Energy subsidiesCC-022Selective-metric patternCC-0252030 carbon target
- CC-011 Ten minutes' walk to green space (pledge: Not measurable)through Energy subsidiesCC-124Renewables deliveryCC-0242030 carbon target
- CC-026 EU's largest rise in emissions (Largely supported)through Energy subsidiesCC-022Selective-metric patternCC-025Selective-metric pattern
- CC-114 PN: only EU state with rising emissions intensity (Misleading)through Energy subsidiesCC-022Selective-metric patternCC-025Selective-metric pattern
Similar wording
Claims whose own words overlap with this one, with the words they share. Found by comparing the wording of the claims, not their verdicts; a lead to read them together, not a finding.
- CC-037 Highest share reporting pollution (Supported)shares: highest, share
Timeline
What was said, what was published before and after it, and each step of this check, in date order. Statements and sources carry the date they were published. The steps of the check carry the date the research was done, from the check's research log. Other statements by the same body on the same topic show whether a position was repeated, changed or corrected.
2017
- 2017 Evidence published Rentschler and Bazilian (2017), Reforming fossil fuel subsidies: drivers, barriers and the state of progress, Climate Policy 17(7):891-914, Taylor & Francis
2023
- August 2023 Evidence published IMF Fossil Fuel Subsidies Data: 2023 Update (Climate Data dashboard), International Monetary Fund (Black, Liu, Parry, Vernon-Lin)
- October 2023 Evidence published Malta: Draft Budgetary Plan 2024, Government of Malta
2024
- 19 June 2024 Evidence published 2024 Country Report - Malta, SWD(2024) 618 final, European Commission
- 2024 Evidence published Böhm and Peterson (2024), Fossil Fuel Subsidy Inventories vs. Net Carbon Prices, The Energy Journal 45(4):59-79, SAGE
- 6 September 2024 Evidence published Inventory of energy subsidies in the EU27, 2024 edition (subsidy database, xlsx), European Commission (DG ENER; Enerdata, Trinomics)
- October 2024 Evidence published Malta: Draft Budgetary Plan 2025, Government of Malta
- December 2024 Evidence published Fossil Fuel Subsidies in EU Member States - Trends and Analytical Challenges (European Economy Discussion Paper 214), European Commission, DG ECFIN (Nill, J.)
2025
- 28 January 2025 Evidence published 2024 Report on Energy subsidies in the EU, COM(2025) 17 final (Figure 16, footnote 6), European Commission
- 29 January 2025 The statement European Environment Agency (this claim)
- 29 January 2025 Reported Energy subsidies report shows progress in 2023, European Commission, DG ENER
- 29 January 2025 Evidence published Fossil fuel subsidies in Europe, European Environment Agency
- 29 January 2025 Evidence published Fossil fuel subsidies as a share of GDP 2023; Fossil fuel subsidies in EU Member States 2015 and 2023; by energy vector (EEA chart pages and data packages), European Environment Agency
- 29 January 2025 Evidence published 9th report on the state of the energy union (page listing the energy subsidies report COM/2025/17 and the subsidy database), European Commission, DG ENER
- 3 February 2025 Evidence published Fossil fuel subsidies in Europe: browser-printed copy (8th EAP monitoring publication), European Environment Agency
- July 2025 Evidence published Rapa (2025), Energy Subsidies in Malta: Estimating the Effects of Current Policies and Hypothetical Exit Strategies (Central Bank of Malta DP 4/2025), Central Bank of Malta
- 29 September 2025 Evidence published Europe's environment 2025, Malta: fossil fuel subsidies (chart), European Environment Agency
- 26 November 2025 Evidence published Monitoring report on progress towards the 8th EAP objectives 2025: indicator 19, fossil fuel subsidies (PDF), European Environment Agency
2026
- January 2026 Evidence published Fossil Fuel Subsidy Tracker, country data (2024 update), OECD and IISD
- February 2026 Evidence published Malta: 2025 Article IV Consultation (IMF CR 26/29), energy subsidies, International Monetary Fund
- 21 July 2026 Evidence published Government revenue, expenditure and main aggregates (gov_10a_main), subsidies D.3, Malta, Eurostat
- 17 September 2026 Evidence published Report on energy subsidies in the EU, COM(2026) 472 final (Council document ST 13343/26), European Commission
- 5 October 2026 Added to the claims to check
- 6 October 2026 Evidence published GDP and main components (nama_10_gdp), Eurostat
- 6 October 2026 Check started Check started. EEA indicator page, chart pages and data packages downloaded; the Commission's subsidy database (2024 edition) found on CIRCABC through the 9th State of the Energy Union page; Eurostat GDP and government subsidies, the IMF price-gap data and the OECD/IISD tracker downloaded; COM(2026) 472, Malta's Draft Budgetary Plans 2024 and 2025, the Commission's 2024 country report and ECFIN Discussion Paper 214 read.
- 6 October 2026 Exact wording found Verbatim wording read on the live EEA page (published 29 Jan 2025, modified 29 Jul 2025) and in the EEA's fixed copies of 3 Feb 2025 and 26 Nov 2025: identical. Wayback and archive.today refused connections, so the 29 Jan 2025 page itself was not opened.
- 6 October 2026 Note Every EEA share reproduced to two decimals from the Commission database (2022 values used for 'to be confirmed' measures; GDP from the database, Enerdata via IMF and World Bank). With Eurostat GDP as of 6 Oct 2026 (which the EEA could not have had): Malta 3.03%, Poland 2.08%, Slovakia 1.49%. Malta's 2023 amount is 96% one line (EUR 580m, Enemalta compensation), 2.1 times the IMF's and 1.7 times the Government's 2023 cost of energy support; not reconciled.
- 6 October 2026 Note COM(2025) 17 (28 Jan 2025) read from the EU Publications Office (Cellar). Its Figure 16, measured by pixel, gives Malta 3.37%, Poland 2.09%, Slovakia 1.51%, Croatia 1.15% (the top ten bars match the CIRCABC file to 0.001 points); the CIRCABC file was modified on 9 Apr 2025, after the report, so for those countries the values we rebuilt are those of 28 Jan 2025. Eurostat nrg_cb_e: Malta imported 648 of 2,992 GWh (21.7%) of its 2023 electricity supply, while the database books the Enemalta line wholly to natural gas; leaving out only the import share gives 2.70%, still first.
- 6 October 2026 Note Licence: the Commission workbook's own notice says (c) Enerdata, reproduction and diffusion prohibited without written permission. Measure-level extracts removed from the repository; only country totals, the GDP series and five Malta figures are kept, and fetch.py rebuilds the rest locally after a SHA-256 check. Review fixes applied before first issue: variants C and D labelled a lower bound; the EUR 580m line is booked as actual costs (only the EUR 28.2m excise cut is to be confirmed); 2022 and 2024 comparisons with the Government and IMF added; title now says relative to GDP.
- 6 October 2026 Version 1.0: first issue First issue. Verdict Largely supported (moderate confidence); no right of reply needed. Verdict in this version: Largely supported, moderate confidence.
- 6 October 2026 Evidence reviewed
2027
- 6 October 2027 Coming up: Evidence review due Each finished check is reviewed against new evidence within a year.
Every change to this claim's record is public: history of the record.
Download the report and flyer