CC-076 · Transport · Cars & traffic
36 more vehicles a day
Supported High confidence Draft: no right of reply needed
Parts of this claim
The claim is split into parts that are tested separately, as in the report below. Each part has its own number.
- CC-076A The stock of licensed motor vehicles stood at 460,648 at the end of March 2026 (NSO [1])Table 1 total for Q1 2026 is 460,648. The vehicle categories add up to the total in all 13 quarters.
- CC-076B The stock rose by 3,245 over the quarter, a net average of 36 vehicles a day (NSO [1])460,648 minus 457,403 is 3,245; over 90 days that is 36.06 a day, by the NSO’s stated formula.
- CC-076C The figure is a net increase, not a count of new registrations (NSO [1])Gross licensing was 63 a day; 6,963 vehicles went under restriction and 4,140 returned. The release gives both.
- CC-076D The fleet grows at a net average of 35 vehicles a day (Commission [2])Q4 2025: 3,265 over 92 days is 35.5 a day, matching the Commission’s figure and its NSO citation. We derived this from Table 1; we did not retrieve the Q4 release.
Claim Check 076 · Transport and official statistics
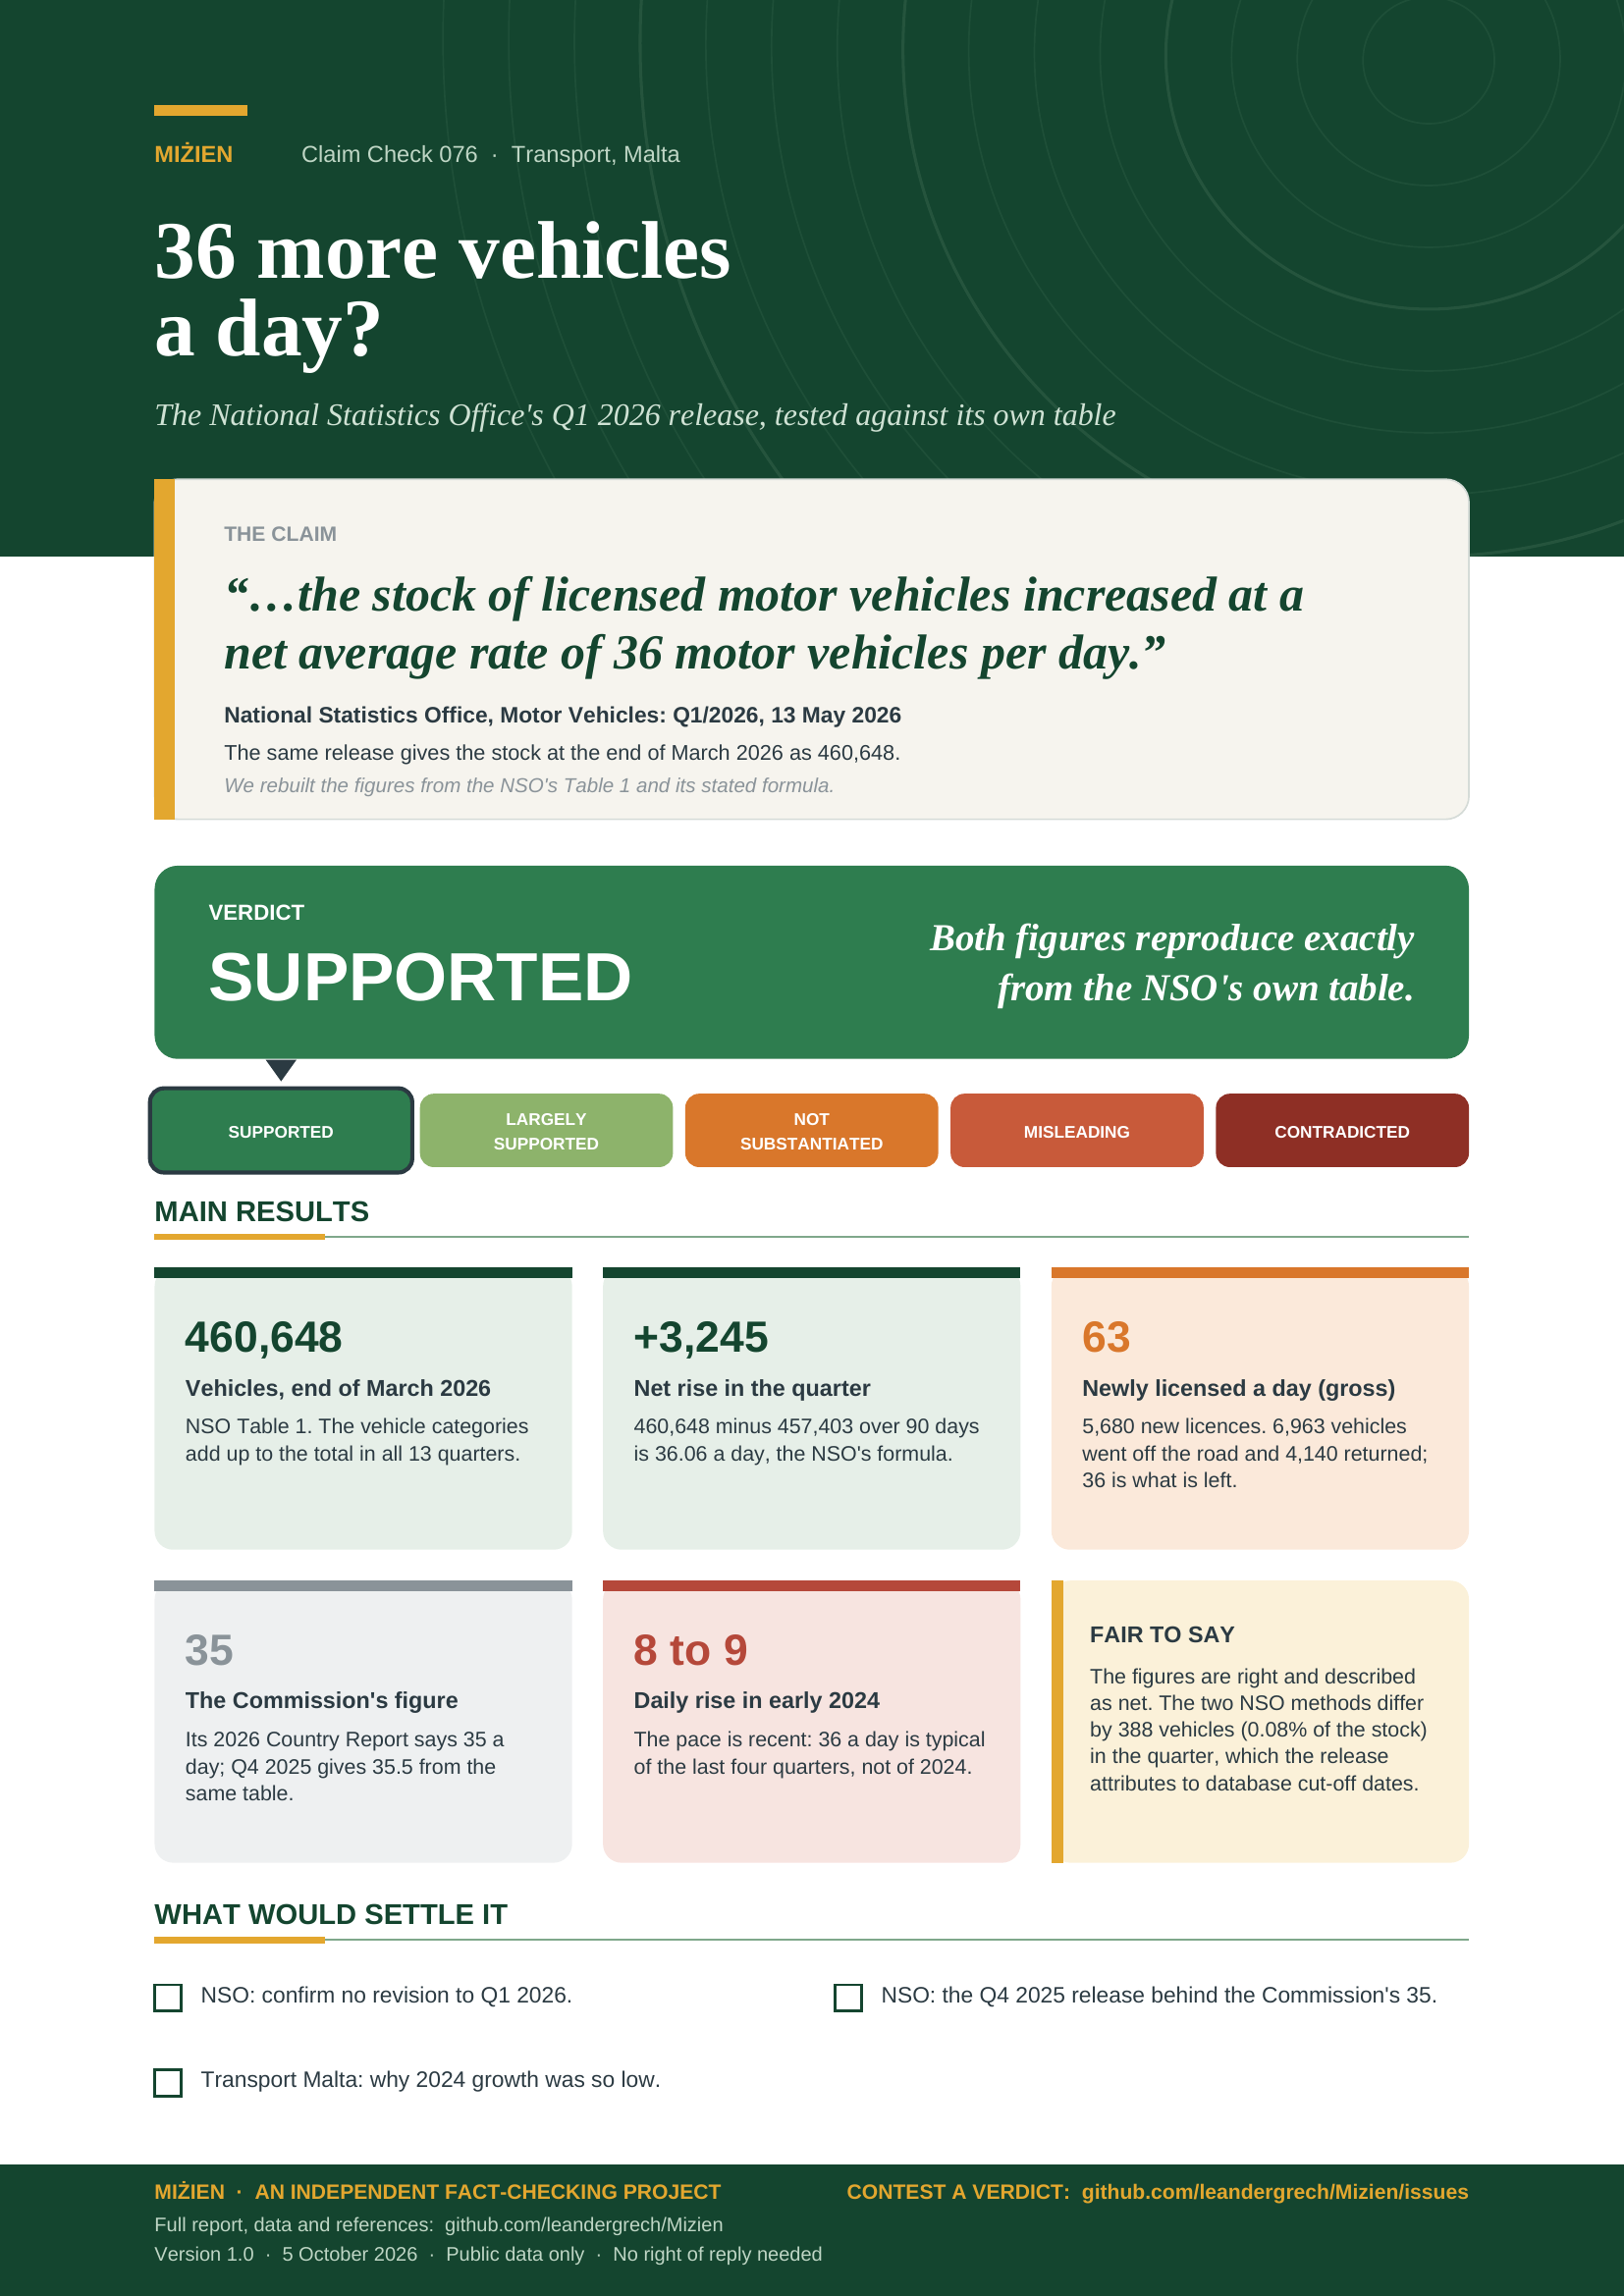
36 more vehicles a day?
Testing the National Statistics Office’s Q1 2026 motor vehicle release
“…the stock of licensed motor vehicles increased at a net average rate of 36 motor vehicles per day.”
National Statistics Office, Motor Vehicles: Q1/2026, NR 085/2026, 13 May 2026.
The same release gives the stock at the end of March 2026 as 460,648.
Verdict: Supported Reproduces exactly from the NSO’s own table
Version 1.0 · 5 October 2026
TL;DR
In its news release on motor vehicles for the first quarter of 2026 (NR 085/2026, 13 May 2026), the National Statistics Office (NSO) wrote: “At the end of March 2026, the stock of licensed motor vehicles stood at 460,648” and that “the stock of licensed motor vehicles increased at a net average rate of 36 motor vehicles per day”. We rebuilt both figures from the NSO’s own table.
- The stock and the increase reproduce exactly. NSO Table 1 gives 457,403 vehicles at the end of 2025 and 460,648 at the end of March 2026: a rise of 3,245 over the 90 days of the quarter, or 36.06 a day. The vehicle categories add up to the printed totals in all 13 quarters of the table.
- It is a net figure, and the release says so. 5,680 vehicles were newly licensed (63 a day), 6,963 were taken off the road under restrictions and 4,140 came back. “36 more a day” is what is left after those flows, not the number of new registrations.
- Two NSO methods differ slightly. The headline uses the change in the stock. Adding the quarter’s flows to the opening stock gives a rise of 2,857 (about 32 a day), 388 less. The release says cut-off dates of the databases can cause such differences.
- The pace is recent, not long-standing. Daily increases were 9 and 8 in the first half of 2024 and 19 in Q1 2025, then 37, 36, 35 and 36 over the last four quarters. The European Commission’s “35 a day” matches Q4 2025 (35.5).
- Verdict: supported (high confidence). The figures are exactly those in the NSO’s own table, the arithmetic is right and the release states the method. Nothing here tests whether the data are right at source; they come from Transport Malta’s records.
- Supported
- Largely supported
- Not substantiated
- Misleading
- Contradicted
What would move the verdict up
None: Supported is the top of the scale.
What would move it down
A revision of the NSO data (the release says its figures are subject to revision), or evidence that Transport Malta’s register overstates the stock.
IN THIS REPORT
1 The claim and what we could verify
The claim record for this check cites a Newsbook article of 11 November 2025 [3] that reports the same kind of figure for the third quarter of 2025 (454,138 vehicles; 36 a day). The statement checked here is the NSO’s newer release for the first quarter of 2026 [1], which carries the numbers in the claim record (460,648 and 36 a day). The NSO site refuses automated requests, so we read the release and its Table 1 workbook from the Internet Archive’s copy captured on 13 May 2026, the day of release.
| Source | What it says | Our access | Status |
|---|---|---|---|
| National Statistics Office, Motor Vehicles: Q1/2026, NR 085/2026, 13 May 2026 [1] | “In the first quarter of 2026, the stock of licensed motor vehicles increased by 3,245 over the previous quarter. At the end of March 2026, the stock of licensed motor vehicles stood at 460,648.” … “During the quarter under review, the stock of licensed motor vehicles increased at a net average rate of 36 motor vehicles per day.” | Release text and Table 1 workbook read (Internet Archive copy), 5 Oct 2026. | The claim (verbatim) |
| NSO, same release, methodological notes 6 and 7 [1] | Note 7: net average daily increase = stock in the quarter minus stock in the previous quarter, divided by the number of days in the quarter. Note 6 gives a flow identity that “might differ slightly from the actual stock”. | Read. | Method |
| European Commission, 2026 Country Report – Malta, p. 18 [2] | “…the overall vehicle fleet continues to grow at a net average rate of 35 motor vehicles per day”, citing NSO Motor Vehicles: Q4/2025. | Council PDF read, 5 Oct 2026. | Context |
| Newsbook, 14 May 2026 and 11 Nov 2025 [3, 4] | Report the Q1 2026 and Q3 2025 releases. | Read. | Locator, not evidence |
2 Method
Question. Do the stock and the daily increase in the NSO statement reproduce from the NSO’s own table, and is the figure described accurately as a net increase?
Evidence. We read Table 1 of the release (stock of licensed motor vehicles by vehicle group, Q1 2023 to Q1 2026) with tools/cc-076-report/fetch.py, checked that the vehicle categories add up to the printed total for each quarter, and recomputed the net daily increase for each quarter by the NSO’s own formula (calc.py; outputs in data/cc-076/). The flows (newly licensed, restricted, restrictions ended) are taken from the release text, where they are published numbers.
Grades. Official statistics are grade C in our scale. The claim is arithmetic on a published series; no literature is needed to test it. Verdicts follow the five-point scale in Appendix A.
3 What the data show
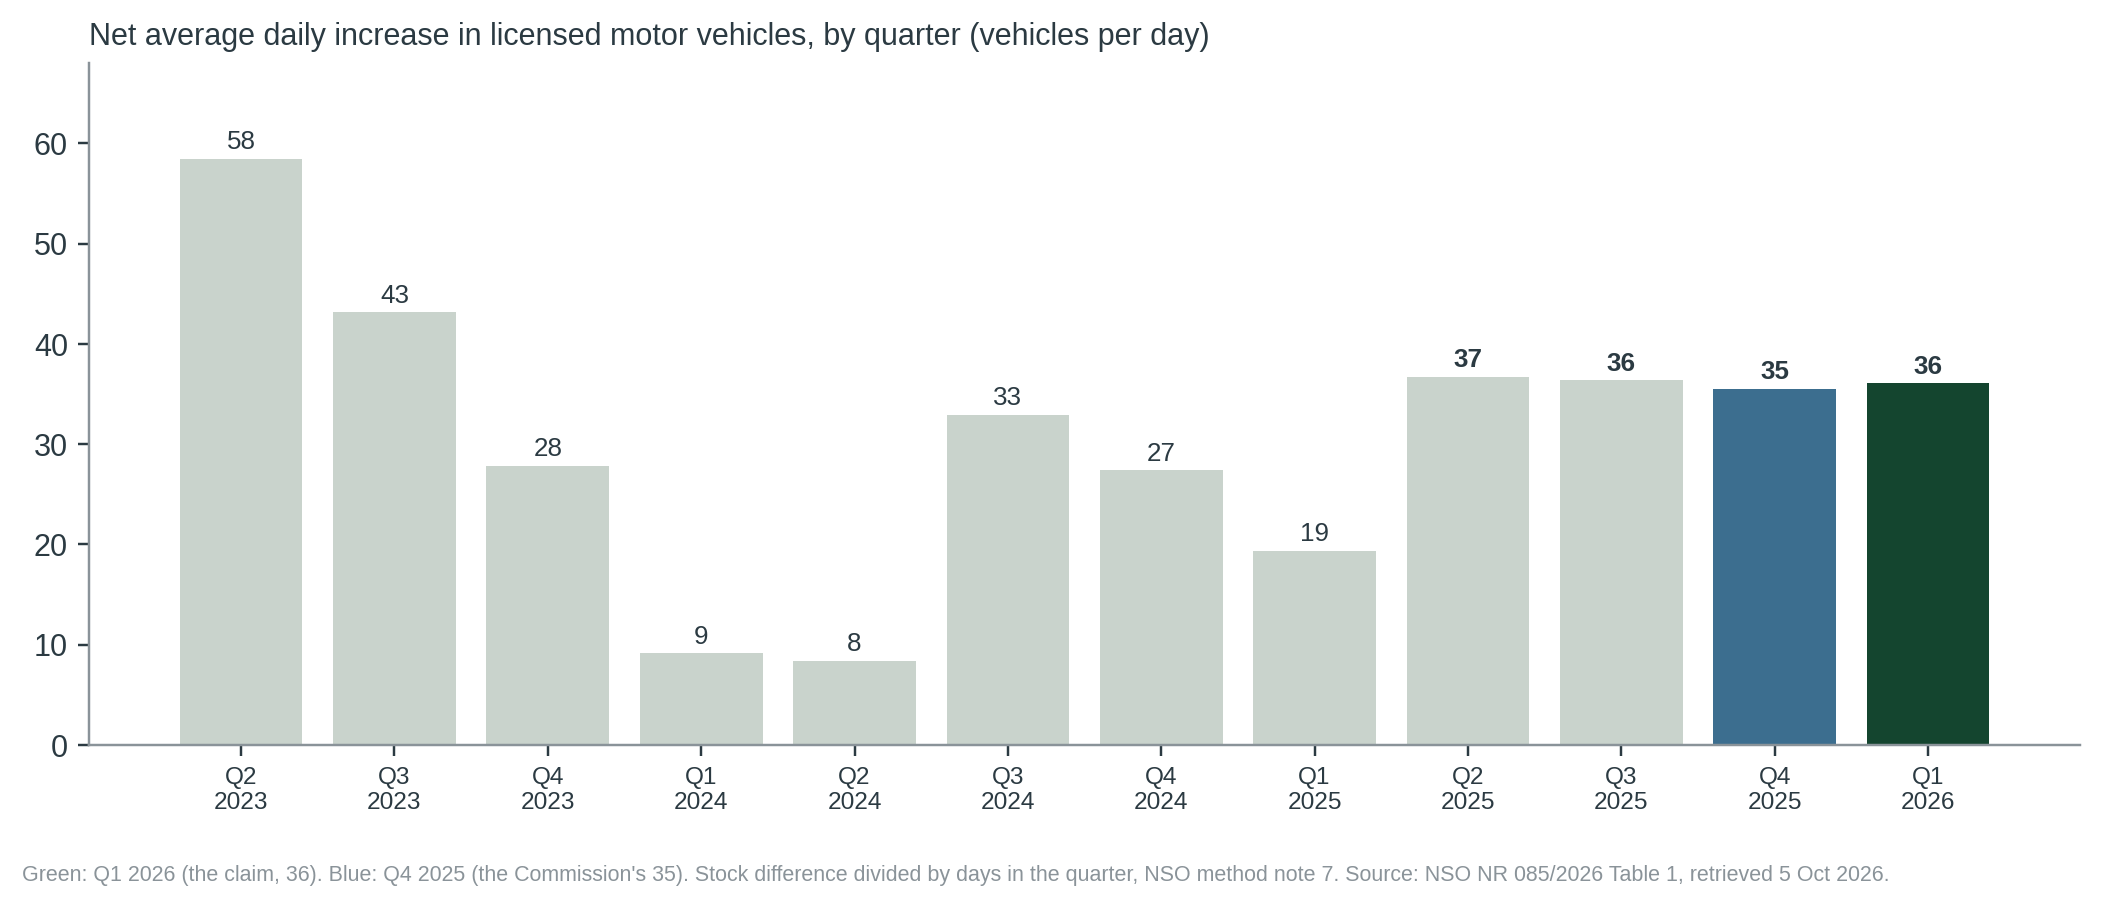
The stock reached 460,648 at the end of March 2026, 8.0% above the 426,720 of March 2023. The increase of 3,245 in Q1 2026 over 90 days is 36.06 a day, which the NSO rounds to 36. Over the four quarters to the end of March 2026 the stock rose by 13,193, or 36.2 a day; over calendar 2025 it rose by 11,692, or 32.0 a day. The pace was much lower in the first half of 2024 (9 and 8 a day) and in Q1 2025 (19 a day).
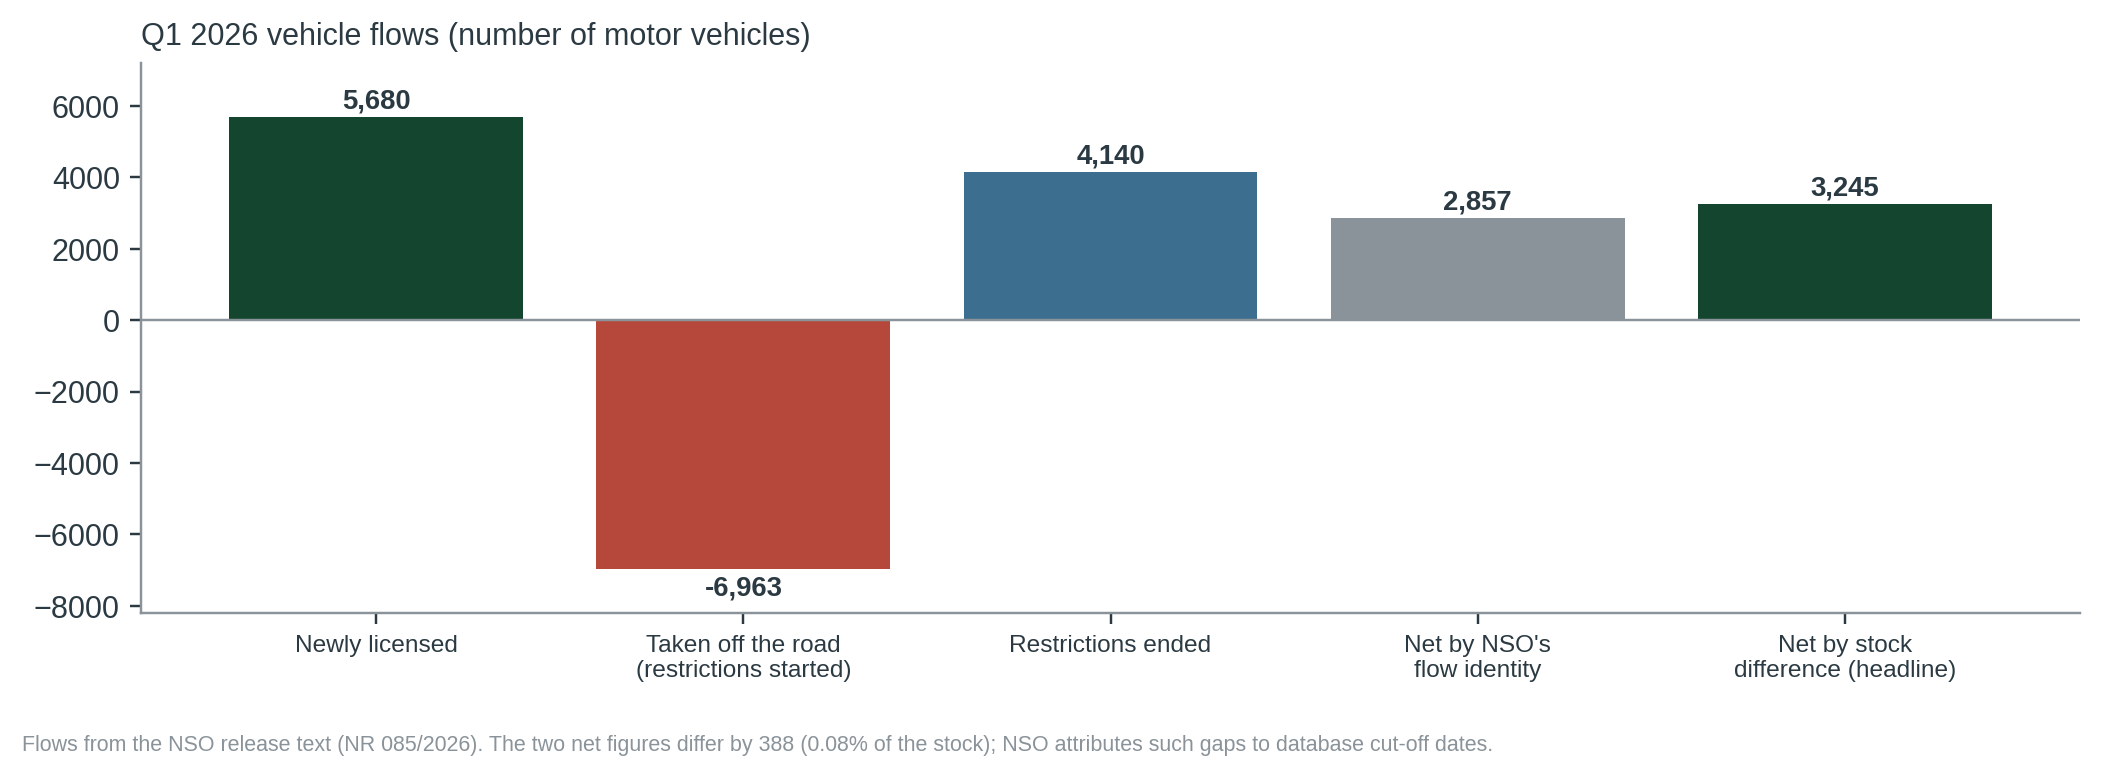
In Q1 2026, 5,680 vehicles were newly licensed (3,699 passenger cars; 3,174 were new and 2,506 used), an average of 63 a day. Against that, 6,963 vehicles went under restriction (41.4% garaged, 29.1% resold, 28.1% scrapped) and 4,140 restrictions ended. The net daily increase is therefore about 57% of the gross daily licensing.
4 Where the evidence points different ways
Is the quarter’s net rise 3,245 or 2,857?
BOTH ARE NSO FIGURESSTOCK DIFFERENCE (THE HEADLINE)
The headline rise is the difference between two published stocks (460,648 and 457,403): 3,245, or 36.06 a day. This is the formula in methodological note 7, and the release says it uses it for the daily rate.
FLOW IDENTITY
Note 6 builds the stock from flows: opening stock plus new licences, minus restrictions started, plus restrictions ended. With the published flows that gives 460,260, a rise of 2,857 (31.7 a day).
Is “36 a day” the trend, or one quarter?
ACCURATE FOR THE QUARTERRECENT QUARTERS
Four consecutive quarters (Q2 2025 to Q1 2026) sit at 35 to 37 a day, so Q1 2026 is typical of the recent pace; the Commission’s 35 (Q4 2025) agrees.
LONGER RUN
Over calendar 2025 the average was 32 a day, and in 2024 two quarters were below 10. The figure is a quarterly average, not a long-run rate.
5 Testing the claim
| Sub-claim | Said by | What the evidence shows | Rating |
|---|---|---|---|
| A. The stock of licensed motor vehicles stood at 460,648 at the end of March 2026 | NSO [1] | Table 1 total for Q1 2026 is 460,648. The vehicle categories add up to the total in all 13 quarters. | ACCURATE |
| B. The stock rose by 3,245 over the quarter, a net average of 36 vehicles a day | NSO [1] | 460,648 minus 457,403 is 3,245; over 90 days that is 36.06 a day, by the NSO’s stated formula. | ACCURATE |
| C. The figure is a net increase, not a count of new registrations | NSO [1] | Gross licensing was 63 a day; 6,963 vehicles went under restriction and 4,140 returned. The release gives both. | ACCURATE |
| D. The fleet grows at a net average of 35 vehicles a day | Commission [2] | Q4 2025: 3,265 over 92 days is 35.5 a day, matching the Commission’s figure and its NSO citation. We derived this from Table 1; we did not retrieve the Q4 release. | ACCURATE |
6 Verdict and requests for evidence
The stock and the net daily increase reproduce exactly from the NSO’s own table. Confidence: high.
Why. Both figures (460,648 and 36 a day) follow from the NSO’s Table 1 by the NSO’s stated formula, the description as a net increase is correct, and the nearest comparable official statement (the Commission’s 35 a day) agrees with the preceding quarter. The release’s own caveats (data subject to revision; cut-off differences) are small.
What this verdict does not say. It does not test the Transport Malta register that the NSO uses, or say whether the growth of the fleet is good or bad. It does not rate any policy on congestion.
Evidence we are asking for
- From the NSO: confirmation that the Q1 2026 figures have not been revised, and the Q4 2025 release for the Commission’s 35 a day.
- From Transport Malta: the reason for the low net growth in 2024 (about 8 to 9 a day in the first half) compared with 2025 and 2026, which the data alone do not explain.
7 Limitations
- We tested the NSO’s arithmetic against its own table. We did not test the underlying register of Transport Malta.
- The NSO website refuses automated access; we used the Internet Archive’s copy of the release, captured on the day of release (13 May 2026). The NSO notes its data are subject to revision.
- The Q4 2025 NSO release was not retrieved; the Commission’s 35 a day is checked from Table 1, not from that release.
- The released text does not give the number of vehicles in each flow by day; the flow identity is the NSO’s, with its own caveat about cut-off dates.
References
- [1] National Statistics Office, Malta (13 May 2026). Motor Vehicles: Q1/2026. News release NR 085/2026, with Table 1 workbook. Read from the Internet Archive copy captured 13 May 2026. https://nso.gov.mt/motor-vehicles-q1-2026/
- [2] European Commission (3 June 2026). 2026 Country Report – Malta. SWD(2026) 218 final; Council document 10135/26 ADD 1, p. 18 and footnote 11. https://data.consilium.europa.eu/doc/document/ST-10135-2026-ADD-1/en/pdf
- [3] ◆ Newsbook (11 Nov 2025). Malta’s roads grow more congested as vehicle fleet tops 454,000 (reports the Q3 2025 release). https://newsbook.com.mt/en/maltas-roads-grow-more-congested-as-vehicle-fleet-tops-454000/
- [4] ◆ Newsbook (14 May 2026). Over 3,200 new vehicles added to Malta’s roads in three months (reports the Q1 2026 release). https://newsbook.com.mt/en/over-3200-new-vehicles-added-to-maltas-roads-in-three-months/
- [5] MiŻien. Calculation script and outputs: tools/cc-076-report/calc.py; data/cc-076/checks.csv.
Appendix A: series standards and verdict scale
Every investigation in this series follows the same rules so that verdicts are comparable and challengeable.
| Verdict | Meaning |
|---|---|
| SUPPORTED | Evidence consistently backs the claim as stated. |
| LARGELY SUPPORTED | Backed by the evidence, with minor caveats that do not change the substance. |
| NOT SUBSTANTIATED | Stated more strongly than the evidence offered or available allows. May be true in some conditions but has not been shown. |
| MISLEADING | Omits material facts so that the overall impression is inaccurate, even if individual statements are defensible. |
| CONTRADICTED | The available evidence points against the claim. |
Confidence
High: multiple independent lines of evidence agree. Moderate: evidence is relevant but incomplete or indirect. Low: evidence is thin, second-hand or conflicting.
Evidence grades
A experiment · B observational study with a control or gradient · C review, guidance or official statistics · D assertion or anecdote. ◆ marks a source known only second-hand.
Standards
- Quote the speaker, not the headline, with outlet and date, and link the original where possible.
- Separate the claim from the evidence offered for it, and say who made which statement.
- Grade the evidence and show differing views side by side where the evidence is unsettled.
- State what we could not access or verify, and what would change the verdict either way.
- Ask for the missing evidence in specific, answerable requests.
- Offer a right of reply where a check finds a claim Not substantiated, Misleading or Contradicted (or a pledge Not measurable, Off track or Missed), before wider circulation, and append responses.
- Correct errors openly with a version number and change log.
- Whistle-blow only on evidence: a verdict of Misleading or Contradicted requires documents or data that can be shown, not inference.
- Check every side. Government, opposition, NGOs and developers are held to the same standard.
Appendix B: revision log
| Version | Date | Change |
|---|---|---|
| 1.0 | 5 Oct 2026 | First issue. Verdict Supported (high confidence); no right of reply needed. |
Sources and archived copies
-
Motor Vehicles: Q1/2026, News release NR 085/2026, National Statistics Office, Malta, 2026-05-13.
Original · Archived copy
The claim, verbatim. Read from the Internet Archive copy captured 13 May 2026 (nso.gov.mt blocks automated requests), with Table 1 workbook. -
2026 Country Report - Malta, SWD(2026) 218 final (Council doc. 10135/26 ADD 1), European Commission (via Council of the EU), 2026-06-03.
Original · Archived copy
Context: p. 18, 'net average rate of 35 motor vehicles per day', citing NSO Q4/2025. -
Over 3,200 new vehicles added to Malta's roads in three months, Newsbook, 2026-05-14.
Original · Archived copy
Locator for the Q1 2026 release; not evidence.
Right of reply
Not needed: this check finds the claim supported. A right of reply is sought when a check finds a claim Not substantiated, Misleading or Contradicted.
Connections
How this claim relates to the others: who made it, the themes it shares with other claims, and the patterns it shows. A connection is a reason to read two checks side by side. It does not make either one right or wrong. How connections are found.
Linked directly 1
Claims that share a theme with this one. A theme is a cause, a mechanism, a target or a way of presenting figures that the editors have found in several claims; its strength says how close the link is.
Transport, air and climate Shared driver · Weak (indicative)
Fleet growth links traffic claims, air quality and emissions. The climate report names transport and buildings as the lagging sectors.
Two steps away 16
Not linked to this claim directly, but linked to a claim that is. These are found by following the links, not chosen by the editors, so they are looser: they show where one theme meets another.
- CC-001 Upper Barrakka concrete (Not substantiated)through Transport, air and climateCC-008Sealed soil and concrete
- CC-002 Comino tree compensation (Largely supported)through Transport, air and climateCC-008Sealed soil and concrete
- CC-003 Per-capita emissions vs 2030 projection (Misleading)through Transport, air and climateCC-008Transport, air and climate
- CC-004 'Strong progress' in waste separation (Not substantiated)through Transport, air and climateCC-008Waste and construction
- CC-007 Within EU limits vs WHO guideline (Largely supported)through Transport, air and climateCC-008Transport, air and climate
- CC-010 Tree-planting counts (Largely supported)through Transport, air and climateCC-008Replanting as currency
- CC-012 Ta' Qali gravel and grass (Contradicted)through Transport, air and climateCC-008Sealed soil and concrete
- CC-016 Shore-to-ship: 90% less harbour pollution (Misleading)through Transport, air and climateCC-008Transport, air and climate
- CC-017 Land reclamation outside the Freeport (Not substantiated)through Transport, air and climateCC-008Waste and construction
- CC-019 830,000 m2 of land lost in five years (Not substantiated)through Transport, air and climateCC-008Sealed soil and concrete
- CC-021 Malta-Gozo tunnel traffic (not yet checked)through Transport, air and climateCC-008Transport, air and climate
- CC-056 Central Link: 'only 254 trees' (not yet checked)through Transport, air and climateCC-008Replanting as currency
- CC-069 82 million bus trips (not yet checked)through Transport, air and climateCC-008Transport, air and climate
- CC-072 EUR 15m to take cars off the road (not yet checked)through Transport, air and climateCC-008Transport, air and climate
- CC-109 EU: transport is 48% of effort-sharing emissions (Largely supported)through Transport, air and climateCC-008Transport, air and climate
- CC-115 Chamber: congestion cost EUR 770m, 3.4% of GDP (Not substantiated)through Transport, air and climateCC-008Transport, air and climate
Three steps away 26
One step further again. At this distance a connection says more about how the themes fit together than about this claim.
- CC-011 Ten minutes' walk to green space (pledge: Not measurable)through Transport, air and climateCC-008Transport, air and climateCC-0032030 carbon target
- CC-013 Permits keep property prices in check (Largely supported)through Transport, air and climateCC-008Waste and constructionCC-017Planning, housing and land take
- CC-014 Fewer enforcement notices, fewer illegalities (Misleading)through Transport, air and climateCC-008Waste and constructionCC-017Planning, housing and land take
- CC-018 IMF 'confirms' MDA on housing (Largely supported)through Transport, air and climateCC-008Waste and constructionCC-017Planning, housing and land take
- CC-020 EP study: noise law not the cause (Largely supported)through Transport, air and climateCC-008Transport, air and climateCC-007Compliance-not-health pattern
- CC-025 Per-capita emissions down 44% since 2005 (Largely supported)through Transport, air and climateCC-008Transport, air and climateCC-0032030 carbon target
- CC-026 EU's largest rise in emissions (Largely supported)through Transport, air and climateCC-008Transport, air and climateCC-003Transport, air and climate
- CC-031 Gozo, first climate-neutral region (Largely supported)through Transport, air and climateCC-008Transport, air and climateCC-109Shared emissions figures
- CC-033 Delimara: 'much cleaner air' (not yet checked)through Transport, air and climateCC-008Transport, air and climateCC-007Compliance-not-health pattern
- CC-035 PM2.5 death rate down two-thirds (Largely supported)through Transport, air and climateCC-008Transport, air and climateCC-007Transport, air and climate
- CC-054 Project Green: 100,000 m2 a year (not yet checked)through Transport, air and climateCC-008Replanting as currencyCC-010Replanting as currency
- CC-057 1,649 compensation trees (not yet checked)through Transport, air and climateCC-008Replanting as currencyCC-010Replanting as currency
- CC-058 96% of farmland in use (not yet checked)through Transport, air and climateCC-008Sealed soil and concreteCC-019Planning, housing and land take
- CC-059 Subsidies are 20% of farm output (not yet checked)through Transport, air and climateCC-008Sealed soil and concreteCC-019Farmland and farming pressure
- CC-063 Construction waste: 'standstill' warning (Not substantiated)through Transport, air and climateCC-008Waste and constructionCC-017Waste and construction
- CC-071 EUR 100m a year for free buses (Not substantiated)through Transport, air and climateCC-008Transport, air and climateCC-069Transport, air and climate
- CC-079 Waste-to-energy: 4.5% of energy (Misleading)through Transport, air and climateCC-008Waste and constructionCC-004Waste and construction
- CC-081 Landfill share rising (not yet checked)through Transport, air and climateCC-008Waste and constructionCC-004Waste and construction
- CC-094 Commission: Malta to emit more in 2030 than in 2005 (Supported)through Transport, air and climateCC-008Transport, air and climateCC-0032030 carbon target
- CC-110 EU: 37.7% of new cars zero-emission (Supported)through Transport, air and climateCC-008Transport, air and climateCC-007Selective-metric pattern
- CC-111 EU: 621 kg of waste a head, 74% landfilled (Supported)through Transport, air and climateCC-008Waste and constructionCC-004Waste and construction
- CC-114 PN: only EU state with rising emissions intensity (Misleading)through Transport, air and climateCC-008Transport, air and climateCC-003Selective-metric pattern
- CC-117 EU: Malta missed recycling targets (reasoned opinion) (not yet checked)through Transport, air and climateCC-008Waste and constructionCC-004Waste and construction
- CC-123 KPMG: 8,716 residential units approved in 2024, up 7.4% (not yet checked)through Transport, air and climateCC-008Sealed soil and concreteCC-019Planning, housing and land take
- CC-127 EU: Malta has the lowest organic share in the EU (not yet checked)through Transport, air and climateCC-008Sealed soil and concreteCC-019Farmland and farming pressure
- CC-130 NGOs: ODZ racecourse policy ends protection (not yet checked)through Transport, air and climateCC-008Sealed soil and concreteCC-019Farmland and farming pressure
Similar wording
Claims whose own words overlap with this one, with the words they share. Found by comparing the wording of the claims, not their verdicts; a lead to read them together, not a finding.
- CC-088 Population 588,254 (Supported)shares: end, stood, office
Timeline
What was said, what was published before and after it, and each step of this check, in date order. Statements and sources carry the date they were published. The steps of the check carry the date the research was done, from the check's research log. Other statements by the same body on the same topic show whether a position was repeated, changed or corrected.
2026
- 13 May 2026 The statement National Statistics Office (NSO) (this claim)
- 13 May 2026 Evidence published Motor Vehicles: Q1/2026, NR 085/2026, National Statistics Office, Malta
- 14 May 2026 Reported Over 3,200 new vehicles added to Malta's roads in three months, Newsbook
- 4 October 2026 Added to the claims to check
- 5 October 2026 Exact wording found NSO NR 085/2026 (13 May 2026) read via Internet Archive copy, with Table 1 workbook; verbatim wording found. The claim record's Newsbook link is the Q3 2025 article; the Q1 2026 figures come from the newer release.
- 5 October 2026 Note Table 1 quarterly stock parsed and every figure recomputed (tools/cc-076-report/calc.py); Commission's 35 a day checked against Q4 2025.
- 5 October 2026 Version 1.0: first issue First issue. Verdict Supported (high confidence); no right of reply needed. Verdict in this version: Supported, high confidence.
- 5 October 2026 Evidence reviewed
2027
- 5 October 2027 Coming up: Evidence review due Each finished check is reviewed against new evidence within a year.
Every change to this claim's record is public: history of the record.
Download the report and flyer