CC-014 · Planning & Housing · Permits & enforcement
Fewer enforcement notices, fewer illegalities
Misleading Moderate confidence Draft: right of reply pending
Parts of this claim
The claim is split into parts that are tested separately, as in the report below. Each part has its own number.
- CC-014A “We had times when we issued over 1,000 enforcement notices per year”1,369 (2001), 1,030 (2002), 1,061 (2004), 1,077 (2005), 1,120 (2009) [2–6].
- CC-014B Now around 200164–233 a year, 2018–2024 (191 in 2024); 315 in 2017 [9–16].
- CC-014C The fall is due to fewer illegalitiesNotices fell 82%; complaints fell 11–35% since 2004–09 and averaged about 2,860 a year in 2017–24. Confirmed cases in 2024 were close to 2018, and only 7–13 in 100 ended in a notice. The Authority attributes the fall to its strategy [9–16].
- CC-014D Over 5,000 cases awaiting direct action; over 90 years to clearPending notices: almost 7,000 (end 2018), 6,119 (2019), almost 5,600 (2020) [11–13]; 5,382 (end 2021) [17]. Notices closed by direct action: 27–135 a year in 2017–2020, mean 72 [10–13], which implies about 75 years. Consistent in size.
- CC-014E 1,500 illegalities removed by direct action in 30 yearsNotices closed by direct action: 135, 52, 27 and 74 in 2017–2020 [10–13]. 1,500 in 30 years is 50 a year, the same order. No 30-year series found.
Claim Check 014 · Planning enforcement
Fewer notices, or fewer illegalities?
Testing a public claim about planning enforcement in Malta against twenty years of annual reports
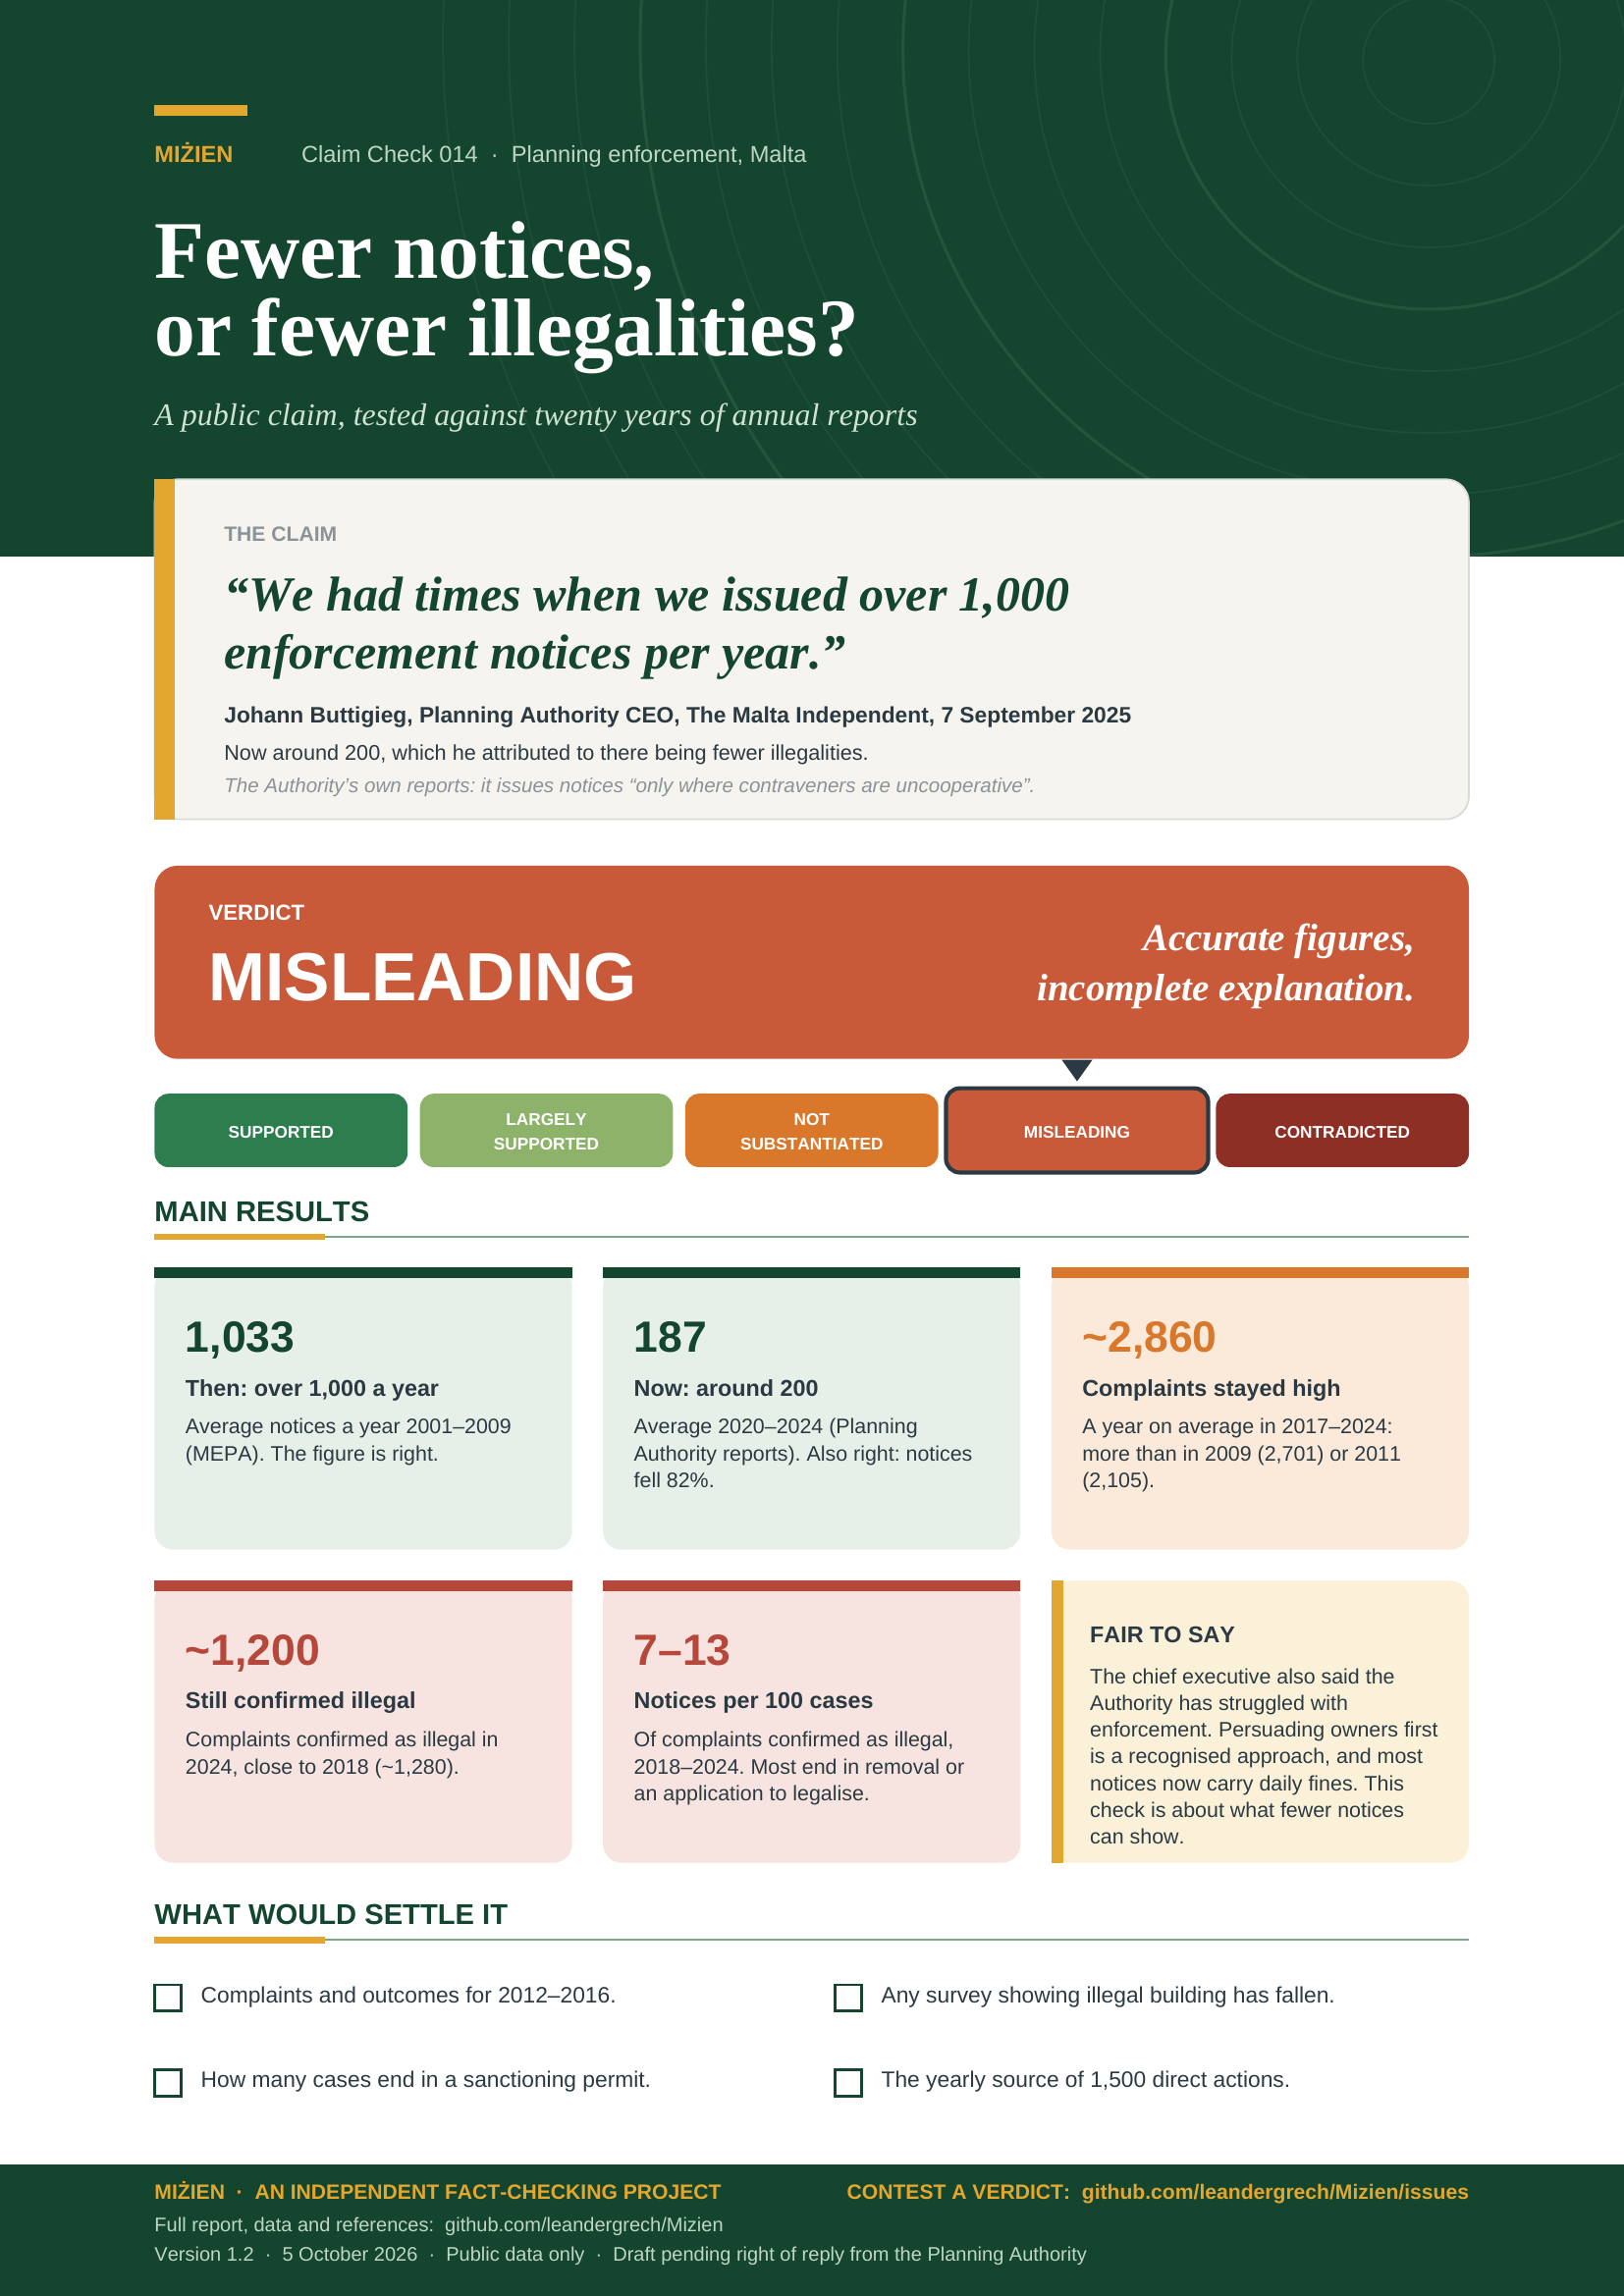
“We had times when we issued over 1,000 enforcement notices per year.”
Johann Buttigieg, Planning Authority CEO, The Malta Independent, 7 September 2025.
Now around 200, which he attributed to fewer illegalities.
Verdict: Misleading Accurate figures; the explanation leaves out how cases are now handled
Version 1.2 · 5 October 2026
TL;DR
In September 2025 the Planning Authority’s chief executive, Johann Buttigieg, told The Malta Independent: “We had times when we issued over 1,000 enforcement notices per year.” The newspaper reports that he said the number had fallen to around 200, which he put down to there being fewer illegalities: “people have recognised that it does not make sense to build illegally.” We tested both parts against MEPA and Planning Authority annual reports for 18 of the 24 years from 2001 to 2024, including every year since 2017.
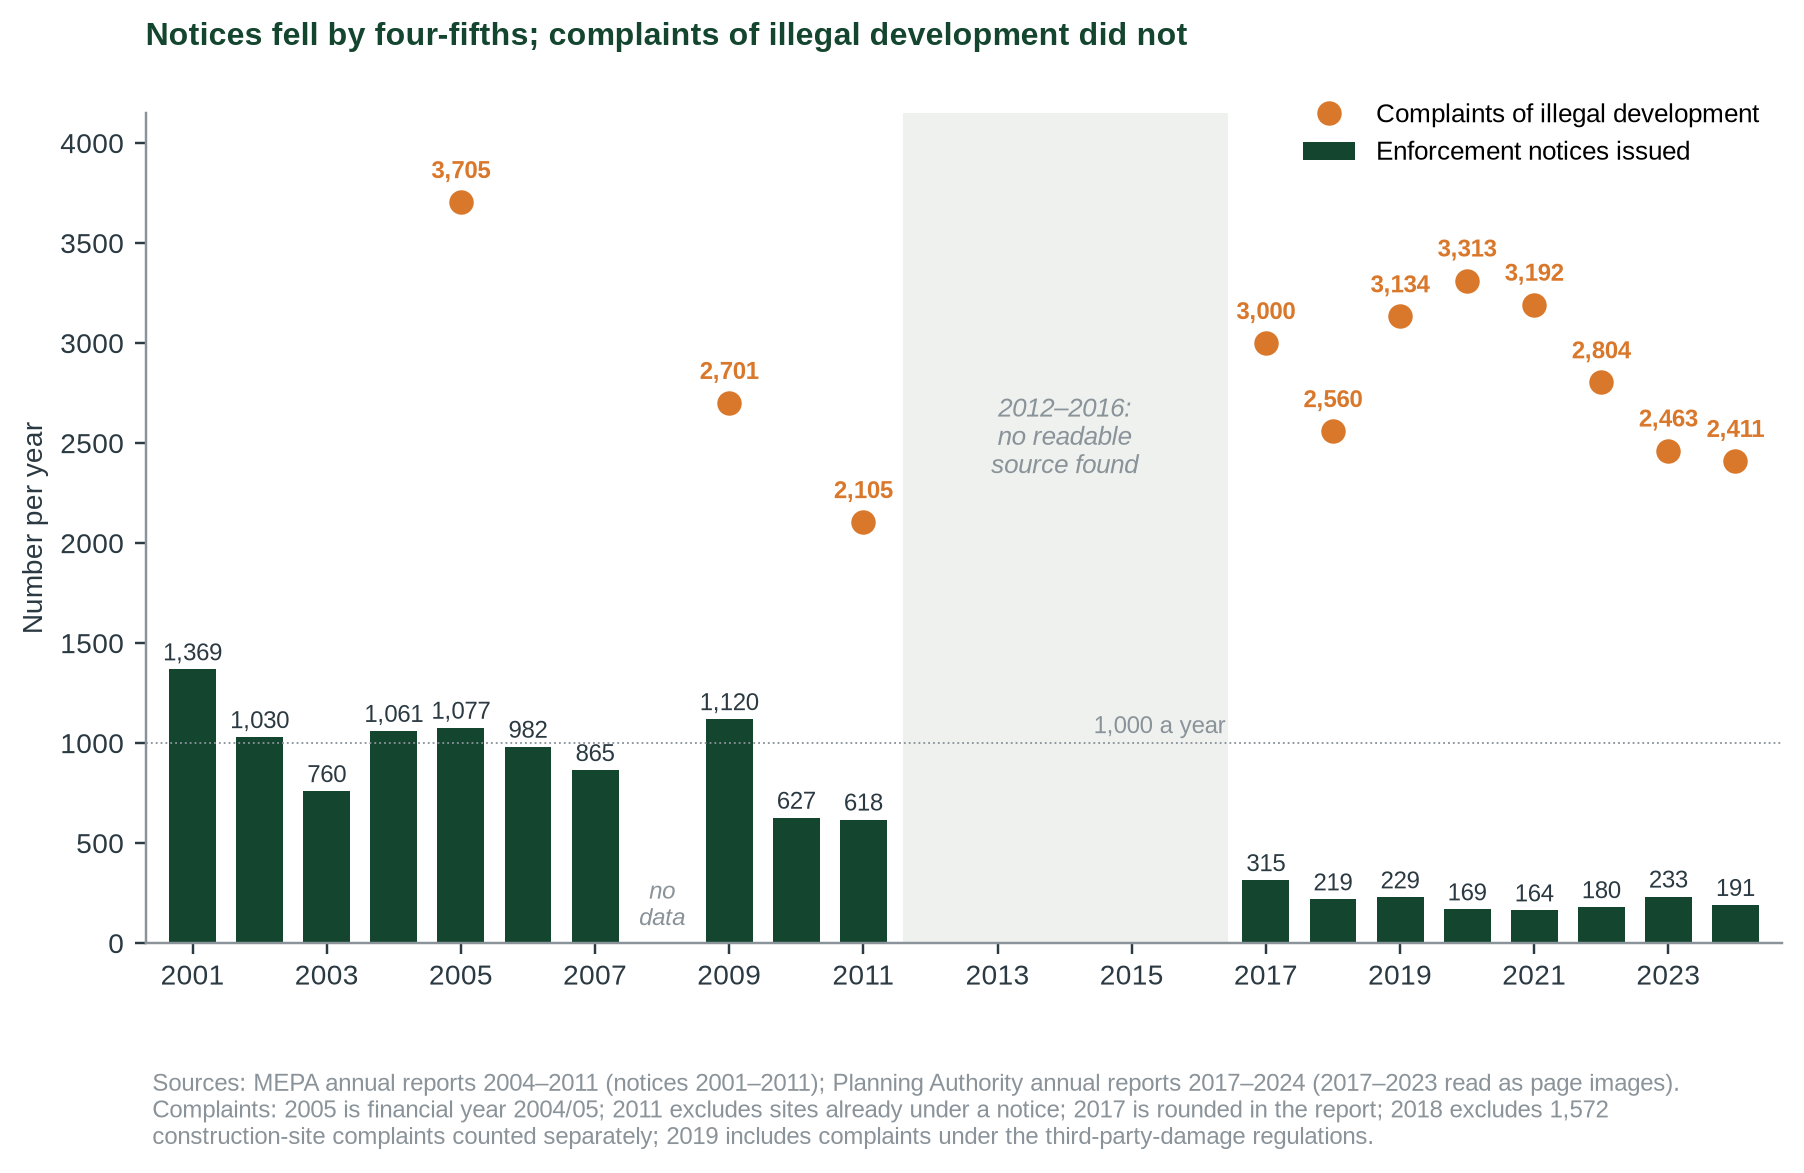
- Both numbers are right. MEPA issued over 1,000 notices in five of the eight years we could read between 2001 and 2009 (1,369 in 2001). The Planning Authority’s own reports give 164–233 a year from 2018 to 2024; the 2020–2024 average is 187.
- Complaints did not fall the same way. Notices fell 82%. Complaints of illegal development averaged about 2,860 a year in 2017–2024, more than in 2009 (2,701) or 2011 (2,105); only financial year 2004/05 (3,705) was higher (Figure 1).
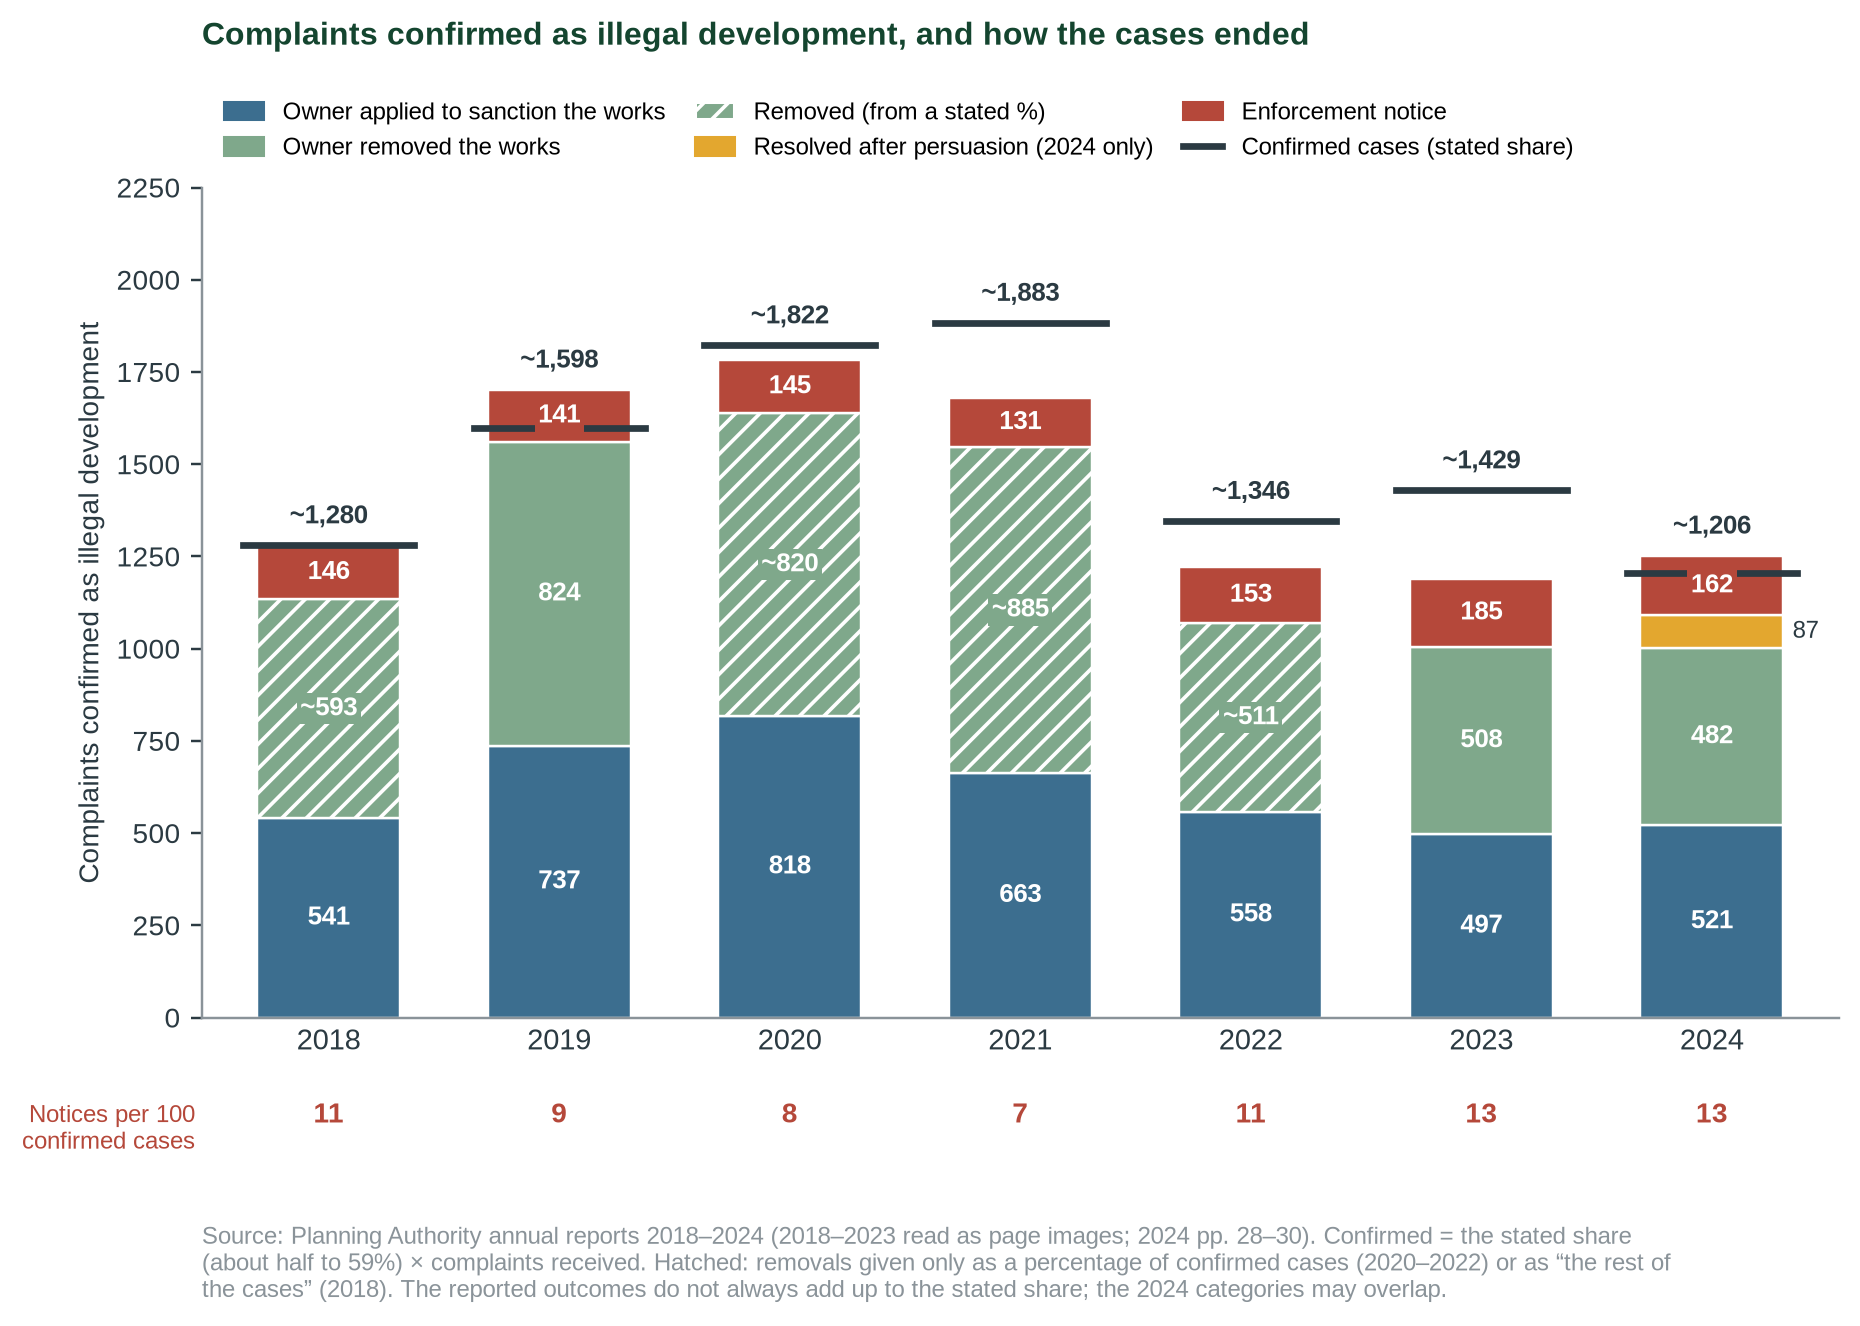
- Confirmed illegal works are about where they were in 2018. About 1,280 complaints were confirmed as illegal development in 2018 and about 1,200–1,250 in 2024. The fall of about a third since 2020 is measured from a 2020–21 peak of about 1,820–1,880 (Figure 2).
- What changed is how cases end. Since 2018 only 7 to 13 in every 100 confirmed cases led to a notice; most ended in an application to sanction the works or removal by the owner. The Authority says so itself: it issues notices “only where contraveners are uncooperative” (2018 and 2019 reports).
- Verdict: misleading (moderate confidence). The figures are accurate, but presenting the fall in notices as a sign of fewer illegalities leaves out the main documented reason: a change in how the Authority handles them. Complaints are only a proxy for illegal building, and 2012–2016, when notices halved, is still missing.
- Supported
- Largely supported
- Not substantiated
- Misleading
- Contradicted
What would move the verdict up
An independent measure of illegal building (for example aerial-photo change detection) showing a fall of the same order as the fall in notices; or data for 2012–2016, when notices halved, showing confirmed cases falling in step.
What would move it down
An independent measure showing illegal building rising while notices fell; or evidence that a growing share of illegal works is being regularised rather than removed.
IN THIS REPORT
1 The claim and what we could verify
The claim comes from an interview with The Malta Independent on Sunday, published on 7 September 2025 [1], which we read in full. The interview took place during public consultation on planning bills and legal notices that would allow some illegal developments to be regularised. We assess the chief executive’s words as reported, not the headline.
| What was said | Form | Our access |
|---|---|---|
| “We had times when we issued over 1,000 enforcement notices per year.” | Direct quote [1] | Read in full |
| Now reduced to around 200, “due to there being fewer illegalities” | Newspaper’s paraphrase [1] | Read in full |
| “I would say that over the last 20 years, people have recognised that it does not make sense to build illegally.” | Direct quote [1] | Read in full |
| Over 500 enforcement notices pending, over 5,000 cases for direct action; 1,500 illegalities removed by direct action over 30 years; clearing the backlog at the current rate “would take us more than 90 years”. | Direct quotes and paraphrase [1] | Read in full |
2 Method
Question. Is the fall from over 1,000 notices a year to about 200 accurate, and does the evidence show that it reflects fewer illegalities?
Evidence. We read the enforcement sections of the MEPA annual reports for 2004 to 2011 [2–8] and of every Planning Authority annual report from 2017 to 2024 [9–16]. The 2017–2023 reports are published only on Issuu; we downloaded their page images by script, read the Compliance and Enforcement Directorate pages, and recorded every value with its printed page, the image address and the image’s SHA-256 checksum (the images are not stored). Version 1.1 used news reports for 2019–2023; the primary values agree except for 2019 notices (229, not the 228 we had derived) and 2023 complaints (2,463 received; the 2,456 reported in the news is the number closed). Every number is in data/cc-014/ and every percentage is recomputed with tools/cc-014-report/calc.py. We searched Crossref and OpenAlex for studies of planning enforcement in Malta and found none; the regulatory literature [19–21] is context.
Confirmed cases. Each year the Authority reports the share of complaints in which it found illegal development (about half to 59%) and how those cases ended. We multiply the stated share by complaints received. The reports are not always consistent: in 2019 the outcomes add up to 51% of complaints closed rather than received, and in 2023 to 48% against a stated 58%. Where removals are given only as a percentage (2020–2022) or as “the rest of the cases” (2018), we derive a count. Confirmed cases are therefore approximate.
Grades. Annual reports and official answers are grade C (official statistics). News reports of them are grade C but second-hand. Verdicts follow the five-point scale in Appendix A.
3 What a notice measures
An enforcement notice is something the regulator does: it records the Authority acting on an illegality it has found. The number issued depends on how many illegalities exist, how many are reported or detected, and how the Authority chooses to deal with them. If the Authority settles more cases by other means, notices fall even if illegal building does not. Counting notices as if they measured the underlying problem is the pattern our methodology calls input as outcome.
The Authority’s own explanation. Its annual reports describe the change openly. In 2017 it wrote of a gradual shift “away from a total Enforcement system”, with fewer notices and, it said, “a positive shift in compliance and self-regulation” [10, p. 18]; no measure of that shift is given. In 2018 and 2019 it said the low number of notices was “in line with the strategy adopted by the Directorate to issue notices only where contraveners are uncooperative” [11, p. 20; 12, p. 18]. From 2020 it describes resolving infringements “through other means which are more efficient” [13, p. 28], and in 2022 calls persuasion “the main strategy” [15, p. 24]. This explains the fall in notices on the Authority’s own terms and supports the chief executive’s account of a deliberate change. It does not show that illegal building has fallen.
Regulatory research supports both sides of the trade-off. Reviews of environmental enforcement find that inspections and sanctions deter future violations, both by the firm sanctioned and by others [19]. The “responsive regulation” tradition argues that regulators should start with persuasion and escalate only when that fails [20, 21]. Neither body of work treats a fall in sanctions as evidence, on its own, of a fall in violations.
4 What the data show
| Indicator | Then | Now | Change | Source |
|---|---|---|---|---|
| Notices a year (average) | 1,033 (2001–09) | 187 (2020–24) | −82% | [2–6, 9, 13–16] |
| Complaints of illegal development | 2,701 (2009) | 2,411 (2024) | −11% | [6, 9] |
| Complaints, longer run | 3,705 (FY 2004/05) | 2,411 (2024) | −35% | [3, 9] |
| Complaints a year (average) | 2,105–2,701 (2009, 2011) | ~2,860 (2017–24) | higher | [6, 8–16] |
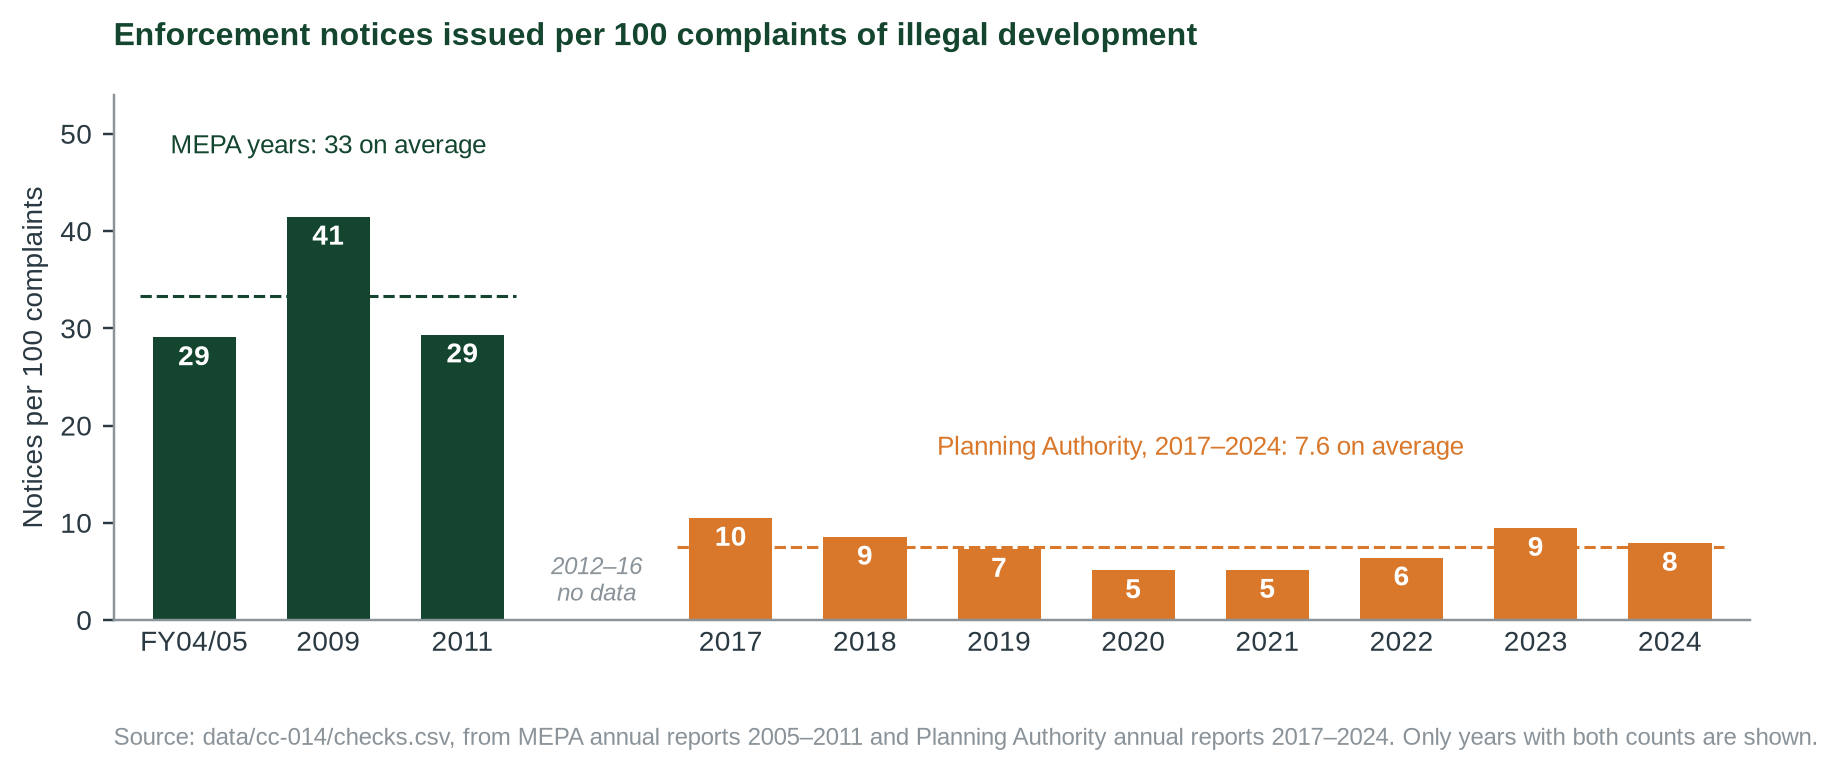
| Notices per 100 complaints | 29–41 (2005–11) | 5–10 (2017–24) | −77% (averages) | calculated |
| Confirmed illegal cases | ~1,280 (2018) | ~1,200–1,250 (2024) | −2% to −6% | [9, 11] |
| Confirmed cases, from the peak | ~1,820–1,880 (2020–21) | ~1,200–1,250 (2024) | −31% to −36% | [9, 13, 14] |
| Notices per 100 confirmed cases | not reported (MEPA) | 7–13 (2018–24) | – | [9, 11–16] |
All values in data/cc-014/checks.csv. 2008 and 2012–2016 are missing: the 2012 and 2014 MEPA reports are scanned images and we found no readable report for 2013, 2015 or 2016. For 2024 the Authority reports “circa half” of 2,411 complaints as confirmed (about 1,206), but its four outcome categories sum to 1,252 (52%); hence the range.
Reading across the data
- The headline numbers are accurate. “Over 1,000 a year” matches 2001, 2002, 2004, 2005 and 2009; “around 200” matches every year from 2018 to 2024 (164–233). The Authority issued 315 in 2017.
- Complaints did not halve, let alone fall by four-fifths. They were 2,105 in 2011, peaked at 3,313 in 2020 and were about 2,400 in 2023 and 2024. The Authority stopped accepting anonymous reports in 2024 [18]; in 2022 and 2023 it said about half of all complaints were anonymous [15, 16].
- Few confirmed cases end in a notice, and that has not changed since 2018. The Authority confirmed roughly 1,200–1,900 illegal developments a year after complaints, and 7–13 in every 100 led to a notice. In 2024 about six times as many confirmed cases ended in a sanctioning application or removal by the owner (521 + 482 = 1,003) as in a notice (162); in 2019, eleven times (737 + 824 against 141) [9, 12].
- The steepest fall lies in the gap. Notices halved between 2011 (618) and 2017 (315), years for which we found no readable report. The 2017 report already presents the move away from “a total Enforcement system” as the strategy of earlier years [10, p. 18]. MEPA’s 2007 report had attributed an earlier fall partly to closer monitoring of works in progress [5]; the 2024 report attributes the 18% fall that year to persuading contraveners first [9, 18].
5 Where the evidence points different ways
Q1 Are there fewer illegalities than before?
POSSIBLY SOME; NOT FOUR-FIFTHS FEWEREVIDENCE FOR THE CLAIM'S IMPRESSION
Complaints are lower than in 2004/05 (−35%), and confirmed cases fell by about a third from their 2020–21 peak. Most notices now carry daily fines, and in 2017 the Authority reported “a positive shift in compliance” [10]. Higher fines and the sanctioning route may have changed behaviour, as the chief executive says.
EVIDENCE AGAINST
Complaints averaged about 2,860 a year in 2017–2024, above 2009 (2,701) and 2011 (2,105). Confirmed cases in 2024 (about 1,200–1,250) were close to 2018 (about 1,280), and between about 1,200 and 1,900 complaints a year were confirmed as illegal development throughout 2018–2024.
Q2 Why did notices fall?
MAINLY A CHANGE IN PRACTICEEVIDENCE FOR THE CLAIM'S IMPRESSION
Fewer new illegalities would mean fewer notices. Owners now more often remove works once contacted, which is the outcome enforcement aims for.
EVIDENCE AGAINST
Notices per complaint fell about four-fold (33 to 7.6 per 100 on average). Every Planning Authority report since 2017 explains the low number of notices by its strategy of issuing them only where contraveners do not cooperate; hundreds of cases a year end in applications to legalise the works [9–16].
Q3 Do complaints measure illegal building?
ONLY PARTLYEVIDENCE FOR THE CLAIM'S IMPRESSION
Complaints are the main way the Authority learns of illegal works, and the share confirmed (about half to 59%) is reported each year.
EVIDENCE AGAINST
Complaints depend on public vigilance and on rules that changed: construction-site complaints were counted separately in 2018, third-party-damage complaints were included in 2019, and anonymous reports (about half in 2022–23) stopped in 2024. No independent count of illegal building, such as aerial-photo change detection, has been published.
6 Testing the claim
| Sub-claim | What the evidence shows | Rating |
|---|---|---|
| A. “We had times when we issued over 1,000 enforcement notices per year” | 1,369 (2001), 1,030 (2002), 1,061 (2004), 1,077 (2005), 1,120 (2009) [2–6]. | ACCURATE |
| B. Now around 200 | 164–233 a year, 2018–2024 (191 in 2024); 315 in 2017 [9–16]. | ACCURATE |
| C. The fall is due to fewer illegalities | Notices fell 82%; complaints fell 11–35% since 2004–09 and averaged about 2,860 a year in 2017–24. Confirmed cases in 2024 were close to 2018, and only 7–13 in 100 ended in a notice. The Authority attributes the fall to its strategy [9–16]. | MISLEADING |
| D. Over 5,000 cases awaiting direct action; over 90 years to clear | Pending notices: almost 7,000 (end 2018), 6,119 (2019), almost 5,600 (2020) [11–13]; 5,382 (end 2021) [17]. Notices closed by direct action: 27–135 a year in 2017–2020, mean 72 [10–13], which implies about 75 years. Consistent in size. | BROADLY CONSISTENT |
| E. 1,500 illegalities removed by direct action in 30 years | Notices closed by direct action: 135, 52, 27 and 74 in 2017–2020 [10–13]. 1,500 in 30 years is 50 a year, the same order. No 30-year series found. | PARTLY TESTED |
7 Verdict and requests for evidence
Accurate figures; the explanation leaves out the main documented cause. Confidence: moderate. Based on MEPA and Planning Authority annual reports, which can be shown.
Why. (1) Both figures are accurate. (2) Complaints of illegal development fell far less than notices, and in 2024 about as many complaints were confirmed as illegal (about 1,200–1,250) as in 2018 (about 1,280). (3) Only 7–13 in every 100 confirmed cases now end in a notice, as more cases end in applications to legalise the works or in removal after contact, and the Authority’s own reports give that strategy as the reason for the low number of notices. Presenting the fall in notices as evidence of fewer illegalities therefore gives an inaccurate overall impression, which our scale calls Misleading.
What this verdict does not say. It does not say that illegal building has increased, that the persuasion-first approach is wrong, or that anyone acted in bad faith. A fuller statement would read: “We used to issue over 1,000 notices a year; now about 200, because we issue them only where owners do not cooperate, and most cases end in removal or a sanctioning application. Complaints are about 2,400 a year and about half are still confirmed as illegal.”
Evidence we are asking for
- Complaints, confirmed cases, notices and outcomes for 2012–2016, when notices halved, to close the gap in the series.
- The base of the “confirmed” percentage each year, and counts (not only percentages) of cases closed by removal in 2020–2022.
- Any analysis behind the statement that illegalities have fallen (for example aerial or satellite surveys).
- How many confirmed cases each year end in a sanctioning permit, and how many of those permits are granted.
- The source of the figure of 1,500 direct actions over 30 years, by year.
8 Limitations
- Complaints and confirmed cases are proxies for illegal building. They depend on public reporting and on Authority rules, which changed (a reporting app was introduced; about half of complaints were anonymous in 2022–23, and anonymous reports stopped in 2024).
- Definitions shift. MEPA reported by financial year until about 2006; the 2011 complaint count excludes sites already under a notice; the 2009 figures add the Gozo Office. The 2017 complaint count is rounded (3,000) and its 315 “enforcement notices” (192 + 123) do not match the 2018 report’s “15% fall” to 219, which implies about 258. The 2018 report counts 1,572 construction-site complaints and 310 construction-site stop notices separately; the 2019 count includes third-party-damage complaints.
- Confirmed cases are approximate: the stated share is applied to complaints received, the base of that share varies, the reported outcomes do not always add up to it, and removals for 2018 and 2020–2022 are derived. The 2020 report says complaints rose by 139 on 2019, but the 2019 report’s count implies 179.
- 2008 and 2012–2016 are missing. Notices halved between 2011 and 2017, so the largest fall is not documented year by year; a steady decline or a sudden policy change in those years would not change the comparison of endpoints, but would change how it is explained.
- 2024 values are from the 2024 report as read on 3 October 2026; it could not be re-read on 5 October (automated access blocked). Pending notices at the end of 2021 are second-hand [17].
- No peer-reviewed study of planning enforcement in Malta was found; the regulatory literature is used for context only and was read as abstracts.
References
- [1] The Malta Independent (7 Sep 2025). CEO will not say PA failed in enforcement duties, but admits it has struggled. Interview with Johann Buttigieg. https://www.independent.com.mt/articles/2025-09-07/local-news/CEO-will-not-say-PA-failed-in-enforcement-duties-but-admits-it-has-struggled-6736272936
- [2] MEPA (2004). Annual Report and Accounts 2004: Enforcement Statistics (notices 2001–2004). https://era.org.mt/wp-content/uploads/2019/05/MEPA-Annual-Report-2004.pdf
- [3] MEPA (2005). Annual Report and Accounts 2005: table 3; complaints. https://era.org.mt/wp-content/uploads/2019/05/Annual-Report-2005.pdf
- [4] MEPA (2006). Annual Report and Accounts 2006: Enforcement. https://era.org.mt/wp-content/uploads/2019/05/MEPA-_AnnualReport2006.pdf
- [5] MEPA (2007). Annual Report 2007: Follow up of Stop/Enforcement Notices. https://era.org.mt/wp-content/uploads/2019/05/MEPA-Annual-Report-2007.pdf
- [6] MEPA (2009). Annual Report 2009: Enforcement; Gozo Office. https://era.org.mt/wp-content/uploads/2019/05/Annual-Report-2009.pdf
- [7] MEPA (2010). Annual Report 2010: Enforcement Notices. https://era.org.mt/wp-content/uploads/2019/05/MEPA-AR2010a.pdf
- [8] MEPA (2011). Annual Report 2011: Enforcement Directorate. https://era.org.mt/wp-content/uploads/2019/05/Annual-Report-2011-Final.pdf
- [9] Planning Authority (2025). Annual Report 2024: Compliance Enforcement Directorate, pp. 28–30. https://www.parlament.mt/media/134019/pa-annual-report-2024.pdf
- [10] Planning Authority (2018). Annual Report 2017: Compliance and Enforcement Directorate, pp. 18–20. Read as page images on Issuu. https://issuu.com/planningauthority/docs/pa_annual_report_2017
- [11] Planning Authority (2019). Annual Report 2018: Compliance & Enforcement Directorate, pp. 20–24. Read as page images on Issuu. https://issuu.com/planningauthority/docs/annual_report_2018_pa_march_final
- [12] Planning Authority (2020). Annual Report 2019: Compliance & Enforcement Directorate, pp. 17–18. Read as page images on Issuu. https://issuu.com/planningauthority/docs/annual_report_2019
- [13] Planning Authority (2021). Annual Report 2020: Compliance and Enforcement Directorate, pp. 27–29. Read as page images on Issuu. https://issuu.com/planningauthority/docs/pa_2020_annual_report_v3
- [14] Planning Authority. Annual Report 2021 (on Issuu 9 Jan 2024): Compliance and Enforcement Directorate, pp. 28–29. Read as page images. https://issuu.com/planningauthority/docs/pa_ar_2022_cmyk_single_page_ver2
- [15] Planning Authority. Annual Report 2022 (on Issuu 9 Jan 2024): Compliance & Enforcement Directorate, pp. 23–24. Read as page images. https://issuu.com/planningauthority/docs/20230117_pa_cd_annual_report_2022_web_final
- [16] Planning Authority (2025). Annual Report 2023: Compliance & Enforcement Directorate, pp. 23–24. Read as page images on Issuu. https://issuu.com/planningauthority/docs/pa_annual_report_2023
- [17] The Malta Independent (31 Jan 2022). Planning Authority says there are over 5,000 pending enforcement notices. (PA data; second-hand ◆.) https://www.independent.com.mt/articles/2022-01-31/local-news/Planning-Authority-says-there-are-over-5-000-pending-enforcement-notices-6736240240
- [18] MaltaToday (2025). 2,400 reports of suspected illegal works in 2024. (Report of the PA Annual Report 2024.) https://maltatoday.com.mt/environment/townscapes/134952/2400_reports_of_suspected_illegal_works_in_2024
- [19] Gray W.B., Shimshack J.P. (2011). The effectiveness of environmental monitoring and enforcement: a review of the empirical evidence. Review of Environmental Economics and Policy 5(1):3–24. doi:10.1093/reep/req017. (Abstract read.) https://doi.org/10.1093/reep/req017
- [20] Gunningham N. (2017). Compliance, deterrence and beyond. In Compliance and Enforcement of Environmental Law, Edward Elgar, pp. 63–73. doi:10.4337/9781783477685.iv.4. (Abstract read.) https://doi.org/10.4337/9781783477685.iv.4
- [21] Ayres I., Braithwaite J. (1992). Responsive Regulation. Oxford University Press. doi:10.1093/oso/9780195070705.001.0001. (Cited via [20] ◆.)
- [22] MiŻien. Data and calculations: data/cc-014/ (pa_enforcement_series.csv, pa_annual_reports_2017_2023.csv, outcomes_by_year.csv, checks.csv); tools/cc-014-report/calc.py.
Appendix A: series standards and verdict scale
Every investigation in this series follows the same rules so that verdicts are comparable and challengeable.
| Verdict | Meaning |
|---|---|
| SUPPORTED | Evidence consistently backs the claim as stated. |
| LARGELY SUPPORTED | Backed by the evidence, with minor caveats that do not change the substance. |
| NOT SUBSTANTIATED | Stated more strongly than the evidence offered or available allows. May be true in some conditions but has not been shown. |
| MISLEADING | Omits material facts so that the overall impression is inaccurate, even if individual statements are defensible. |
| CONTRADICTED | The available evidence points against the claim. |
Confidence
High: multiple independent lines of evidence agree. Moderate: evidence is relevant but incomplete or indirect. Low: evidence is thin, second-hand or conflicting.
Evidence grades
A experiment · B observational study with a control or gradient · C review, guidance or official statistics · D assertion or anecdote. ◆ marks a source known only second-hand.
Standards
- Quote the speaker, not the headline, with outlet and date, and link the original where possible.
- Separate the claim from the evidence offered for it, and say who made which statement.
- Grade the evidence and show differing views side by side where the evidence is unsettled.
- State what we could not access or verify, and what would change the verdict either way.
- Ask for the missing evidence in specific, answerable requests.
- Offer a right of reply where a check finds a claim Not substantiated, Misleading or Contradicted (or a pledge Not measurable, Off track or Missed), before wider circulation, and append responses.
- Correct errors openly with a version number and change log.
- Whistle-blow only on evidence: a verdict of Misleading or Contradicted requires documents or data that can be shown, not inference.
- Check every side. Government, opposition, NGOs and developers are held to the same standard.
Appendix B: revision log
| Version | Date | Change |
|---|---|---|
| 1.0 | 3 Oct 2026 | First issue. Draft pending right of reply from the Planning Authority. |
| 1.1 | 5 Oct 2026 | Corrections: (1) 2020 complaints were called “the highest in the series”; now “the highest we could read after FY 2004/05 (3,705)”. (2) “More than three times as many” cases ending in a sanctioning application or removal as in a notice → “about six times” ((521 + 482) / 162 = 6.2). (3) 2019 complaints 3,174 (derived from a news report) → 3,134 (PA Annual Report 2019, p. 17; Figure 1 redrawn). (4) 2024 confirmed cases ~1,200 → ~1,200–1,250 and the 2020–24 change −34% → −31% to −34%, because the four outcome categories sum to 1,252, more than the “circa half” (1,206) reported. Flyer: “Settled by legalising” → “Applications to legalise” (applications, not permits). Verdict and confidence unchanged. |
| 1.2 | 5 Oct 2026 | Upgrade: Planning Authority annual reports 2017–2023 read as Issuu page images and used as the primary series in place of news reports [10–16]; each value recorded with printed page, image URL and SHA-256. (1) Added 2017 (315 notices; about 3,000 complaints) and 2018 (219; 2,560); gap 2008 and 2012–2018 → 2008 and 2012–2016. (2) 2019 notices 228 (derived) → 229 [12, p. 18]; 2023 complaints 2,456 → 2,463 (2,456 is complaints closed) [16, p. 23]; 2020–2023 notices (169, 164, 180, 233) and 2020 complaints (3,313) confirmed; 2021 (3,192) and 2022 (2,804) complaints added. (3) Notices per 100 complaints 29–42 (2005–11) and 5–10 (2019–24) → 29–41 (rounding) and 5–10 (2017–24). (4) New: confirmed cases 2018–2024 with outcomes (Figure 2): ~1,280 in 2018 against ~1,200–1,250 in 2024, so the −31% to −34% since 2020 is now described as from a 2020–21 peak (−31% to −36%); 7–13 notices per 100 confirmed cases. New Figure 3 (notices per 100 complaints); Figure 1 redrawn; the 2024-only outcome chart is now part of Figure 2. (5) Added the Authority’s stated policy (notices “only where contraveners are uncooperative”, 2018 p. 20, 2019 p. 18) and a deterrence note (daily fines since 2012 [16, p. 24]; on 50% → 78% of notices, 2018 → 2023). (6) Sub-claim D now uses primary backlog and direct-action figures (73 → about 75 years); E partly tested (27–135 a year, 2017–2020). (7) The “139 more complaints in 2020” is in the Authority’s own 2020 report, not only in the news report. MaltaToday (2021, 2024) references replaced by the primary reports; references renumbered. Verdict and confidence unchanged. |
Sources and archived copies
-
CEO will not say PA failed in enforcement duties, but admits it has struggled, The Malta Independent, 7 Sep 2025.
Original · not yet archived
The claim. Read in full 3 Oct 2026. The 'around 200' and 'fewer illegalities' parts are the newspaper's paraphrase; the 1,000 figure and the 'people have recognised' sentence are direct quotes. -
Planning Authority Annual Report 2024, Planning Authority, 2025.
Original · not yet archived
Primary evidence: Compliance Enforcement Directorate, pp. 28-30. -
MEPA Annual Reports 2004, 2005, 2006, 2007, 2009, 2010, 2011, Malta Environment and Planning Authority, 2004-2011.
Original · not yet archived
Primary evidence: notices issued 2001-2011 and complaints; all URLs in literature/CC-014/references.bib. -
Planning Authority Annual Reports 2017-2023 (Compliance and Enforcement Directorate), Planning Authority, 2018-2025.
Original · not yet archived
Primary evidence for 2017-2023 notices, complaints, confirmed shares and outcomes; read 5 Oct 2026 as Issuu page images (2017 pp. 18-20; 2018 pp. 20-24; 2019 pp. 17-18; 2020 pp. 27-29; 2021 pp. 28-29; 2022 pp. 23-24; 2023 pp. 23-24). Every value with page, image URL and SHA-256 in data/cc-014/pa_annual_reports_2017_2023.csv; Issuu links for each year in literature/CC-014/references.bib. -
Buttigieg stops short of direct action against Carlo Stivala's new illegal structure, The Shift News, 2 Oct 2026.
Original · fetched and fingerprinted 2026-10-10; no public snapshot yet
Lead only (current enforcement controversy; not read in full). Context, not the claim.
Right of reply
The body concerned has not yet been asked to reply. Its response will be published here, beside the verdict.
Connections
How this claim relates to the others: who made it, the themes it shares with other claims, and the patterns it shows. A connection is a reason to read two checks side by side. It does not make either one right or wrong. How connections are found.
Who made it
Johann Buttigieg, Planning Authority CEO for Planning Authority
Other claims by Johann Buttigieg 2
- CC-013 Permits keep property prices in check (Largely supported)
- CC-015 'Three weeks left' at the PA (not yet checked)
Other claims by Planning Authority 1
Linked directly 5
Claims that share a theme with this one. A theme is a cause, a mechanism, a target or a way of presenting figures that the editors have found in several claims; its strength says how close the link is.
Planning, housing and land take Shared driver · Strong
Permit volumes, enforcement and housing demand drive land take. Claims about prices, enforcement, reclamation and land loss rest on the same planning system and the same data (PA permits, NSO prices, land-cover maps).
- CC-013 Permits keep property prices in check (Largely supported)
- CC-017 Land reclamation outside the Freeport (Not substantiated)
- CC-018 IMF 'confirms' MDA on housing (Largely supported)
- CC-019 830,000 m2 of land lost in five years (Not substantiated)
- CC-123 KPMG: 8,716 residential units approved in 2024, up 7.4% (not yet checked)
Same pattern
Pattern tags name a recurring way a claim can mislead. They describe the statement, not the speaker.
Input-as-outcome
Effort counted (trees planted, kilograms separated) is presented as if it were the result (trees surviving, recycling rate).
Two steps away 12
Not linked to this claim directly, but linked to a claim that is. These are found by following the links, not chosen by the editors, so they are looser: they show where one theme meets another.
- CC-001 Upper Barrakka concrete (Not substantiated)through Planning, housing and land takeCC-019Sealed soil and concrete
- CC-002 Comino tree compensation (Largely supported)through Planning, housing and land takeCC-017Waste and construction or Planning, housing and land takeCC-019Sealed soil and concrete
- CC-004 'Strong progress' in waste separation (Not substantiated)through Planning, housing and land takeCC-017Waste and construction
- CC-008 Flyovers and congestion (Not substantiated)through Planning, housing and land takeCC-017Waste and construction or Planning, housing and land takeCC-019Sealed soil and concrete
- CC-012 Ta' Qali gravel and grass (Contradicted)through Planning, housing and land takeCC-019Sealed soil and concrete
- CC-058 96% of farmland in use (not yet checked)through Planning, housing and land takeCC-019Planning, housing and land take
- CC-059 Subsidies are 20% of farm output (not yet checked)through Planning, housing and land takeCC-019Farmland and farming pressure
- CC-060 7,000 first-time buyers helped (not yet checked)through Planning, housing and land takeCC-013Planning, housing and land take
- CC-062 Construction is 9-14% of the economy (Largely supported)through Planning, housing and land takeCC-018Planning, housing and land take or Planning, housing and land takeCC-123Planning, housing and land take
- CC-063 Construction waste: 'standstill' warning (Not substantiated)through Planning, housing and land takeCC-017Waste and construction
- CC-127 EU: Malta has the lowest organic share in the EU (not yet checked)through Planning, housing and land takeCC-019Farmland and farming pressure
- CC-130 NGOs: ODZ racecourse policy ends protection (not yet checked)through Planning, housing and land takeCC-019Farmland and farming pressure
Three steps away 16
One step further again. At this distance a connection says more about how the themes fit together than about this claim.
- CC-003 Per-capita emissions vs 2030 projection (Misleading)through Planning, housing and land takeCC-017Waste and constructionCC-004Selective-metric pattern
- CC-007 Within EU limits vs WHO guideline (Largely supported)through Planning, housing and land takeCC-017Waste and constructionCC-004Selective-metric pattern
- CC-010 Tree-planting counts (Largely supported)through Planning, housing and land takeCC-017Waste and constructionCC-002Replanting as currency
- CC-016 Shore-to-ship: 90% less harbour pollution (Misleading)through Planning, housing and land takeCC-017Waste and constructionCC-008Transport, air and climate
- CC-021 Malta-Gozo tunnel traffic (not yet checked)through Planning, housing and land takeCC-017Waste and constructionCC-008Transport, air and climate
- CC-056 Central Link: 'only 254 trees' (not yet checked)through Planning, housing and land takeCC-017Waste and constructionCC-008Replanting as currency
- CC-069 82 million bus trips (not yet checked)through Planning, housing and land takeCC-017Waste and constructionCC-008Transport, air and climate
- CC-072 EUR 15m to take cars off the road (not yet checked)through Planning, housing and land takeCC-017Waste and constructionCC-008Transport, air and climate
- CC-076 36 more vehicles a day (Supported)through Planning, housing and land takeCC-017Waste and constructionCC-008Transport, air and climate
- CC-079 Waste-to-energy: 4.5% of energy (Misleading)through Planning, housing and land takeCC-017Waste and constructionCC-004Waste and construction
- CC-081 Landfill share rising (not yet checked)through Planning, housing and land takeCC-017Waste and constructionCC-004Waste and construction
- CC-082 35 quarries for construction waste (not yet checked)through Planning, housing and land takeCC-017Waste and constructionCC-063Waste and construction
- CC-109 EU: transport is 48% of effort-sharing emissions (Largely supported)through Planning, housing and land takeCC-017Waste and constructionCC-008Transport, air and climate
- CC-111 EU: 621 kg of waste a head, 74% landfilled (Supported)through Planning, housing and land takeCC-017Waste and constructionCC-004Waste and construction
- CC-115 Chamber: congestion cost EUR 770m, 3.4% of GDP (Not substantiated)through Planning, housing and land takeCC-017Waste and constructionCC-008Transport, air and climate
- CC-117 EU: Malta missed recycling targets (reasoned opinion) (not yet checked)through Planning, housing and land takeCC-017Waste and constructionCC-004Waste and construction
Timeline
What was said, what was published before and after it, and each step of this check, in date order. Statements and sources carry the date they were published. The steps of the check carry the date the research was done, from the check's research log. Other statements by the same body on the same topic show whether a position was repeated, changed or corrected.
2004
- 2004 Evidence published MEPA Annual Report and Accounts 2004, MEPA
2005
- 2005 Evidence published MEPA Annual Report and Accounts 2005, MEPA
2006
- 2006 Evidence published MEPA Annual Report and Accounts 2006, MEPA
2007
- 2007 Evidence published MEPA Annual Report 2007, MEPA
2009
- 2009 Evidence published MEPA Annual Report 2009, MEPA
2010
- 2010 Evidence published MEPA Annual Report 2010, MEPA
2011
- 2011 Evidence published MEPA Annual Report 2011, MEPA
2021
- 2021 Reported Planning Authority received 9 reports on illegalities each day in 2020, MaltaToday
2022
- 31 January 2022 Reported Planning Authority says there are over 5,000 pending enforcement notices, The Malta Independent
2024
- May 2024 Earlier statement by Planning Authority on Planning & Housing CC-068 Marsaskala marina shelved (not yet checked)
- 2024 Reported Planning Authority yet to collect EUR 674,740 from pending enforcement notices, MaltaToday
2025
- 2 March 2025 Earlier statement by Johann Buttigieg on Planning & Housing CC-013 Permits keep property prices in check (Largely supported)
- 2025 Reported 2,400 reports of suspected illegal works in 2024, MaltaToday
- 2025 Evidence published Planning Authority Annual Report 2024, Planning Authority
- 7 September 2025 The statement Johann Buttigieg, Planning Authority CEO (this claim)
- 7 September 2025 Statement published CEO will not say PA failed in enforcement duties, but admits it has struggled, The Malta Independent
2026
- 2 October 2026 Reported Buttigieg stops short of direct action against Carlo Stivala's new illegal structure, The Shift News
- 3 October 2026 Added to the claims to check
- 3 October 2026 Version 1.0: first issue First issue. Draft pending right of reply from the Planning Authority.
- 5 October 2026 Version 1.2 Upgrade: Planning Authority annual reports 2017–2023 read as Issuu page images and used as the primary series in place of news reports [10–16]; each value recorded with printed page, image URL and SHA-256. (1) Added 2017 (315 notices; about 3,000 complaints) and 2018 (219; 2,560); gap 2008 and 2012–2018 → 2008 and 2012–2016. (2) 2019 notices 228 (derived) → 229 [12, p. 18]; 2023 complaints 2,456 → 2,463 (2,456 is complaints closed) [16, p. 23]; 2020–2023 notices (169, 164, 180, 233) and 2020 complaints (3,313) confirmed; 2021 (3,192) and 2022 (2,804) complaints added. (3) Notices per 100 complaints 29–42 (2005–11) and 5–10 (2019–24) → 29–41 (rounding) and 5–10 (2017–24). (4) New: confirmed cases 2018–2024 with outcomes (Figure 2): ~1,280 in 2018 against ~1,200–1,250 in 2024, so the −31% to −34% since 2020 is now described as from a 2020–21 peak (−31% to −36%); 7–13 notices per 100 confirmed cases. New Figure 3 (notices per 100 complaints); Figure 1 redrawn; the 2024-only outcome chart is now part of Figure 2. (5) Added the Authority’s stated policy (notices “only where contraveners are uncooperative”, 2018 p. 20, 2019 p. 18) and a deterrence note (daily fines since 2012 [16, p. 24]; on 50% → 78% of notices, 2018 → 2023). (6) Sub-claim D now uses primary backlog and direct-action figures (73 → about 75 years); E partly tested (27–135 a year, 2017–2020). (7) The “139 more complaints in 2020” is in the Authority’s own 2020 report, not only in the news report. MaltaToday (2021, 2024) references replaced by the primary reports; references renumbered. Verdict and confidence unchanged. Verdict in this version: Misleading, moderate confidence.
- 5 October 2026 Evidence reviewed
- 5 October 2026 Version 1.1: corrections Corrections: (1) 2020 complaints were called “the highest in the series”; now “the highest we could read after FY 2004/05 (3,705)”. (2) “More than three times as many” cases ending in a sanctioning application or removal as in a notice → “about six times” ((521 + 482) / 162 = 6.2). (3) 2019 complaints 3,174 (derived from a news report) → 3,134 (PA Annual Report 2019, p. 17; Figure 1 redrawn) [17]. (4) 2024 confirmed cases ~1,200 → ~1,200–1,250 and the 2020–24 change −34% → −31% to −34%, because the four outcome categories sum to 1,252, more than the “circa half” (1,206) reported. Flyer: “Settled by legalising” → “Applications to legalise” (applications, not permits). Verdict and confidence unchanged. all corrections
2027
- 5 October 2027 Coming up: Evidence review due Each finished check is reviewed against new evidence within a year.
Every change to this claim's record is public: history of the record.
Download the report and flyer