CC-009 · Water · Water supply & groundwater
More RO, less WSC groundwater
Largely supported Moderate confidence Draft: no right of reply needed
Claim Check 009 · Water, Malta
More RO, less WSC groundwater
What the Water Services Corporation’s figures show, and what they don’t
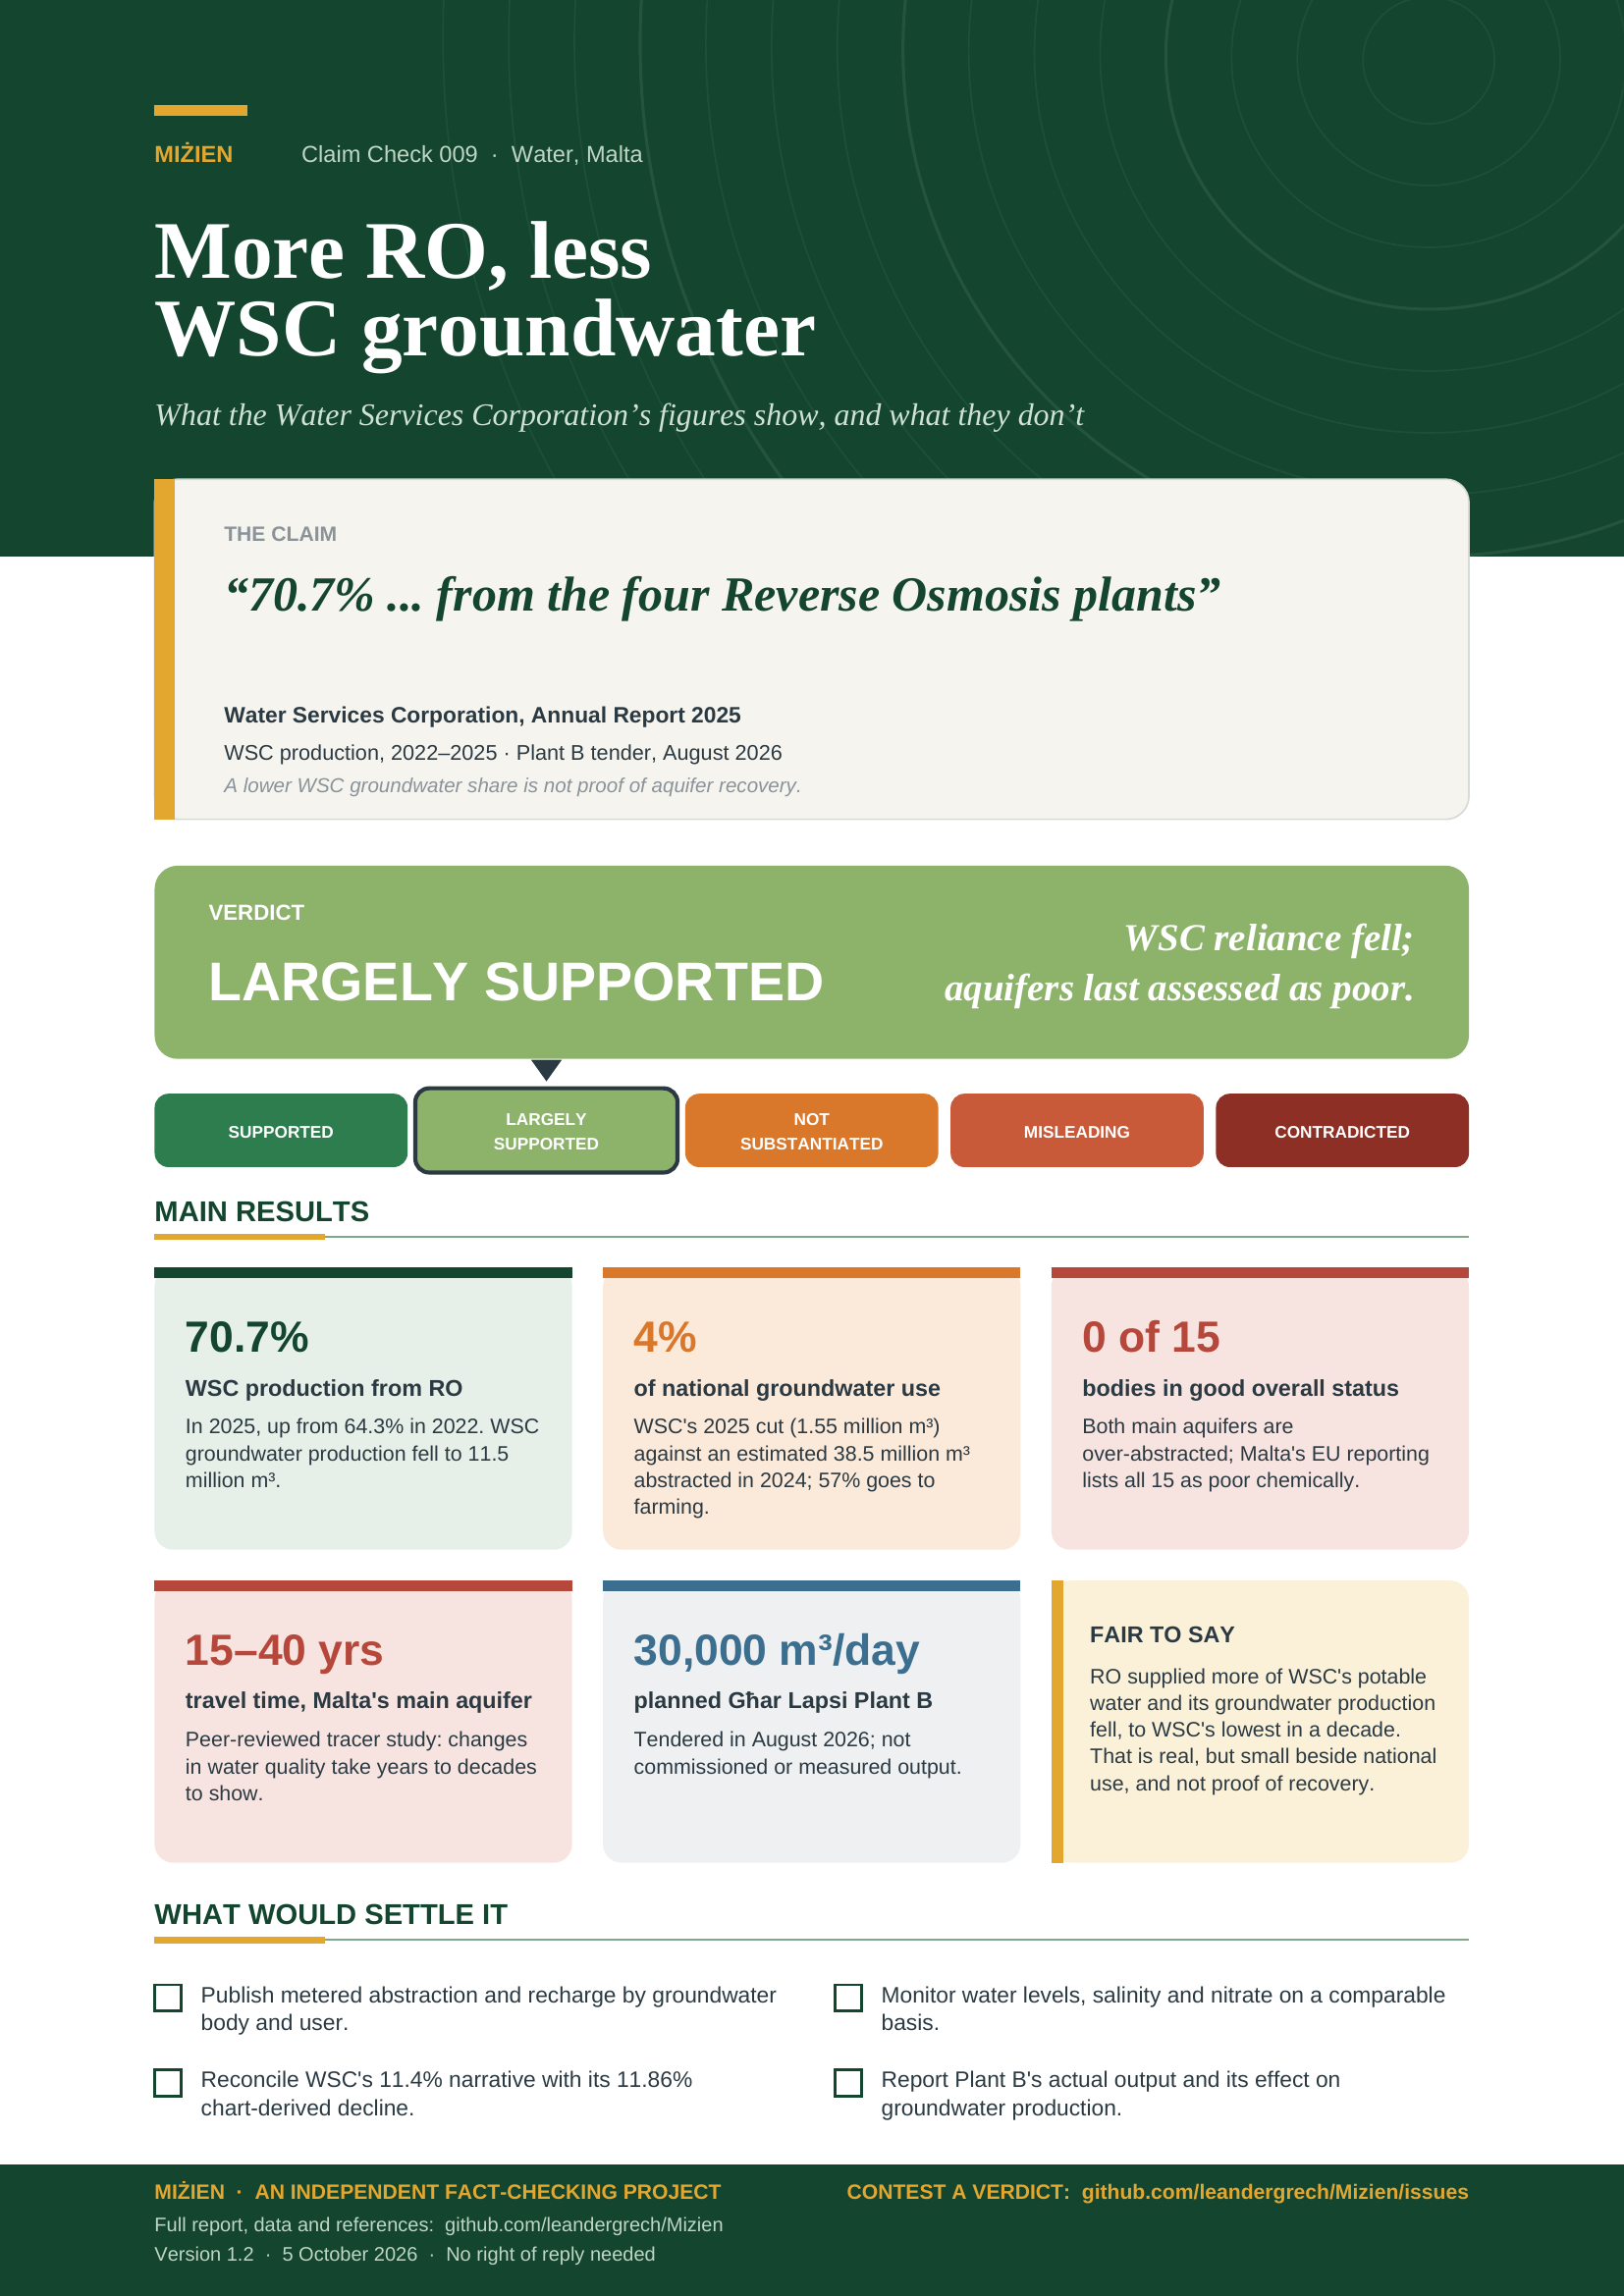
“70.7% ... from the four Reverse Osmosis plants”
Water Services Corporation, Annual Report 2025
Malta potable supply · 2025 production · August 2026 tender
Verdict: Largely supported WSC reliance fell; aquifers last assessed as poor.
Version 1.2 · 5 October 2026
TL;DR
WSC's latest annual report says reverse osmosis supplied 70.7% of its potable-water production in 2025, and that its groundwater production fell to 11.5 million m³, the lowest annual total in a decade. The figures check out against WSC's own series. We set them beside national data and the research on Malta's aquifers: the cut is real but small, and it is not evidence that the aquifers have recovered.
- The source mix changed. Reverse osmosis rose from 64.3% of WSC production in 2022 to 70.7% in 2025 (Figure 1). WSC says its groundwater production fell 11.4% in 2025; its chart values give 11.9%.
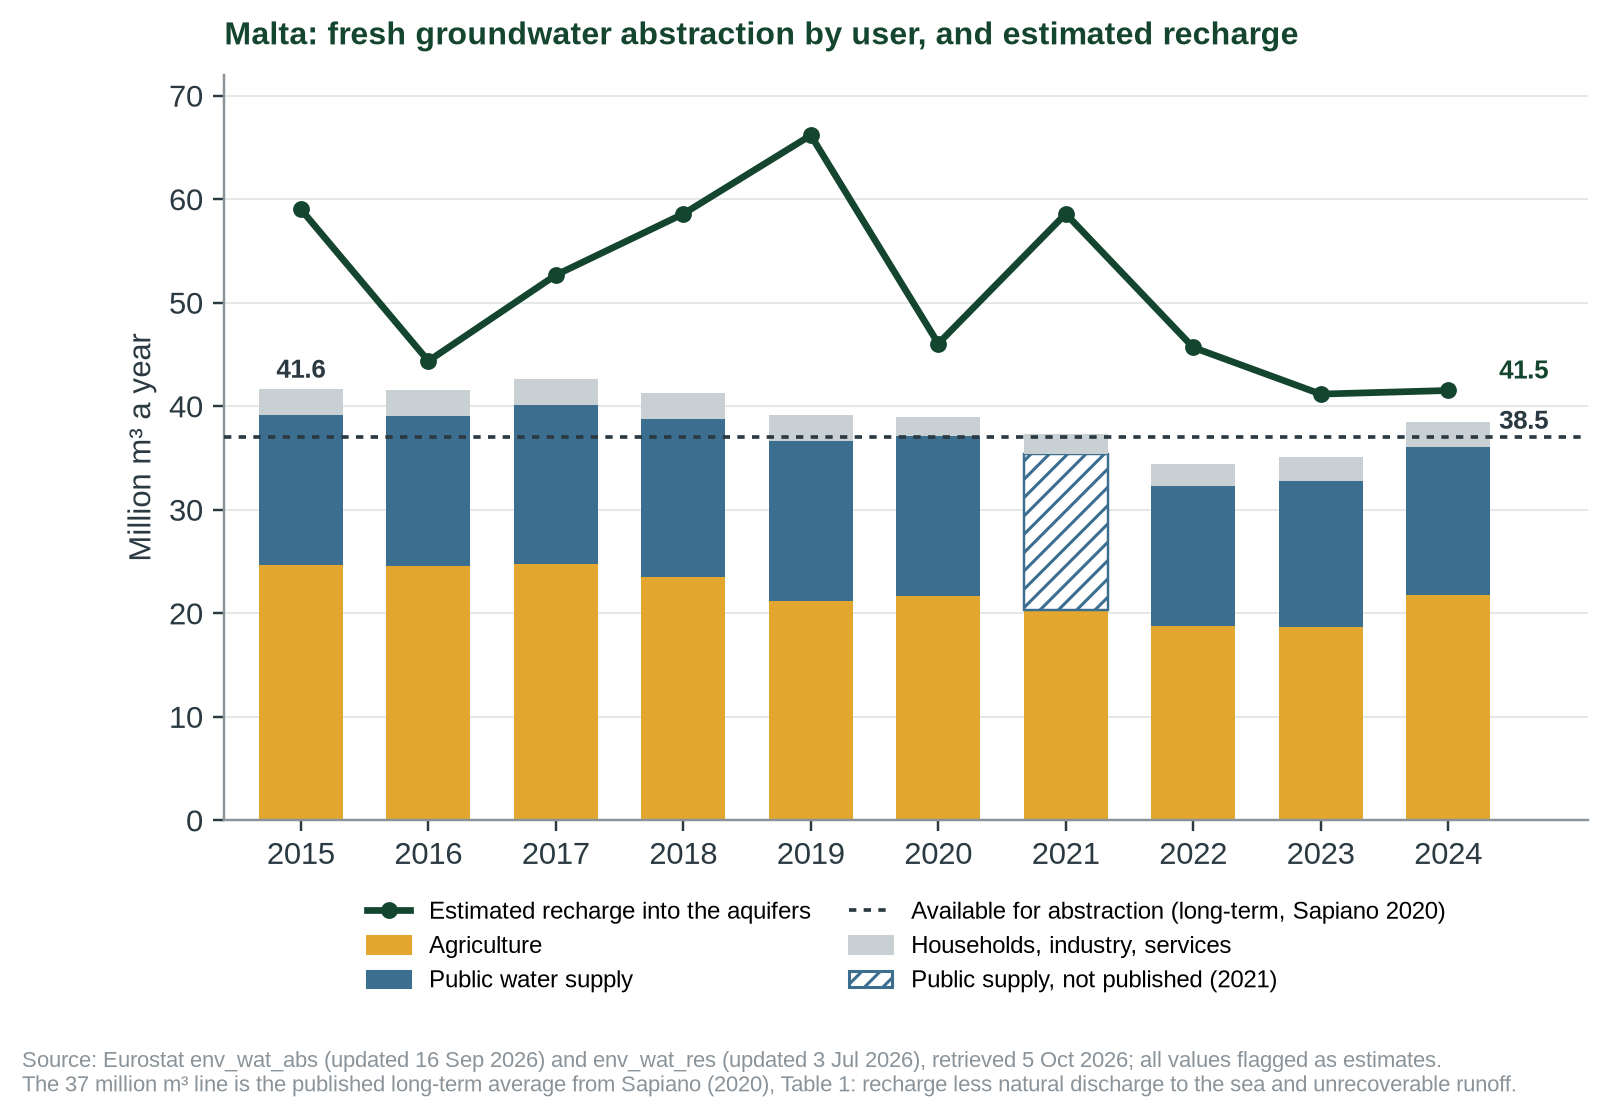
- The cut is about 4% of national abstraction. WSC produced 1.55 million m³ less groundwater in 2025. Malta abstracted an estimated 38.5 million m³ in 2024, 57% of it for agriculture, whose estimated use rose by 3.1 million m³ that year (Figure 2).
- Abstraction is close to what the aquifers can give. Estimated recharge was 41.5 million m³ in 2024. A published water balance puts the groundwater available for abstraction at about 37 million m³ a year.
- No groundwater body is in good status. The River Basin Management Plan names both main aquifers as poor quantitatively; Malta's EU reporting lists four of 15, and all 15 as poor chemically (Figure 3).
- Recovery would be slow to show. A tracer study puts travel times through the main aquifer at 15–40 years on Malta and up to 60 or more on Gozo; nitrate held in the rock keeps reaching the groundwater for years.
- The new plant is tendered, not built. Għar Lapsi Plant B (30,000 m³/day) was tendered in August 2026; bids are due on 30 October 2026.
- Supported
- Largely supported
- Not substantiated
- Misleading
- Contradicted
What would move the verdict up
WSC's reconciled 2024–25 figure and the ten-year series behind “lowest in a decade”; for any claim of recovery, a new status assessment with metered abstraction, recharge, water levels, salinity and nitrate by groundwater body.
What would move it down
Evidence that WSC's 2025 mix, production series or procurement status is materially different from the official records.
IN THIS REPORT
1 What WSC reported
WSC's Annual Report 2025 says 70.7% of its 39.5 million m³ of potable-water production came from four reverse-osmosis plants. It reports 11.5 million m³ of groundwater production, the lowest total in the previous decade, and says the volume was 11.4% lower than in 2024. WSC links the shift to blending for lower salinity in reservoirs [1]. WSC does not say that the aquifers have recovered; this check asks what its figures can and cannot show.
The 2025 report identifies taste and salinity as the immediate reason for increasing the RO proportion. Its statements therefore support reduced WSC reliance on groundwater in the production mix; they do not say that the aquifers had returned to good status.
The 2024 report provides useful context: it described groundwater production as fairly constant while abstraction sources were redistributed, and explained that WSC was reactivating sources to relieve localised pressure. A single year's decline should not be treated as evidence of a sustained aquifer trend [3].
2 Rechecking the production series
We transcribed the annual RO and groundwater values shown in Figure 20 of WSC's 2025 report and recalculated totals, source shares and changes. The script is data/cc-009/calc.py; the inputs and outputs are in data/cc-009/.
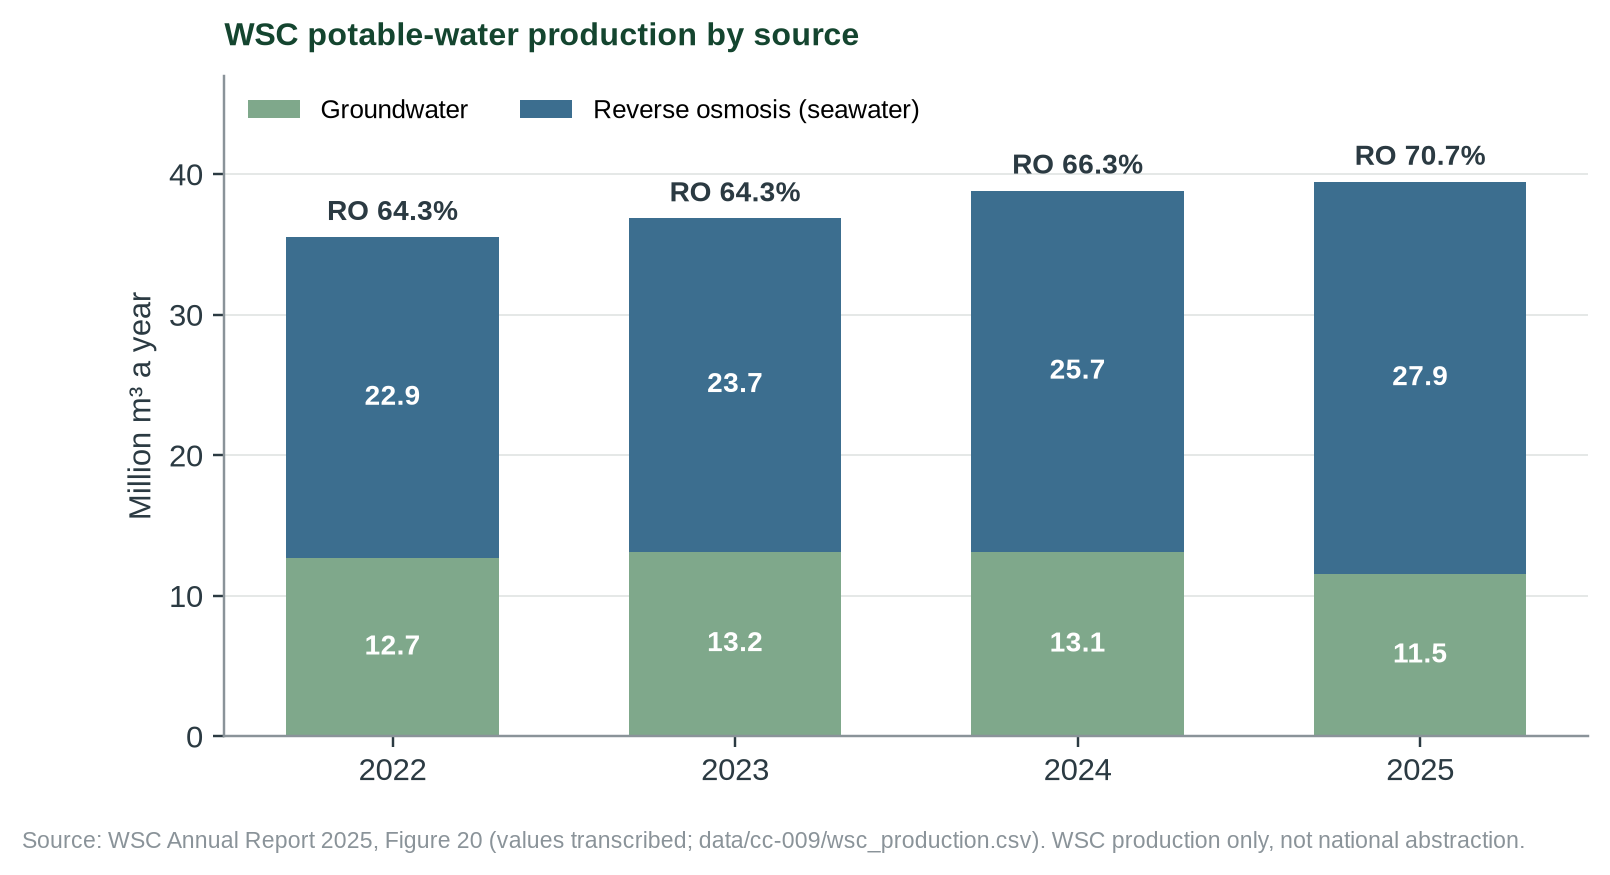
From 2022 to 2025, WSC's groundwater component decreased by 8.95%, while its RO share rose by 6.43 percentage points. WSC's 2025 report narrative says the one-year groundwater decline was 11.4%. The 2024 and 2025 chart entries (13,094,325 m³ and 11,541,256 m³) imply 11.86%. The difference is small but unresolved, so this report does not silently substitute one figure for the other [1]. WSC's own 2022 report gives that year's groundwater production as 486 m³ less than the 2025 chart; the difference does not change any share or percentage shown here [6].
Our series covers 2022–2025 only, so “lowest in a decade” is WSC's statement. Eurostat's separate series of groundwater abstracted for public water supply (a different measure, about 1 million m³ a year higher than WSC's production in 2022–2024) never fell below 13.5 million m³ in 2015–2024 [8]. That is consistent with WSC's statement, but cannot confirm it.
3 National abstraction and recharge
WSC is one groundwater user among several. Eurostat's figures for Malta, all flagged as estimates, show 38.5 million m³ of fresh groundwater abstracted in 2024 [8]. Agriculture took 21.8 million m³ (57%), up from 18.7 million m³ in 2023; public water supply took 14.3 million m³ (37%).
| Measure (million m³) | Value | Year | Source | Grade |
|---|---|---|---|---|
| Fresh groundwater abstraction, all users | 38.46 | 2024 | Eurostat env_wat_abs [8] | C |
| of which agriculture (2023: 18.67) | 21.77 | 2024 | Eurostat [8] | C |
| of which public water supply | 14.28 | 2024 | Eurostat [8] | C |
| WSC groundwater production cut, 2024 to 2025 | 1.55 (4.0% of 38.46) | 2025 | WSC [1]; our calculation | C |
| Estimated recharge into the aquifers | 41.52 | 2024 | Eurostat env_wat_res [8] | C |
| Groundwater available for abstraction, long-term average | 37 | long term | Sapiano 2020, Table 1 [9] | C |
Eurostat values are flagged as estimates; no 2025 national figures are yet published, so the 4% compares different years. Values and query URLs in data/cc-009/eurostat_water.csv and checks.csv.
Three points follow. First, WSC's 2025 cut is small beside national use: about 4% of the 2024 total, and about half the estimated rise in agricultural abstraction in 2024 alone. Second, recharge depends on rainfall and varies widely; the 2023 and 2024 estimates (41.2 and 41.5 million m³) are the lowest in the 2010–2024 series [8]. Third, abstraction equal to 93% of recharge does not leave 7% to spare. The published water balance for Malta sets aside about half of the recharge to the sea-level aquifers as natural discharge to the sea and puts the groundwater available for abstraction at about 37 million m³ a year, against abstraction of 38–41 million m³; it gives a water exploitation index of 78% over the long term and 89% in 2019, where the EU treats 40% as high water stress [9].
4 Groundwater-body status
The 3rd River Basin Management Plan for 2021–2027 is the latest completed national plan identified on ERA's website. Its Chapter 6 status tables assess 15 groundwater bodies. It reports both the Malta and Gozo Mean Sea Level aquifer systems as poor quantitatively, meaning they are over-abstracted under the plan's water-balance assessment [2]. Malta's reporting of the same plan cycle to the EEA, with status assessed in 2021, does not match the plan on every count [7]. The table shows both.
| Indicator (15 bodies) | Plan, Chapter 6, as recorded in our notes [2] | Malta's EU reporting, 3rd cycle [7] |
|---|---|---|
| Overall status | 15 of 15 poor; good overall status requires both quantity and quality to pass. | 15 of 15 poor (all fail chemical status). |
| Quantitative status | Poor: Malta and Gozo Mean Sea Level aquifers. | 4 poor: Malta and Gozo Mean Sea Level, Pwales Coastal and Marfa Coastal. |
| Chemical status | 14 poor; nitrate is the main failing parameter, but not the only one. | 15 poor. |
| Nitrate standard | 12 of 15 exceed 50 mg/L; Gozo Mean Sea Level, Comino Mean Sea Level and Mellieħa Perched are named exceptions. | Not given by body in the layer queried. |
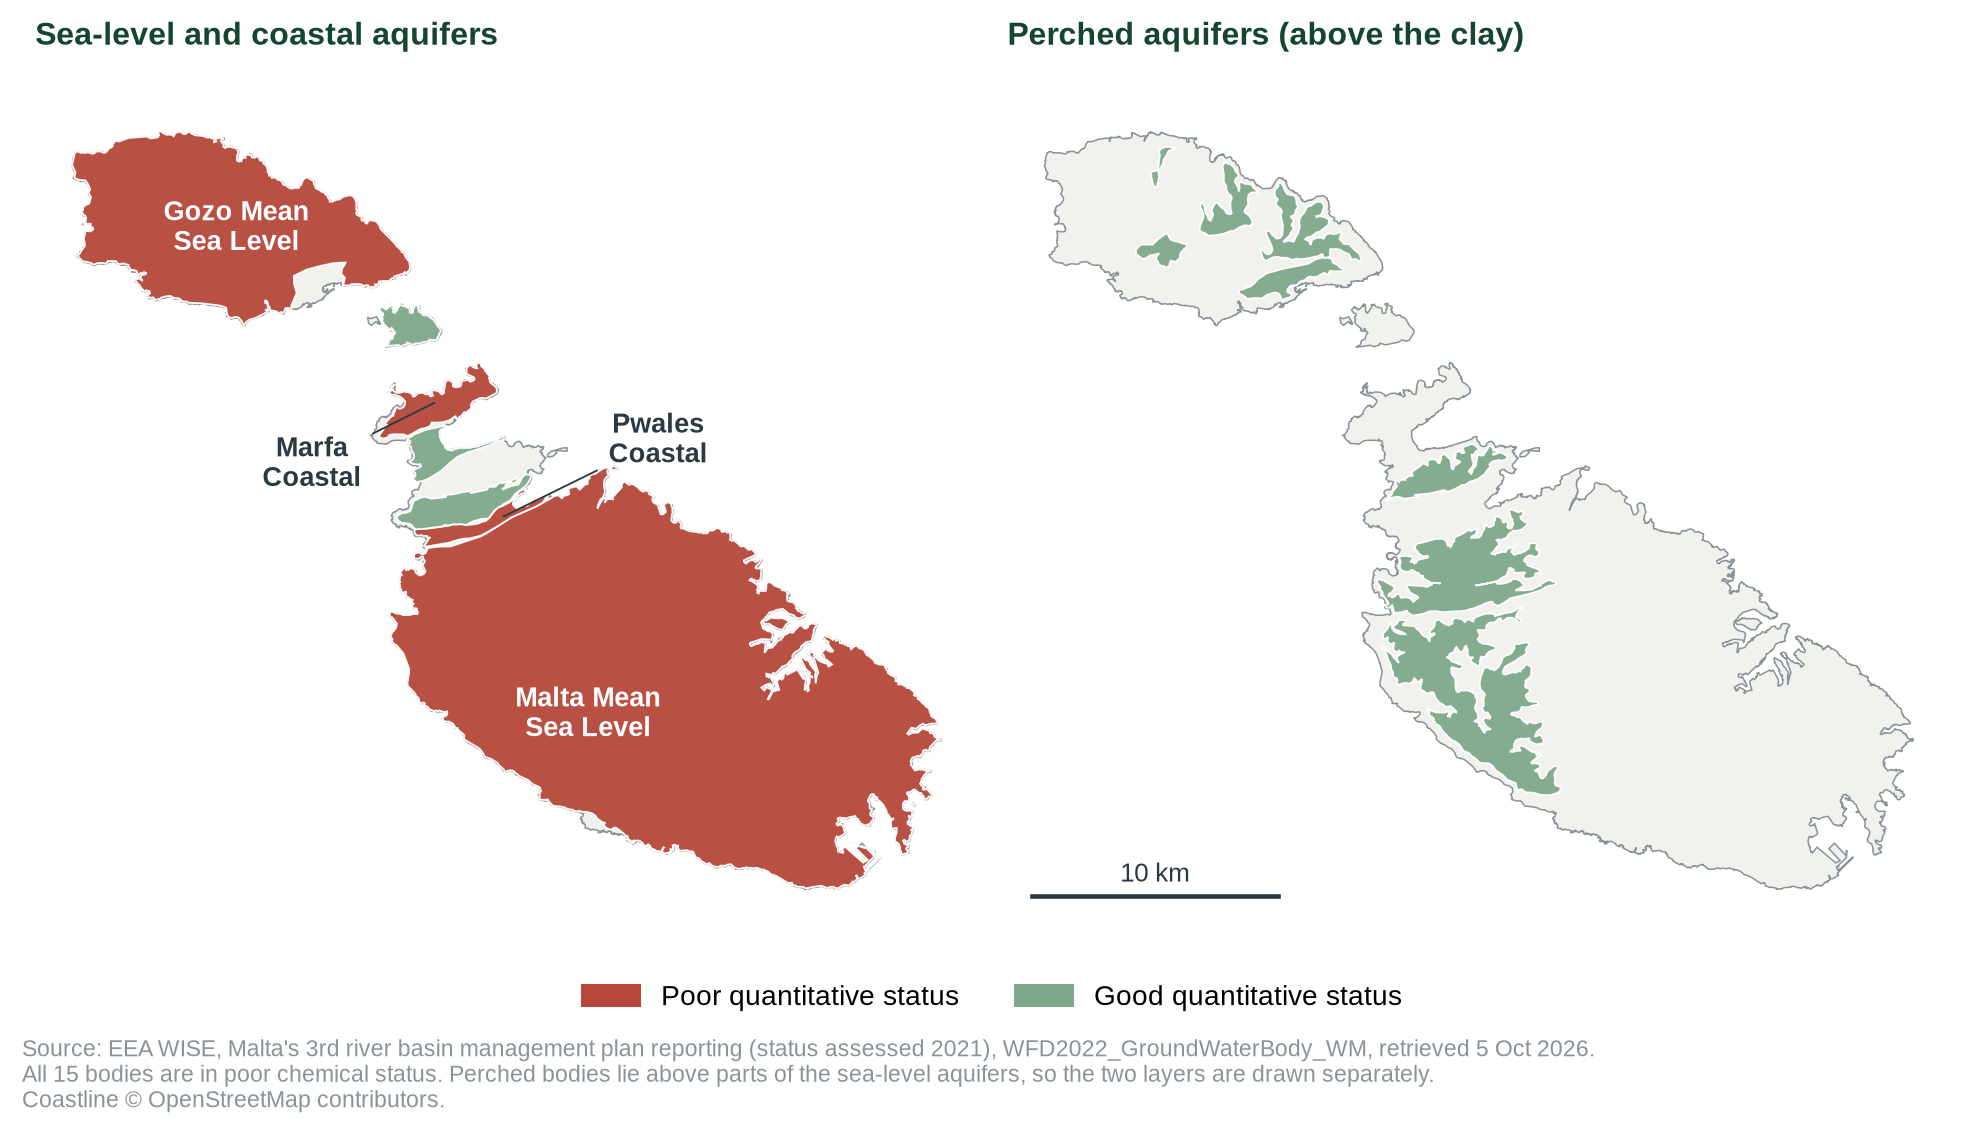
The two sources agree that both main aquifers are poor quantitatively and that none of the 15 bodies reaches good overall status. They differ on two counts: Malta's EU reporting also lists Pwales Coastal and Marfa Coastal as poor quantitatively, and it lists all 15 bodies, not 14, as poor chemically. Its previous cycle (2016 reporting, status assessed 2010–2014) listed 2 and 12. We could not re-open the plan to explain the difference, because ERA's website blocks automated access, so both are shown [2, 7].
The queue note said all groundwater bodies fail on nitrates. The plan does not say that: it names three bodies that do not exceed the 50 mg/L nitrate standard. Chemical status is a broader assessment that includes other factors such as saline intrusion; the plan records 14 bodies failing it, and Malta's EU reporting 15 [2, 7].
The RBMP assessment and WSC's 2025 production figures cover different measures and periods. A lower utility abstraction can help relieve pressure, but proving a change in aquifer status requires comparable monitoring of recharge, water levels, salinity and chemical quality. The plan itself notes that future quantitative assessments were expected to benefit from improved direct monitoring networks [2].
5 What the research says
Peer-reviewed research on Malta's aquifers is limited. We checked three studies on Crossref and read the two that are legally accessible; the third [11] is closed access and is not used.
Groundwater moves slowly. A British Geological Survey and Malta Resources Authority study dated groundwater with chemical and isotope tracers. Water in the saturated zone of the Malta Mean Sea Level aquifer had travel times of 15–40 years, and on Gozo from 25 to possibly more than 60 years. Nitrate held in the rock matrix moves slowly downwards, “providing a long-term source and sustained concentrations of nitrate”, so the time it takes measures to work depends on these residence times. The study also describes the water table of the sea-level aquifer as controlled by abstraction, only up to about 3 m above sea level in places, with abstraction drawing up saline water [10]. Grade B (observational).
The water balance is tight. An overview by an Energy and Water Agency author describes the sea-level aquifers as freshwater lenses floating on seawater, “highly vulnerable to sea-water intrusion in response to abstraction activities”. It gives the water balance used in Section 3 and reports that groundwater abstracted for municipal supply fell from about 21 million m³ in the early 1990s to about 13 million m³ in 2019, which it links to leakage control [9]. It is a policy overview published in a workshop issue, not an independent evaluation. Grade C.
Does the falling WSC groundwater share show that aquifers are recovering?
SUPPLY MIX IS NOT AQUIFER STATUSEVIDENCE FOR THE CLAIM'S IMPRESSION
WSC's RO share increased and its groundwater production fell, to its lowest in a decade on WSC's account [1]. Municipal-supply abstraction has fallen by about 8 million m³ since the early 1990s [9]. Less abstraction is a precondition for recovery.
EVIDENCE AGAINST
The 2025 cut is about 4% of national abstraction, which is near or above the estimated available resource [8, 9]. Agricultural abstraction rose in 2024. All 15 bodies were last assessed as poor, and water-quality changes take years to decades to show [2, 7, 10].
6 The Għar Lapsi tender
On 25 August 2026, WSC said it had issued a €35 million tender for Plant B at the existing Għar Lapsi RO facility. The planned plant comprises six systems with a combined production capacity of 30,000 m³/day. The EU procurement notice records procedure WSC/T/064/2026, published on 28 August, with a 30 October 2026 submission deadline [4–5].
WSC describes the procurement as part of a wider capacity programme. This check records the plant's proposed design capacity, not a forecast of how much water it will supply or how it will change total groundwater use.
7 Verdict and limits
RO's share rose and WSC groundwater production fell; aquifer recovery is not established.
WSC's 2025 figures support a higher RO share and lower groundwater production in its potable supply system. The 2025 groundwater total was the lowest in a decade according to WSC. The new Għar Lapsi Plant B was tendered, with a stated capacity of 30,000 m³/day. Confidence is moderate because the one-year percentage differs slightly between the report's prose and chart, the decade comparison rests on WSC's own series, and the RBMP assessment is not contemporaneous with the 2025 production data.
This verdict does not say that RO production has restored groundwater bodies. WSC's 2025 cut is about 4% of national abstraction, which a published water balance puts near or above the available resource; the latest status assessments report both main aquifers poor quantitatively (four bodies in Malta's EU reporting) and none of the 15 bodies in good status; and the research shows that changes in the sea-level aquifers take years to decades to appear. The national data and the research do not change the verdict on WSC's own figures; they strengthen the caution against reading them as recovery.
Evidence needed for an aquifer-recovery claim
- Publish annual abstraction and recharge by groundwater body and by user sector, metered where possible, with methods and uncertainty.
- Provide comparable water-level, salinity and nitrate series before and after changes in the public supply mix.
- Publish a reconciled 2024–2025 groundwater production figure, explain the 11.4% versus 11.86% difference, and publish the ten-year series behind “lowest in a decade”.
- After Plant B is commissioned, report its actual output, energy use and any corresponding changes in WSC groundwater production.
Limitations
- The RBMP is the latest completed national assessment located, but it is older than the 2025 production data, and its Chapter 6 tables could not be re-opened (ERA blocks automated access).
- National abstraction and recharge are Eurostat estimates; agricultural abstraction in particular is estimated, not fully metered. No 2025 national figures are yet published.
- The available-resource figure (37 million m³) is a long-term estimate from a different method and period than Eurostat's recharge series; it is shown as a reference, not a threshold.
- Stuart et al. was read as the authors' accepted manuscript, not the publisher's version. A third study [11] could not be read.
- This report does not attribute any change in aquifer status to the proposed plant.
8 Sources
- [1] Water Services Corporation, Annual Report 2025, pp. 40–43 (RO share and groundwater production). https://parlament.mt/media/139352/wsc-annual-report-2025.pdf
- [2] ERA and Energy & Water Agency, 3rd River Basin Management Plan for Malta, Chapter 6: Assessment of Status. https://era.org.mt/wp-content/uploads/2023/09/3rd-River-Basin-Management-Plan-MALTA-Chapter-6-Assessment-of-Status-Final.pdf
- [3] Water Services Corporation, Annual Report 2024, p. 42 (groundwater production and source redistribution). https://www.parlament.mt/media/134182/wsc-annual-report-2024.pdf
- [4] Water Services Corporation, WSC issues €35 million tender for new Għar Lapsi reverse osmosis plant, 25 August 2026. https://www.wsc.com.mt/wsc-issues-e35-million-tender-for-new-ghar-lapsi-reverse-osmosis-plant/
- [5] Publications Office of the European Union, WSC/T/064/2026 procurement notice, 28 August 2026. https://op.europa.eu/en/web/public-procurement/procurement-details/-/procurement/c70c57b4-61a5-4c26-a365-dc44067d6687
- [6] Water Services Corporation, Annual Report 2022 (2022 production figures; original 64% RO figure). https://www.wsc.com.mt/wp-content/uploads/2023/06/WSC-Annual-Report-2022.pdf
- [7] European Environment Agency, WISE Water Framework Directive reporting, groundwater bodies, 3rd RBMP (WFD2022_GroundWaterBody_WM, layer 0, Malta), with the 2nd-cycle layer (WFD2016) for comparison. Retrieved 5 October 2026; extracts in data/cc-009/wise_gwb_status.csv and wise_gwb_2022.geojson. https://water.discomap.eea.europa.eu/arcgis/rest/services/WISE_WFD/WFD2022_GroundWaterBody_WM/MapServer/0
- [8] Eurostat, Annual freshwater abstraction by source and sector (env_wat_abs, updated 16 September 2026) and Renewable freshwater resources (env_wat_res, updated 3 July 2026), Malta. Retrieved 5 October 2026; extract with flags in data/cc-009/eurostat_water.csv. https://ec.europa.eu/eurostat/databrowser/view/env_wat_abs/default/table
- [9] Sapiano M. (2020). Integrated Water Resources Management in the Maltese Islands. Acque Sotterranee – Italian Journal of Groundwater 9(3):25–32. doi:10.7343/as-2020-477. (Read in full; open access.) https://doi.org/10.7343/as-2020-477
- [10] Stuart M.E., Maurice L., Heaton T.H.E., Sapiano M., Micallef Sultana M., Gooddy D.C., Chilton P.J. (2010). Groundwater residence time and movement in the Maltese islands – a geochemical approach. Applied Geochemistry 25(5):609–620. doi:10.1016/j.apgeochem.2009.12.010. (Read in full as the authors' accepted manuscript: nora.nerc.ac.uk/id/eprint/9619.) https://doi.org/10.1016/j.apgeochem.2009.12.010
- [11] Mangion J., Sapiano M. (2008). The Mean Sea Level Aquifer, Malta and Gozo. In Natural Groundwater Quality, pp. 404–420. Blackwell. doi:10.1002/9781444300345.ch19. (Not read; closed access; not used for any finding.) https://doi.org/10.1002/9781444300345.ch19
- [12] Miżien. Scripts and outputs: tools/cc-009-report/fetch_data.py, figures.py; data/cc-009/calc.py, checks.csv.
Version 1.2 · 5 October 2026 · No right of reply needed · Calculations: data/cc-009/checks.csv
Appendix B: revision log
| Version | Date | Change |
|---|---|---|
| 1.0 | 3 Oct 2026 | First issue. |
| 1.1 | 5 Oct 2026 | Corrections: (1) Groundwater-body status: the table gave the plan's counts alone (quantitative ‘2 poor’, chemical ‘14 poor’). It now shows the plan alongside Malta's 3rd-cycle EU reporting to the EEA (4 poor quantitatively, 15 poor chemically) and states the difference; TL;DR, verdict text and flyer card updated to match. (2) Cover verdict line ‘aquifer status remains a separate question’ and flyer ‘aquifer status remains poor’ → both ‘aquifers last assessed as poor’. (3) ‘Lowest in a decade’ in the TL;DR and section 2 is now attributed to WSC. (4) Reference [6] is now cited in section 2; reference [7] added for the EU reporting. Verdict and confidence unchanged. |
| 1.2 | 5 Oct 2026 | Upgrade: national abstraction by user and estimated recharge (Eurostat [8]): WSC's 2025 cut is about 4% of national abstraction; new section 3. Peer-reviewed literature verified on Crossref and read [9, 10]; new section 5. Figures 1–3 added (WSC production by source; abstraction and recharge; groundwater-body map). Right-of-reply status corrected to pending (maintainer, 5 Oct 2026). Retitled “More RO, less WSC groundwater” (was “Does more RO mean recovery?”), because no speaker claims aquifer recovery and the verdict rates WSC’s own figures (maintainer, 5 Oct 2026). Verdict and confidence unchanged. |
| 1.2 | 5 Oct 2026 | Maintainer decision (5 Oct 2026): a right of reply is sought only where a check finds a claim Not substantiated, Misleading or Contradicted, so this check needs none; cover, page footer and flyer now say “no right of reply needed”. |
Sources and archived copies
-
Water Services Corporation Annual Report 2025, Water Services Corporation, 2026.
Original · not yet archived
Primary source for 2025 RO share and WSC groundwater-production series. -
WSC issues €35 million tender for new Għar Lapsi reverse osmosis plant, Water Services Corporation, 2026-08-25.
Original · Archived copy
Primary source for the tender, estimated capacity and contract timetable. -
WSC/T/064/2026 – New Plant B at Għar Lapsi RO Plant, Publications Office of the European Union, 2026-08-28.
Original · Archived copy
Official procurement notice; tender deadline 30 October 2026. -
3rd River Basin Management Plan for Malta, Chapter 6: Assessment of Status, Environment and Resources Authority and Energy and Water Agency, 2024.
Original · not yet archived
Primary assessment, as recorded in literature/CC-009: names the Malta and Gozo Mean Sea Level aquifer systems as poor quantitatively; 14 bodies poor chemically; the nitrate standard is exceeded by all except three named bodies. Not re-opened on 5 October 2026 (ERA blocks automated access). -
WISE WFD reporting: groundwater bodies, 3rd RBMP (WFD2022_GroundWaterBody_WM, layer 0), European Environment Agency, 2026-10-05.
Original · Archived copy
Malta's 3rd-cycle EU reporting (status assessed 2021), retrieved 5 October 2026. Lists 4 bodies poor quantitatively (Malta and Gozo Mean Sea Level, Pwales Coastal, Marfa Coastal) and all 15 poor chemically. The 2nd-cycle layer (WFD2016) had 2 and 12. Extract in data/cc-009/wise_gwb_status.csv. -
Annual freshwater abstraction by source and sector (env_wat_abs); Renewable freshwater resources (env_wat_res), Eurostat, retrieved 5 Oct 2026.
Original · Archived copy
Malta, values flagged as estimates (env_wat_abs updated 16 Sep 2026; env_wat_res 3 Jul 2026). 2024 fresh groundwater abstraction 38.46 million m³ (agriculture 21.77, public water supply 14.28); recharge 41.52. Extract in data/cc-009/eurostat_water.csv. -
Groundwater residence time and movement in the Maltese islands - A geochemical approach, Applied Geochemistry 25(5):609-620 (Stuart et al.), 2010.
Original · fetched and fingerprinted 2026-10-10; no public snapshot yet
Peer-reviewed; read in full as the authors' accepted manuscript (nora.nerc.ac.uk/id/eprint/9619). Travel times 15-40 years (Malta MSL), 25 to over 60 years (Gozo MSL); nitrate a long-term source. -
Integrated Water Resources Management in the Maltese Islands, Acque Sotterranee - Italian Journal of Groundwater 9(3):25-32 (Sapiano), 2020.
Original · fetched and fingerprinted 2026-10-10; no public snapshot yet
Open access; read in full. Water balance (Table 1) puts available groundwater at about 37 million m³ a year (long-term) against abstraction of 38-41. Energy and Water Agency author; workshop paper. - Nearly two-thirds of your tap water comes from the sea, MaltaToday, 2022 data. Original · Archived copy
- Malta water table 'fails' test due to high nitrates, MaltaToday, n/d. Original · Archived copy
- 35 million tender launched: new Għar Lapsi reverse osmosis plant, Chambers (WH Partners), Aug 2026. Original · not yet archived
Right of reply
Not needed: this check finds the claim supported. A right of reply is sought when a check finds a claim Not substantiated, Misleading or Contradicted.
Connections
How this claim relates to the others: who made it, the themes it shares with other claims, and the patterns it shows. A connection is a reason to read two checks side by side. It does not make either one right or wrong. How connections are found.
Who made it
Other claims by Water Services Corporation 3
Linked directly 6
Claims that share a theme with this one. A theme is a cause, a mechanism, a target or a way of presenting figures that the editors have found in several claims; its strength says how close the link is.
Water chain: farm waste, sewage, sea, aquifer Shared cause · Strong
The Commission blames farm waste in the sewers for poor treatment; agricultural nitrates are behind groundwater failure. Treated water also feeds 'new water' irrigation.
- CC-005 “92% excellent” bathing water (Supported)
- CC-047 Nitrates in the aquifer (Largely supported)
- CC-039 Net Zero Impact Utility (pledge: Not measurable)
- CC-101 EU: no registration or prior authorisation of water abstraction in Malta (Largely supported)
- CC-108 Net-zero impact on the groundwater environment (pledge: Not measurable)
- CC-118 Council: Malta second-highest water stress, groundwater failing (Largely supported)
Same pattern
Pattern tags name a recurring way a claim can mislead. They describe the statement, not the speaker.
Selective metric
A favourable metric is cited while the regulator-relevant metric looks worse.
- CC-002 Comino tree compensation (Largely supported)
- CC-003 Per-capita emissions vs 2030 projection (Misleading)
- CC-004 'Strong progress' in waste separation (Not substantiated)
- CC-025 Per-capita emissions down 44% since 2005 (Largely supported)
- CC-026 EU's largest rise in emissions (Largely supported)
- CC-079 Waste-to-energy: 4.5% of energy (Misleading)
- CC-114 PN: only EU state with rising emissions intensity (Misleading)
Two steps away 6
Not linked to this claim directly, but linked to a claim that is. These are found by following the links, not chosen by the editors, so they are looser: they show where one theme meets another.
- CC-041 Sewage plants compliant by 2026 (not yet checked)through Water chain: farm waste, sewage, sea, aquiferCC-005Water chain: farm waste, sewage, sea, aquifer or Water chain: farm waste, sewage, sea, aquiferCC-118Water chain: farm waste, sewage, sea, aquifer
- CC-042 'From Blue Flag to Red Alert' (Largely supported)through Water chain: farm waste, sewage, sea, aquiferCC-005Water chain: farm waste, sewage, sea, aquifer
- CC-043 13 Blue Flag beaches (not yet checked)through Water chain: farm waste, sewage, sea, aquiferCC-005Water chain: farm waste, sewage, sea, aquifer
- CC-117 EU: Malta missed recycling targets (reasoned opinion) (not yet checked)through Water chain: farm waste, sewage, sea, aquiferCC-101EU findings of unmet obligations
- CC-128 EU: Malta missed the water-plan timetable (not yet checked)through Water chain: farm waste, sewage, sea, aquiferCC-101EU findings of unmet obligations
- CC-129 EU: Malta has not updated its air pollution programme (not yet checked)through Water chain: farm waste, sewage, sea, aquiferCC-101EU findings of unmet obligations
Three steps away 3
One step further again. At this distance a connection says more about how the themes fit together than about this claim.
- CC-004 'Strong progress' in waste separation (Not substantiated)through Water chain: farm waste, sewage, sea, aquiferCC-101EU findings of unmet obligationsCC-117Waste and construction
- CC-081 Landfill share rising (not yet checked)through Water chain: farm waste, sewage, sea, aquiferCC-101EU findings of unmet obligationsCC-117Waste and construction
- CC-111 EU: 621 kg of waste a head, 74% landfilled (Supported)through Water chain: farm waste, sewage, sea, aquiferCC-101EU findings of unmet obligationsCC-117Waste and construction
Similar wording
Claims whose own words overlap with this one, with the words they share. Found by comparing the wording of the claims, not their verdicts; a lead to read them together, not a finding.
- CC-046 Gozo water autonomy (not yet checked)shares: osmosis, wsc, reverse
Timeline
What was said, what was published before and after it, and each step of this check, in date order. Statements and sources carry the date they were published. The steps of the check carry the date the research was done, from the check's research log. Other statements by the same body on the same topic show whether a position was repeated, changed or corrected.
2008
- 2008 Evidence published The Mean Sea Level Aquifer, Malta and Gozo (Mangion and Sapiano), in Natural Groundwater Quality pp. 404–420, Blackwell/Wiley
2010
- 2010 Evidence published Groundwater residence time and movement in the Maltese islands – A geochemical approach (Stuart et al.), Applied Geochemistry 25(5):609–620
2019
- 2 April 2019 Earlier statement by Water Services Corporation on Water CC-039 Net Zero Impact Utility (pledge: Not measurable)
2020
- 2020 Evidence published Integrated Water Resources Management in the Maltese Islands (Sapiano), Acque Sotterranee – Italian Journal of Groundwater 9(3):25–32
2023
- 2023 Evidence published WSC Annual Report 2022, Water Services Corporation
2024
- 2024 Earlier statement by Water Services Corporation on Water CC-041 Sewage plants compliant by 2026 (not yet checked)
- 2024 Evidence published 3rd River Basin Management Plan for Malta, Chapter 6: Assessment of Status, ERA and Energy & Water Agency
2025
- 2025 Evidence published WSC Annual Report 2024, Water Services Corporation
2026
- 2026 Evidence published Water Services Corporation Annual Report 2025, Water Services Corporation
- August 2026 Evidence published 35 million tender launched: new Għar Lapsi reverse osmosis plant, Chambers (WH Partners)
- 25 August 2026 The statement Water Services Corporation (this claim)
- 25 August 2026 Evidence published WSC issues €35 million tender for new Għar Lapsi reverse osmosis plant, Water Services Corporation
- 28 August 2026 Evidence published WSC/T/064/2026 – New Plant B at Għar Lapsi RO Plant, Publications Office of the European Union
- 3 October 2026 Version 1.0: first issue First issue.
- 5 October 2026 Version 1.2 Upgrade: national abstraction by user and estimated recharge (Eurostat [8]): WSC's 2025 cut is about 4% of national abstraction; new section 3. Peer-reviewed literature verified on Crossref and read [9, 10]; new section 5. Figures 1–3 added (WSC production by source; abstraction and recharge; groundwater-body map). Right-of-reply status corrected to pending (maintainer, 5 Oct 2026). Retitled “More RO, less WSC groundwater” (was “Does more RO mean recovery?”), because no speaker claims aquifer recovery and the verdict rates WSC’s own figures (maintainer, 5 Oct 2026). Verdict and confidence unchanged. Maintainer decision (5 Oct 2026): a right of reply is sought only where a check finds a claim Not substantiated, Misleading or Contradicted, so this check needs none; cover, page footer and flyer now say “no right of reply needed”. Verdict in this version: Largely supported, moderate confidence.
- 5 October 2026 Evidence reviewed
- 5 October 2026 Version 1.1: corrections Corrections: (1) Groundwater-body status: the table gave the plan's counts alone (quantitative ‘2 poor’, chemical ‘14 poor’). It now shows the plan alongside Malta's 3rd-cycle EU reporting to the EEA (4 poor quantitatively, 15 poor chemically) and states the difference; TL;DR, verdict text and flyer card updated to match. (2) Cover verdict line ‘aquifer status remains a separate question’ and flyer ‘aquifer status remains poor’ → both ‘aquifers last assessed as poor’. (3) ‘Lowest in a decade’ in the TL;DR and section 2 is now attributed to WSC. (4) Reference [6] is now cited in section 2; reference [7] added for the EU reporting. Verdict and confidence unchanged. all corrections
2027
- 5 October 2027 Coming up: Evidence review due Each finished check is reviewed against new evidence within a year.
Every change to this claim's record is public: history of the record.
Download the report and flyer