CC-013 · Planning & Housing · Housing & affordability
Permits keep property prices in check
Largely supported Moderate confidence Draft: no right of reply needed
Parts of this claim
The claim is split into parts that are tested separately, as in the report below. Each part has its own number.
- CC-013A Price is a supply-and-demand issue; more permits help keep prices in checkSupported in direction by peer-reviewed studies [5–7]; effect size uncertain and possibly small for affordability [8].
- CC-013B Stopping permits would drive prices upConsistent with the same research; not tested for Malta directly.
- CC-013C Without the permits Malta would face the same crises as other European countriesCounterfactual. Malta is below the EU on overcrowding and overburden today, and its real price rise ranks 16th of 27 despite the fastest population growth; but its prices outpaced the EU aggregate, rents rose 53% (EU 21%) and overburden is rising.
- CC-013D 91,000 dwellings in a decade (interviewer)87,814 approved 2015–2024 [2].
Claim Check 013 · Housing and planning
Do permits keep prices in check?
Testing a public claim about housing supply and prices in Malta against research, Eurostat and the census
“Continuing to issue permits helps keep property prices in check.”
Johann Buttigieg, Planning Authority CEO, MaltaToday interview, 2 March 2025.
Answering a question on 91,000 dwellings approved in a decade.
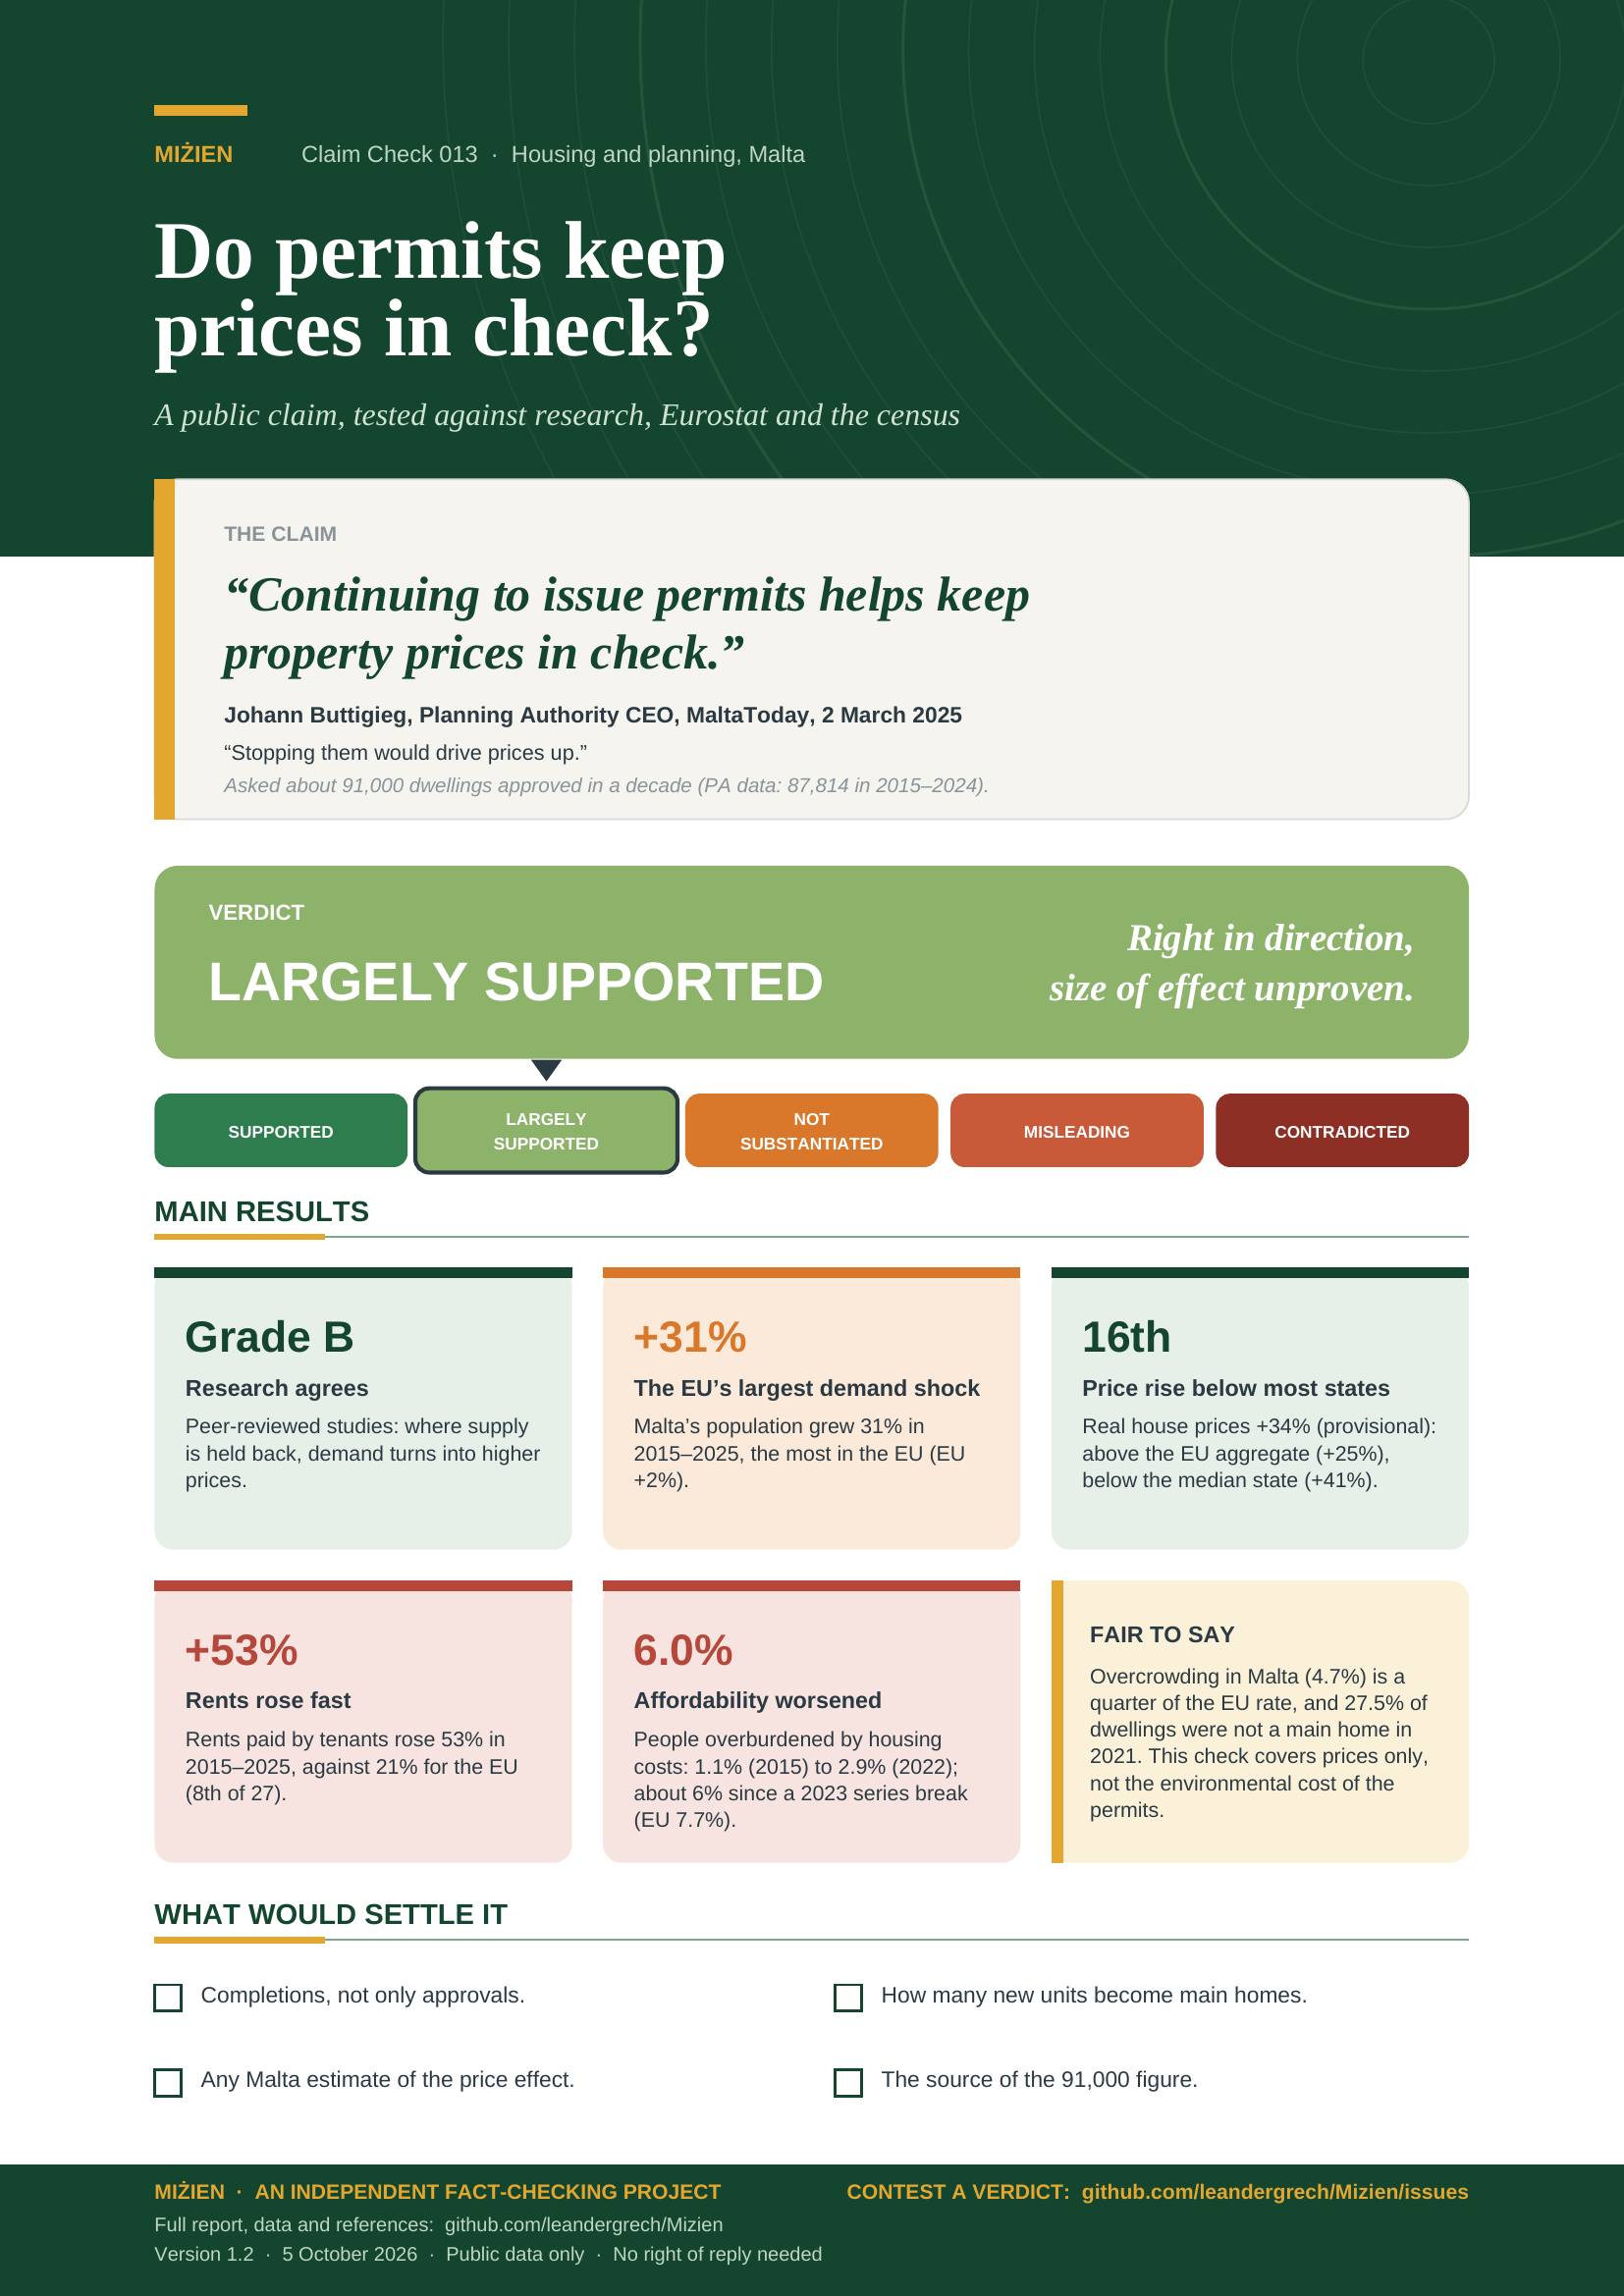
Verdict: Largely supported Right in direction; the size of the effect is unproven
Version 1.2 · 5 October 2026
TL;DR
In a March 2025 interview with MaltaToday, Planning Authority chief executive Johann Buttigieg was asked whether approving 91,000 dwellings in a decade was sustainable. He replied: “Had we not issued these permits, Malta would face the same housing crises as other European countries. This is a supply-and-demand issue – continuing to issue permits helps keep property prices in check. Stopping them would drive prices up.” We tested the economics against peer-reviewed research and the Malta data against Eurostat for all 27 Member States. Malta had the EU’s fastest population growth in 2015–2025, yet its real house-price rise ranked only 16th of 27; rents rose two and a half times as fast as the EU’s.
- The mechanism is well supported. Peer-reviewed studies in the US and England find that where supply is held back, demand growth shows up as higher prices rather than more homes.
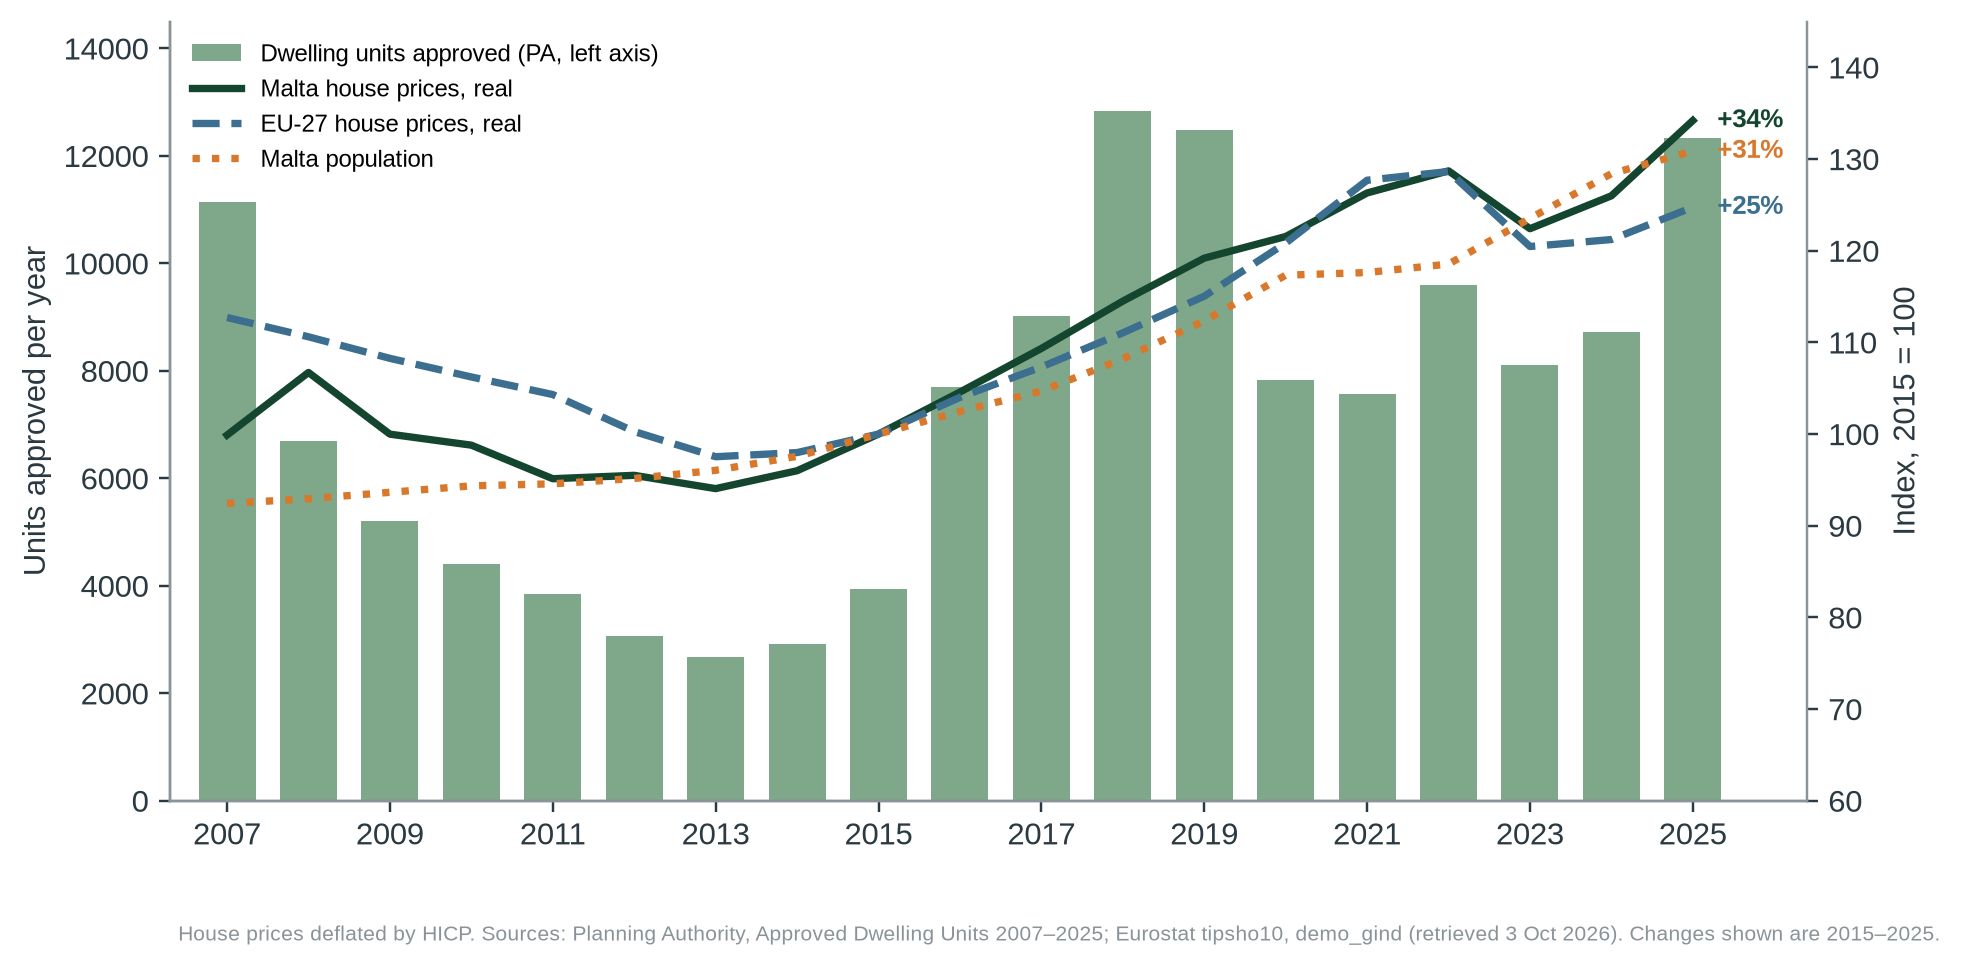
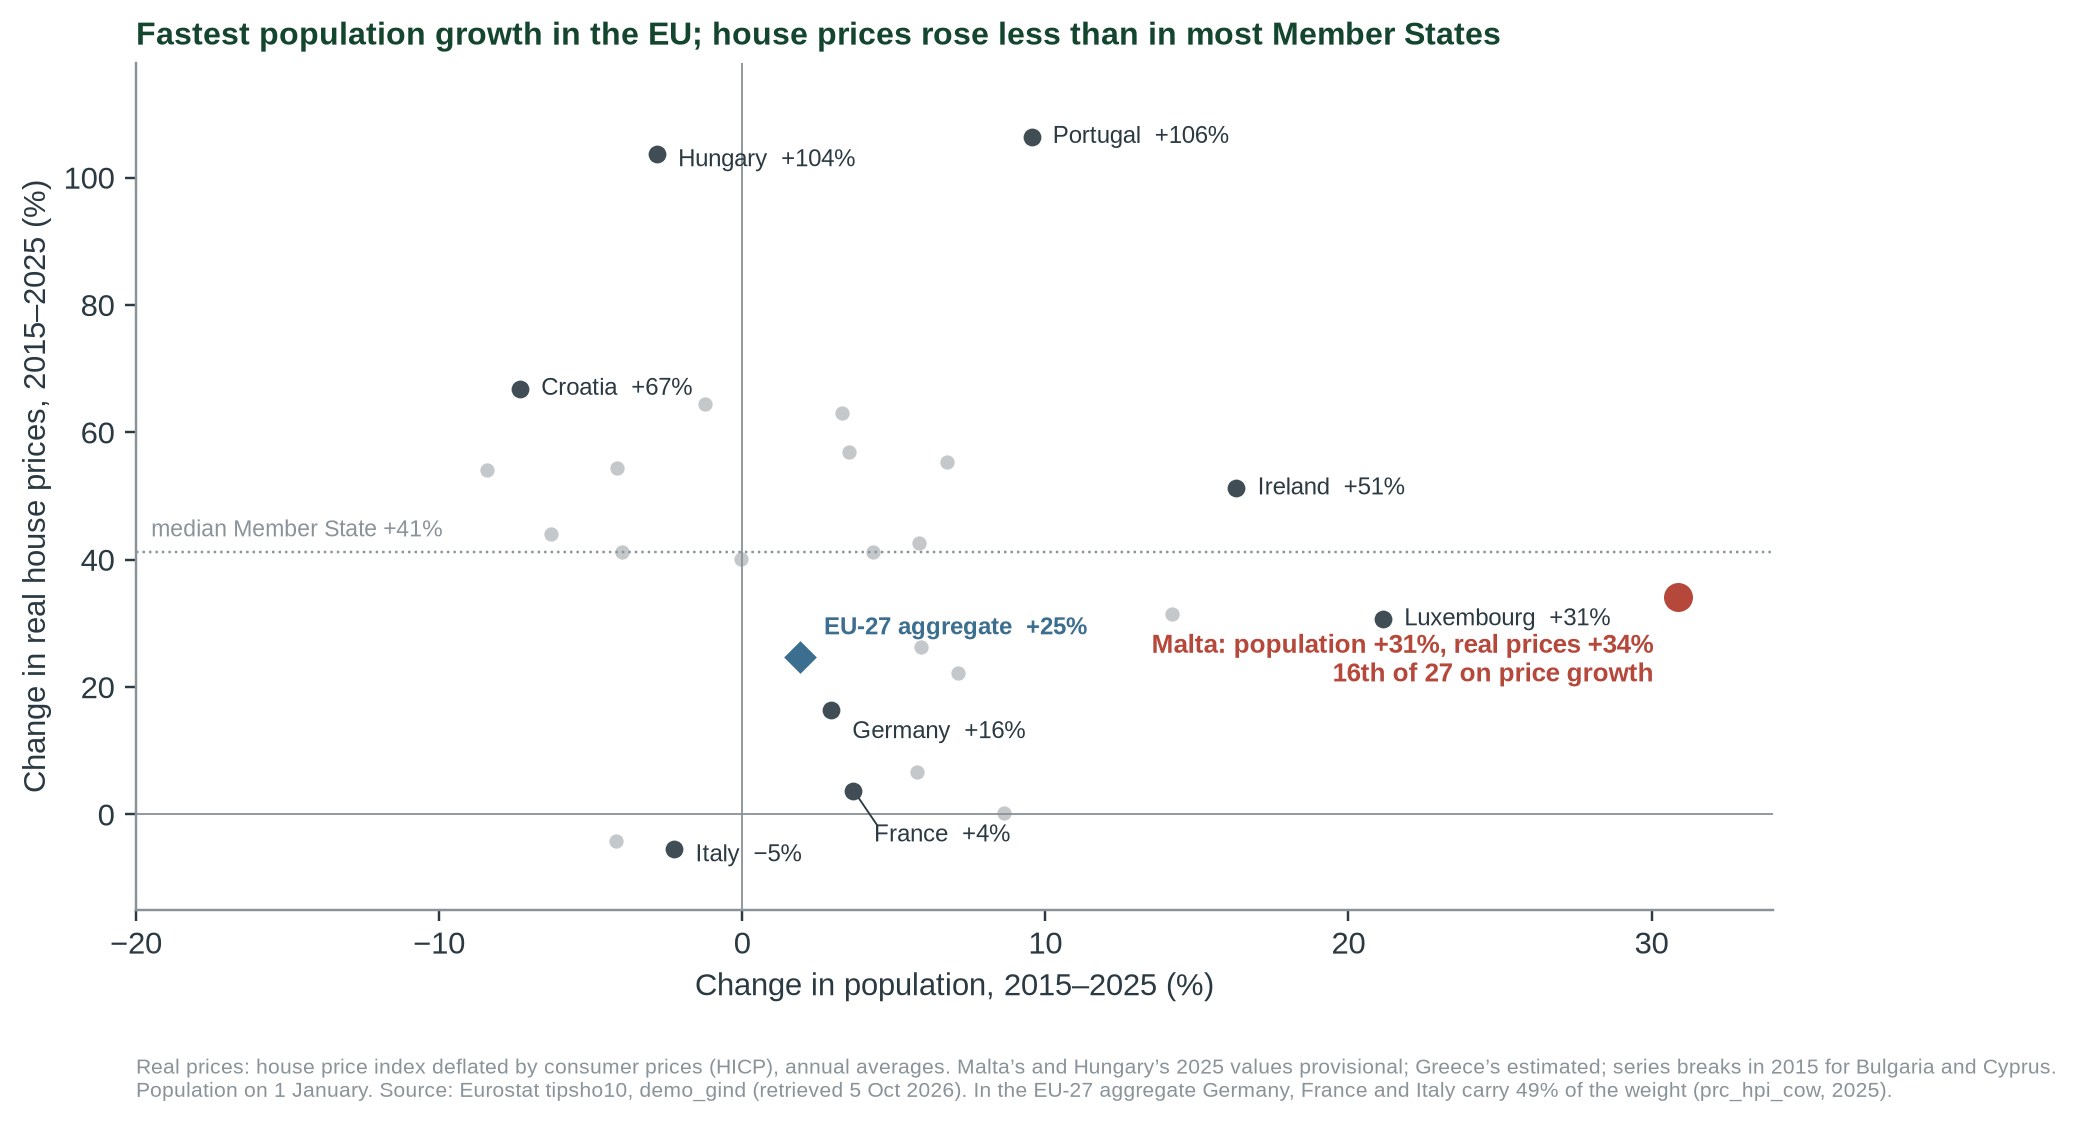
- Malta absorbed the EU’s largest demand shock. Population grew 31% in 2015–2025, the most in the EU and about 16 times the EU’s 2%. Real house prices rose 34% (provisional): more than the EU aggregate (25%), but less than in 15 of the other 26 states (median 41%; Figure 3).
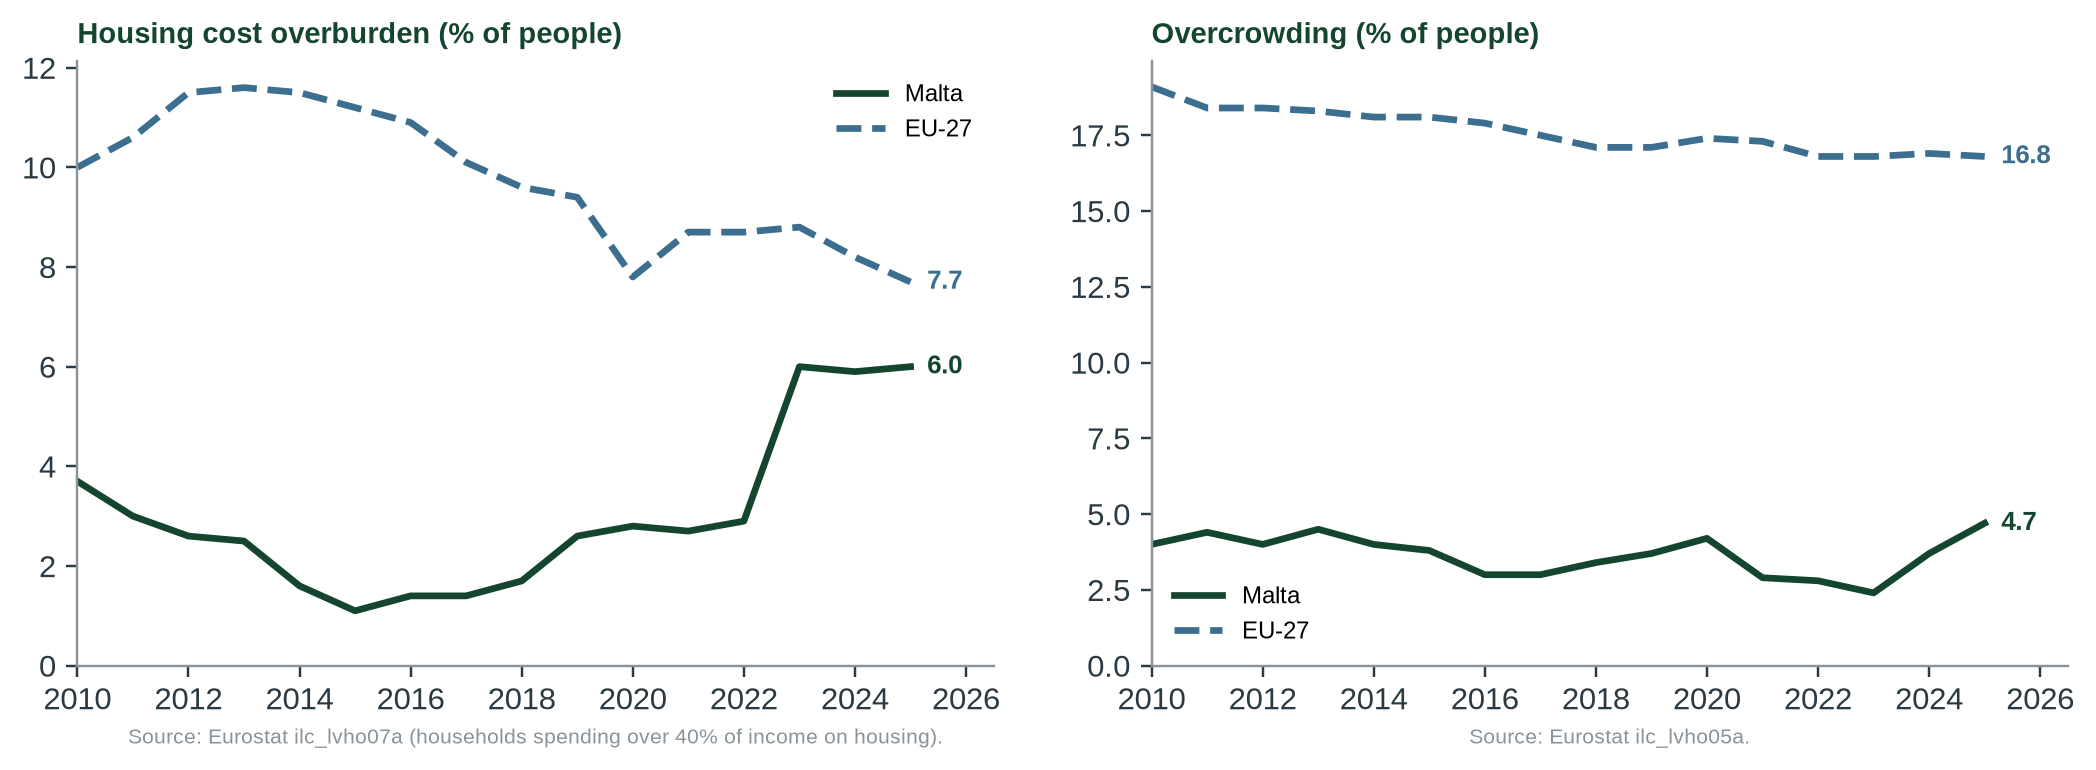
- But not everything was held in check. Rents rose 53%, against 21% in the EU (8th fastest of 27). Housing-cost overburden rose from 1.1% to 2.9% in 2015–2022 while the EU’s fell, and has held at about 6% since a 2023 series break.
- The counterfactual cannot be proved. No study estimates Maltese prices with fewer permits, and over a quarter of dwellings are not anyone’s main home.
- Verdict: largely supported (moderate confidence). As a statement about supply and demand, the claim agrees with the evidence. The caveats concern how large the effect is and the worsening affordability trend, which the statement does not mention.
- Supported
- Largely supported
- Not substantiated
- Misleading
- Contradicted
What would move the verdict up
A Malta-specific estimate showing that prices respond strongly to approvals (for example, prices slowing where and when approvals rise, controlling for demand).
What would move it down
Evidence that most new approvals add to secondary or vacant stock rather than housing for residents, or that prices rose as fast in places that approved more.
IN THIS REPORT
1 The claim and what we could verify
The claim is the chief executive’s answer in a MaltaToday interview by James Debono published on 2 March 2025 [1], which we read in full. The interviewer’s question gave the figure of 91,000 new dwellings approved in the past decade, including 21,000 on previously undeveloped land; the answer did not repeat it. The Authority’s own series gives 87,814 units approved in 2015–2024 [2], close to the interviewer’s figure.
| What was said | Who | Access |
|---|---|---|
| “Had we not issued these permits, Malta would face the same housing crises as other European countries.” | Chief executive [1] | Read in full |
| “This is a supply-and-demand issue – continuing to issue permits helps keep property prices in check. Stopping them would drive prices up.” | Chief executive [1] | Read in full |
| 91,000 new dwellings approved in the past decade | Interviewer [1] | Read; PA series gives 87,814 [2] |
2 Method
Question. Does issuing permits help keep prices in check, and is Malta better placed than other European countries because of it?
Evidence. Peer-reviewed literature on housing supply and prices, found through Crossref and OpenAlex and verified by DOI [5–8]. Eurostat house prices (nominal and deflated), permits, population, housing-cost overburden and overcrowding for Malta and the EU, and population, real house prices, rents and the latest quarterly prices for all 27 Member States, with status flags [3]; the Planning Authority’s series of approved dwellings [2]; and the NSO 2021 census of dwellings [4]. All numbers are recomputed by tools/cc-013-report/calc.py from files in data/cc-013/.
Grades. Peer-reviewed observational studies with controls are grade B; official statistics are grade C. Verdicts follow the five-point scale in Appendix A.
3 What the research says
Economists agree that supply matters for prices; they disagree on how much. Glaeser, Gyourko and Saks found Manhattan prices far above construction costs and attributed the gap to land-use regulation; in constrained markets, rising demand led “not to more housing units but to higher prices” [5]. Hilber and Vermeulen, using 353 English planning authorities over 34 years, found that regulatory constraints make prices respond more strongly to rising incomes [6]. Saiz showed that supply elasticity depends on both geography and regulation [7]: both are tight in Malta.
On the other side, Anenberg and Kung modelled what happens when supply is added and found that rents respond only weakly, because location and amenities matter more than the number of units; marginal easing of constraints “alone” is unlikely to cut rent burdens much [8]. The research therefore supports the direction of the claim (more permits, less upward pressure) but not any particular size of effect.
4 What the Malta data show
| Indicator | Malta | EU-27 | Source | Grade |
|---|---|---|---|---|
| Population change 2015–2025 | +31% (1st of 27) | +2% | Eurostat demo_gind | C |
| Real house prices, 2015–2025 | +34% (p); 16th of 27 | +25% (median state +41%) | Eurostat tipsho10 | C |
| Rents (HICP actual rentals), 2015–2025 | +53%; 8th of 27 | +21% | Eurostat prc_hicp_aind | C |
| House prices, annual change to 2026-Q2 (nominal) | +6.9% (p) | +4.7% | Eurostat prc_hpi_q | C |
| Nominal house prices, 2015–2024 | +64% | +53% | Eurostat prc_hpi_a | C |
| Housing-cost overburden, 2015 → 2022; 2023 → 2025 (break in Malta’s series in 2023) | 1.1% → 2.9%; 6.0% → 6.0% | 11.2% → 8.7%; 8.8% → 7.7% | Eurostat ilc_lvho07a | C |
| Overcrowding, 2025 | 4.7% | 16.8% | Eurostat ilc_lvho05a | C |
| Dwellings approved 2015–2024 | 87,814 | – | Planning Authority [2] | C |
| Dwellings not a main residence, 2021 | 27.5% (31.8% in 2011) | – | NSO census [4] | C |
All values in data/cc-013/checks.csv. Real prices are the house price index deflated by consumer prices (HICP), to 2025; nominal prices are not deflated and run to 2024. (p) provisional. Ranks: 1 = largest rise among the 27 Member States.
Malta among the 27
Compared with every Member State rather than with the EU aggregate, the picture changes (Figure 3). Malta’s population grew 31% in 2015–2025, the most in the EU (Luxembourg 21%, Ireland 16%) and about 16 times the EU’s 1.9%. Its real house prices rose 34%, which ranks 16th of 27: below the median Member State (41%) and far below Portugal (106%) and Hungary (104%). The EU aggregate (25%) is low partly because Germany (16%), France (4%) and Italy (−5%) carry 49% of its weight [3].
Rents tell a different story. Rents paid by tenants (the HICP index of actual rentals) rose 53% in Malta over the same decade, against 21% for the EU: the 8th fastest rise of 27 [3]. The latest quarterly figures show house prices still rising faster than the EU’s: 6.9% in the year to the second quarter of 2026, against 4.7% (both provisional for Malta; nominal).
5 Where the evidence points different ways
Q1 Did permits keep prices in check?
IN DIRECTION, NOT IN LEVELEVIDENCE FOR THE CLAIM'S IMPRESSION
Population grew 31%, the most in the EU, while real prices rose 34%: less than in 15 of the other 26 states and below the median state (41%). In our reading, supply on this scale is a plausible reason prices did not rise much faster. This is our inference: it is consistent with the research but has not been tested for Malta.
EVIDENCE AGAINST
Malta’s real prices outpaced the EU aggregate, rents rose 53% against 21%, and prices grew fastest in the record-approval years (about 3.8% a year in years with 9,000+ approvals against 1.7% in other years). Approvals respond to demand, so this does not show permits raised prices, but it does show they did not hold every housing cost down.
Q2 Would Malta face the same crisis as other European countries?
PARTLY SUPPORTED NOW; GAP NARROWINGEVIDENCE FOR THE CLAIM'S IMPRESSION
Malta’s overcrowding (4.7%) is a quarter of the EU rate and its overburden rate (6.0%) is still below the EU’s (7.7%). Its real house-price rise was below that of most Member States despite the EU’s fastest population growth.
EVIDENCE AGAINST
Malta’s overburden rate rose from 1.1% to 2.9% in 2015–2022 while the EU’s fell. The jump to 6.0% in 2023 coincides with a break in Eurostat’s series, so it is not a like-for-like change; the rate has held at about 6% since. Rents rose two and a half times as fast as the EU’s.
Q3 Do approvals add homes for residents?
MOSTLY, NOT ENTIRELYEVIDENCE FOR THE CLAIM'S IMPRESSION
The share of dwellings that are not a main residence fell from 31.8% to 27.5% between 2011 and 2021 [4]: most new stock was occupied.
EVIDENCE AGAINST
81,613 dwellings (27.5%) were secondary, seasonal or vacant in 2021. Approvals are not completions, and small, investor-oriented units may not match households’ needs.
6 Testing the claim
| Sub-claim | What the evidence shows | Rating |
|---|---|---|
| A. Price is a supply-and-demand issue; more permits help keep prices in check | Supported in direction by peer-reviewed studies [5–7]; effect size uncertain and possibly small for affordability [8]. | LARGELY SUPPORTED |
| B. Stopping permits would drive prices up | Consistent with the same research; not tested for Malta directly. | LARGELY SUPPORTED |
| C. Without the permits Malta would face the same crises as other European countries | Counterfactual. Malta is below the EU on overcrowding and overburden today, and its real price rise ranks 16th of 27 despite the fastest population growth; but its prices outpaced the EU aggregate, rents rose 53% (EU 21%) and overburden is rising. | NOT SHOWN |
| D. 91,000 dwellings in a decade (interviewer) | 87,814 approved 2015–2024 [2]. | CLOSE |
7 Verdict and requests for evidence
Agrees with the research on supply and prices; the size of the effect is unproven and affordability is worsening. Confidence: moderate.
Why. (1) The research consistently finds that restricting housing supply raises prices, so issuing permits plausibly restrains them. (2) Malta absorbed the EU’s fastest population growth, about 16 times the EU’s, with real price growth above the EU aggregate but below that of most Member States (16th of 27), and remains below the EU on overcrowding and cost overburden. (3) The statement does not show how much permits restrain prices, and affordability worsened between 2015 and 2022 on Eurostat’s comparable series, and rents rose 53% against 21% for the EU. These caveats limit the claim but do not reverse it, which our scale calls Largely supported.
What this verdict does not say. It does not say that more permits are good overall, that the land, design or environmental costs are justified, or that prices are affordable. It says that, as an economic statement about supply and prices, the claim agrees with the evidence.
Evidence we are asking for
- Completions (not only approvals) by year and type, and how many new units become main residences.
- Any Malta-specific estimate of how prices respond to approvals, controlling for demand.
- The source and definition of the 91,000 figure used in the interview question.
8 Limitations
- The research cited is from the US and England; no peer-reviewed estimate of supply elasticity for Malta was found.
- Approvals are not completions; we did not find a completions series.
- Malta’s overburden rate jumps between 2022 and 2023, the year Eurostat flags a break in its series; we compare only within 2015–2022 and 2023–2025.
- National averages hide differences between localities, tenures and income groups.
- Peer-reviewed papers were read as abstracts; findings used are those stated in the abstracts.
- EU-27 comparisons use annual averages. Malta’s 2025 house price index and the 2026 quarterly figures are provisional; Bulgaria and Cyprus have series breaks in 2015 and Greece’s values are estimated. The rent index covers rents paid by tenants, not the costs of owner-occupiers.
References
- [1] Debono J. (2 Mar 2025). Johann Buttigieg: ‘Issuing permits helps keep property prices in check’. MaltaToday, interview. https://www.maltatoday.com.mt/news/interview/133858/johann_buttigieg_issuing_permits_helps_keep_property_prices_in_check_
- [2] Planning Authority (2026). Approved Dwelling Units for 2007–2025. https://www.pa.org.mt/file.aspx?f=37489
- [3] Eurostat. prc_hpi_a, tipsho10, sts_cobp_a, demo_gind, ilc_lvho07a, ilc_lvho05a; retrieved 3 Oct 2026 (status flags checked 5 Oct 2026). All 27 Member States: demo_gind, tipsho10, prc_hicp_aind (CP041), prc_hpi_q, prc_hpi_cow; retrieved 5 Oct 2026. https://ec.europa.eu/eurostat/databrowser/
- [4] National Statistics Office (2023). Census of Population and Housing 2021, Final Report vol. 2: Dwelling Characteristics. https://nso.gov.mt/wp-content/uploads/Census-2021-Volume-2.pdf
- [5] Glaeser E.L., Gyourko J., Saks R. (2005). Why is Manhattan so expensive? Regulation and the rise in housing prices. Journal of Law and Economics 48(2):331–369. doi:10.1086/429979. (Abstract read.) https://doi.org/10.1086/429979
- [6] Hilber C.A.L., Vermeulen W. (2016). The impact of supply constraints on house prices in England. Economic Journal 126(591):358–405. doi:10.1111/ecoj.12213. (Abstract read.) https://doi.org/10.1111/ecoj.12213
- [7] Saiz A. (2010). The geographic determinants of housing supply. Quarterly Journal of Economics 125(3):1253–1296. doi:10.1162/qjec.2010.125.3.1253. (Abstract read.) https://doi.org/10.1162/qjec.2010.125.3.1253
- [8] Anenberg E., Kung E. (2020). Can more housing supply solve the affordability crisis? Evidence from a neighborhood choice model. Regional Science and Urban Economics 80:103363. doi:10.1016/j.regsciurbeco.2018.04.012. (Abstract read, working-paper version.) https://doi.org/10.1016/j.regsciurbeco.2018.04.012
- [9] MiŻien. Data and calculations: data/cc-013/; tools/cc-013-report/calc.py.
Appendix A: series standards and verdict scale
Every investigation in this series follows the same rules so that verdicts are comparable and challengeable.
| Verdict | Meaning |
|---|---|
| SUPPORTED | Evidence consistently backs the claim as stated. |
| LARGELY SUPPORTED | Backed by the evidence, with minor caveats that do not change the substance. |
| NOT SUBSTANTIATED | Stated more strongly than the evidence offered or available allows. May be true in some conditions but has not been shown. |
| MISLEADING | Omits material facts so that the overall impression is inaccurate, even if individual statements are defensible. |
| CONTRADICTED | The available evidence points against the claim. |
Confidence
High: multiple independent lines of evidence agree. Moderate: evidence is relevant but incomplete or indirect. Low: evidence is thin, second-hand or conflicting.
Evidence grades
A experiment · B observational study with a control or gradient · C review, guidance or official statistics · D assertion or anecdote. ◆ marks a source known only second-hand.
Standards
- Quote the speaker, not the headline, with outlet and date, and link the original where possible.
- Separate the claim from the evidence offered for it, and say who made which statement.
- Grade the evidence and show differing views side by side where the evidence is unsettled.
- State what we could not access or verify, and what would change the verdict either way.
- Ask for the missing evidence in specific, answerable requests.
- Offer a right of reply where a check finds a claim Not substantiated, Misleading or Contradicted (or a pledge Not measurable, Off track or Missed), before wider circulation, and append responses.
- Correct errors openly with a version number and change log.
- Whistle-blow only on evidence: a verdict of Misleading or Contradicted requires documents or data that can be shown, not inference.
- Check every side. Government, opposition, NGOs and developers are held to the same standard.
Appendix B: revision log
| Version | Date | Change |
|---|---|---|
| 1.0 | 3 Oct 2026 | First issue. Right of reply to the Planning Authority not yet sent. |
| 1.1 | 5 Oct 2026 | Corrections. (1) Housing-cost overburden: Eurostat flags a break in Malta’s series in 2023, so “1.1% (2015) → 6.0% (2025)” and “more than fivefold” → like-for-like runs “1.1% → 2.9% (2015–2022)” and “6.0% → 5.9% → 6.0% (2023–2025)” (TL;DR, tiles, Figure 2 caption, Section 4 table, Q2, Section 7, Limitations, flyer). (2) Real house prices 2015–2025 (+34% Malta, +25% EU) now written to checks.csv by calc.py, which previously held only 2015–2024 (+26%, +21%); Malta’s 2025 value marked provisional (TL;DR, tiles, Figure 1 caption, table “+34%” → “+34% (p)”); table note now states each price row’s basis and period (real, HICP-deflated, to 2025; nominal to 2024). (3) data/cc-013/eurostat_housing.csv: the second sts_cobp_a series each year relabelled as m² of useful floor area (it had the dwellings label); Eurostat flags recorded. (4) Q1: “the most plausible reason … the research supports this” → stated as our inference, not tested for Malta. Verdict and confidence unchanged. |
| 1.2 | 5 Oct 2026 | Upgrade: (1) New Figure 3 and subsection comparing all 27 Member States (Eurostat demo_gind, tipsho10): Malta’s population growth 2015–2025 is the highest (+30.9%; Luxembourg +21.1%), its real house-price rise (+34.2%, provisional) ranks 16th of 27, below the median state (+41.2%); Germany, France and Italy carry 49% of the EU-27 index weight. (2) Rents added (HICP actual rentals): +53.1% vs EU +20.5%, 8th of 27. (3) “Population growth fifteen times the EU’s” → “about 16 times” (30.87% / 1.90% = 16.3). (4) Latest quarter added: house prices +6.9% a year to 2026-Q2 (EU +4.7%; provisional). (5) TL;DR, key points, tiles, table, Q1, Q2, sub-claim C text, Why, Limitations and flyer updated. Verdict and confidence unchanged. |
| 1.2 | 5 Oct 2026 | Maintainer decision (5 Oct 2026): a right of reply is sought only where a check finds a claim Not substantiated, Misleading or Contradicted, so this check needs none; cover, page footer and flyer now say “no right of reply needed”. |
Sources and archived copies
-
Johann Buttigieg: 'Issuing permits helps keep property prices in check', MaltaToday, 2 Mar 2025.
Original · not yet archived
The claim. Read in full 3 Oct 2026. The 91,000 figure is in the interviewer's question. -
Approved Dwelling Units for 2007-2025, Planning Authority, 2026.
Original · not yet archived
87,814 units approved 2015-2024. -
Census of Population and Housing 2021: Final Report vol. 2, National Statistics Office, 2023.
Original · not yet archived
27.5% of dwellings secondary, seasonal or vacant.
Right of reply
Not needed: this check finds the claim supported. A right of reply is sought when a check finds a claim Not substantiated, Misleading or Contradicted.
Connections
How this claim relates to the others: who made it, the themes it shares with other claims, and the patterns it shows. A connection is a reason to read two checks side by side. It does not make either one right or wrong. How connections are found.
Who made it
Johann Buttigieg, Planning Authority CEO for Planning Authority
Other claims by Johann Buttigieg 2
- CC-014 Fewer enforcement notices, fewer illegalities (Misleading)
- CC-015 'Three weeks left' at the PA (not yet checked)
Other claims by Planning Authority 1
Linked directly 6
Claims that share a theme with this one. A theme is a cause, a mechanism, a target or a way of presenting figures that the editors have found in several claims; its strength says how close the link is.
Planning, housing and land take Shared driver · Strong
Permit volumes, enforcement and housing demand drive land take. Claims about prices, enforcement, reclamation and land loss rest on the same planning system and the same data (PA permits, NSO prices, land-cover maps).
- CC-014 Fewer enforcement notices, fewer illegalities (Misleading)
- CC-017 Land reclamation outside the Freeport (Not substantiated)
- CC-018 IMF 'confirms' MDA on housing (Largely supported)
- CC-019 830,000 m2 of land lost in five years (Not substantiated)
- CC-060 7,000 first-time buyers helped (not yet checked)
- CC-123 KPMG: 8,716 residential units approved in 2024, up 7.4% (not yet checked)
Two steps away 11
Not linked to this claim directly, but linked to a claim that is. These are found by following the links, not chosen by the editors, so they are looser: they show where one theme meets another.
- CC-001 Upper Barrakka concrete (Not substantiated)through Planning, housing and land takeCC-019Sealed soil and concrete
- CC-002 Comino tree compensation (Largely supported)through Planning, housing and land takeCC-017Waste and construction or Planning, housing and land takeCC-019Sealed soil and concrete
- CC-004 'Strong progress' in waste separation (Not substantiated)through Planning, housing and land takeCC-017Waste and construction
- CC-008 Flyovers and congestion (Not substantiated)through Planning, housing and land takeCC-017Waste and construction or Planning, housing and land takeCC-019Sealed soil and concrete
- CC-012 Ta' Qali gravel and grass (Contradicted)through Planning, housing and land takeCC-019Sealed soil and concrete
- CC-058 96% of farmland in use (not yet checked)through Planning, housing and land takeCC-019Planning, housing and land take
- CC-059 Subsidies are 20% of farm output (not yet checked)through Planning, housing and land takeCC-019Farmland and farming pressure
- CC-062 Construction is 9-14% of the economy (Largely supported)through Planning, housing and land takeCC-018Planning, housing and land take or Planning, housing and land takeCC-123Planning, housing and land take
- CC-063 Construction waste: 'standstill' warning (Not substantiated)through Planning, housing and land takeCC-017Waste and construction
- CC-127 EU: Malta has the lowest organic share in the EU (not yet checked)through Planning, housing and land takeCC-019Farmland and farming pressure
- CC-130 NGOs: ODZ racecourse policy ends protection (not yet checked)through Planning, housing and land takeCC-019Farmland and farming pressure
Three steps away 16
One step further again. At this distance a connection says more about how the themes fit together than about this claim.
- CC-003 Per-capita emissions vs 2030 projection (Misleading)through Planning, housing and land takeCC-017Waste and constructionCC-004Selective-metric pattern
- CC-007 Within EU limits vs WHO guideline (Largely supported)through Planning, housing and land takeCC-017Waste and constructionCC-004Selective-metric pattern
- CC-010 Tree-planting counts (Largely supported)through Planning, housing and land takeCC-017Waste and constructionCC-002Replanting as currency
- CC-016 Shore-to-ship: 90% less harbour pollution (Misleading)through Planning, housing and land takeCC-017Waste and constructionCC-008Transport, air and climate
- CC-021 Malta-Gozo tunnel traffic (not yet checked)through Planning, housing and land takeCC-017Waste and constructionCC-008Transport, air and climate
- CC-056 Central Link: 'only 254 trees' (not yet checked)through Planning, housing and land takeCC-017Waste and constructionCC-008Replanting as currency
- CC-069 82 million bus trips (not yet checked)through Planning, housing and land takeCC-017Waste and constructionCC-008Transport, air and climate
- CC-072 EUR 15m to take cars off the road (not yet checked)through Planning, housing and land takeCC-017Waste and constructionCC-008Transport, air and climate
- CC-076 36 more vehicles a day (Supported)through Planning, housing and land takeCC-017Waste and constructionCC-008Transport, air and climate
- CC-079 Waste-to-energy: 4.5% of energy (Misleading)through Planning, housing and land takeCC-017Waste and constructionCC-004Waste and construction
- CC-081 Landfill share rising (not yet checked)through Planning, housing and land takeCC-017Waste and constructionCC-004Waste and construction
- CC-082 35 quarries for construction waste (not yet checked)through Planning, housing and land takeCC-017Waste and constructionCC-063Waste and construction
- CC-109 EU: transport is 48% of effort-sharing emissions (Largely supported)through Planning, housing and land takeCC-017Waste and constructionCC-008Transport, air and climate
- CC-111 EU: 621 kg of waste a head, 74% landfilled (Supported)through Planning, housing and land takeCC-017Waste and constructionCC-004Waste and construction
- CC-115 Chamber: congestion cost EUR 770m, 3.4% of GDP (Not substantiated)through Planning, housing and land takeCC-017Waste and constructionCC-008Transport, air and climate
- CC-117 EU: Malta missed recycling targets (reasoned opinion) (not yet checked)through Planning, housing and land takeCC-017Waste and constructionCC-004Waste and construction
Timeline
What was said, what was published before and after it, and each step of this check, in date order. Statements and sources carry the date they were published. The steps of the check carry the date the research was done, from the check's research log. Other statements by the same body on the same topic show whether a position was repeated, changed or corrected.
2023
- 2023 Evidence published Census of Population and Housing 2021: Final Report vol. 2, NSO
2024
- May 2024 Earlier statement by Planning Authority on Planning & Housing CC-068 Marsaskala marina shelved (not yet checked)
2025
- 2 March 2025 The statement Johann Buttigieg, Planning Authority CEO (this claim)
- 2 March 2025 Statement published Johann Buttigieg: 'Issuing permits helps keep property prices in check', MaltaToday
- 7 September 2025 Later statement by Johann Buttigieg on Planning & Housing CC-014 Fewer enforcement notices, fewer illegalities (Misleading)
2026
- 2026 Evidence published Approved Dwelling Units for 2007-2025, Planning Authority
- 2026 Evidence published House price indices, population, overburden, overcrowding, Eurostat
- 3 October 2026 Added to the claims to check
- 3 October 2026 Version 1.0: first issue First issue. Right of reply to the Planning Authority not yet sent.
- 5 October 2026 Version 1.2 Upgrade: (1) New Figure 3 and subsection comparing all 27 Member States (Eurostat demo_gind, tipsho10): Malta’s population growth 2015–2025 is the highest (+30.9%; Luxembourg +21.1%), its real house-price rise (+34.2%, provisional) ranks 16th of 27, below the median state (+41.2%); Germany, France and Italy carry 49% of the EU-27 index weight. (2) Rents added (HICP actual rentals): +53.1% vs EU +20.5%, 8th of 27. (3) “Population growth fifteen times the EU’s” → “about 16 times” (30.87% / 1.90% = 16.3). (4) Latest quarter added: house prices +6.9% a year to 2026-Q2 (EU +4.7%; provisional). (5) TL;DR, key points, tiles, table, Q1, Q2, sub-claim C text, Why, Limitations and flyer updated. Verdict and confidence unchanged. Maintainer decision (5 Oct 2026): a right of reply is sought only where a check finds a claim Not substantiated, Misleading or Contradicted, so this check needs none; cover, page footer and flyer now say “no right of reply needed”. Verdict in this version: Largely supported, moderate confidence.
- 5 October 2026 Evidence reviewed
- 5 October 2026 Version 1.1: corrections Corrections. (1) Housing-cost overburden: Eurostat flags a break in Malta’s series in 2023, so “1.1% (2015) → 6.0% (2025)” and “more than fivefold” → like-for-like runs “1.1% → 2.9% (2015–2022)” and “6.0% → 5.9% → 6.0% (2023–2025)” (TL;DR, tiles, Figure 2 caption, Section 4 table, Q2, Section 7, Limitations, flyer). (2) Real house prices 2015–2025 (+34% Malta, +25% EU) now written to checks.csv by calc.py, which previously held only 2015–2024 (+26%, +21%); Malta’s 2025 value marked provisional (TL;DR, tiles, Figure 1 caption, table “+34%” → “+34% (p)”); table note now states each price row’s basis and period (real, HICP-deflated, to 2025; nominal to 2024). (3) data/cc-013/eurostat_housing.csv: the second sts_cobp_a series each year relabelled as m² of useful floor area (it had the dwellings label); Eurostat flags recorded. (4) Q1: “the most plausible reason … the research supports this” → stated as our inference, not tested for Malta. Verdict and confidence unchanged. all corrections
2027
- 5 October 2027 Coming up: Evidence review due Each finished check is reviewed against new evidence within a year.
Every change to this claim's record is public: history of the record.
Download the report and flyer