CC-108 · Water · Water supply & groundwater
Net-zero impact on the groundwater environment
Pledge: Not measurable as of 11 October 2026 Draft: right of reply pending
The pledge
Not measurable as of 11 October 2026
Not measurable: the pledge as worded has no definition, baseline or date against which delivery could be checked.
The cap is met so far (11.5 million m3 in 2025) but sits near the highest year read; the net-zero aim has no definition, baseline or date.
- Target
- WSC annual groundwater abstraction capped at 14 Mm3 up to 2030; WSC 'moving towards' net-zero impact on the groundwater environment
- Made by
- Energy and Water Agency
- Made in
- Green Paper on the Regulation of Groundwater Abstraction in the Maltese Islands (EWA, Nov 2023) (November 2023)
- Deadline
- 31 December 2030
All pledges and how they are labelled · See it on the pledges timeline
Parts of this claim
The claim is split into parts that are tested separately, as in the report below. Each part has its own number.
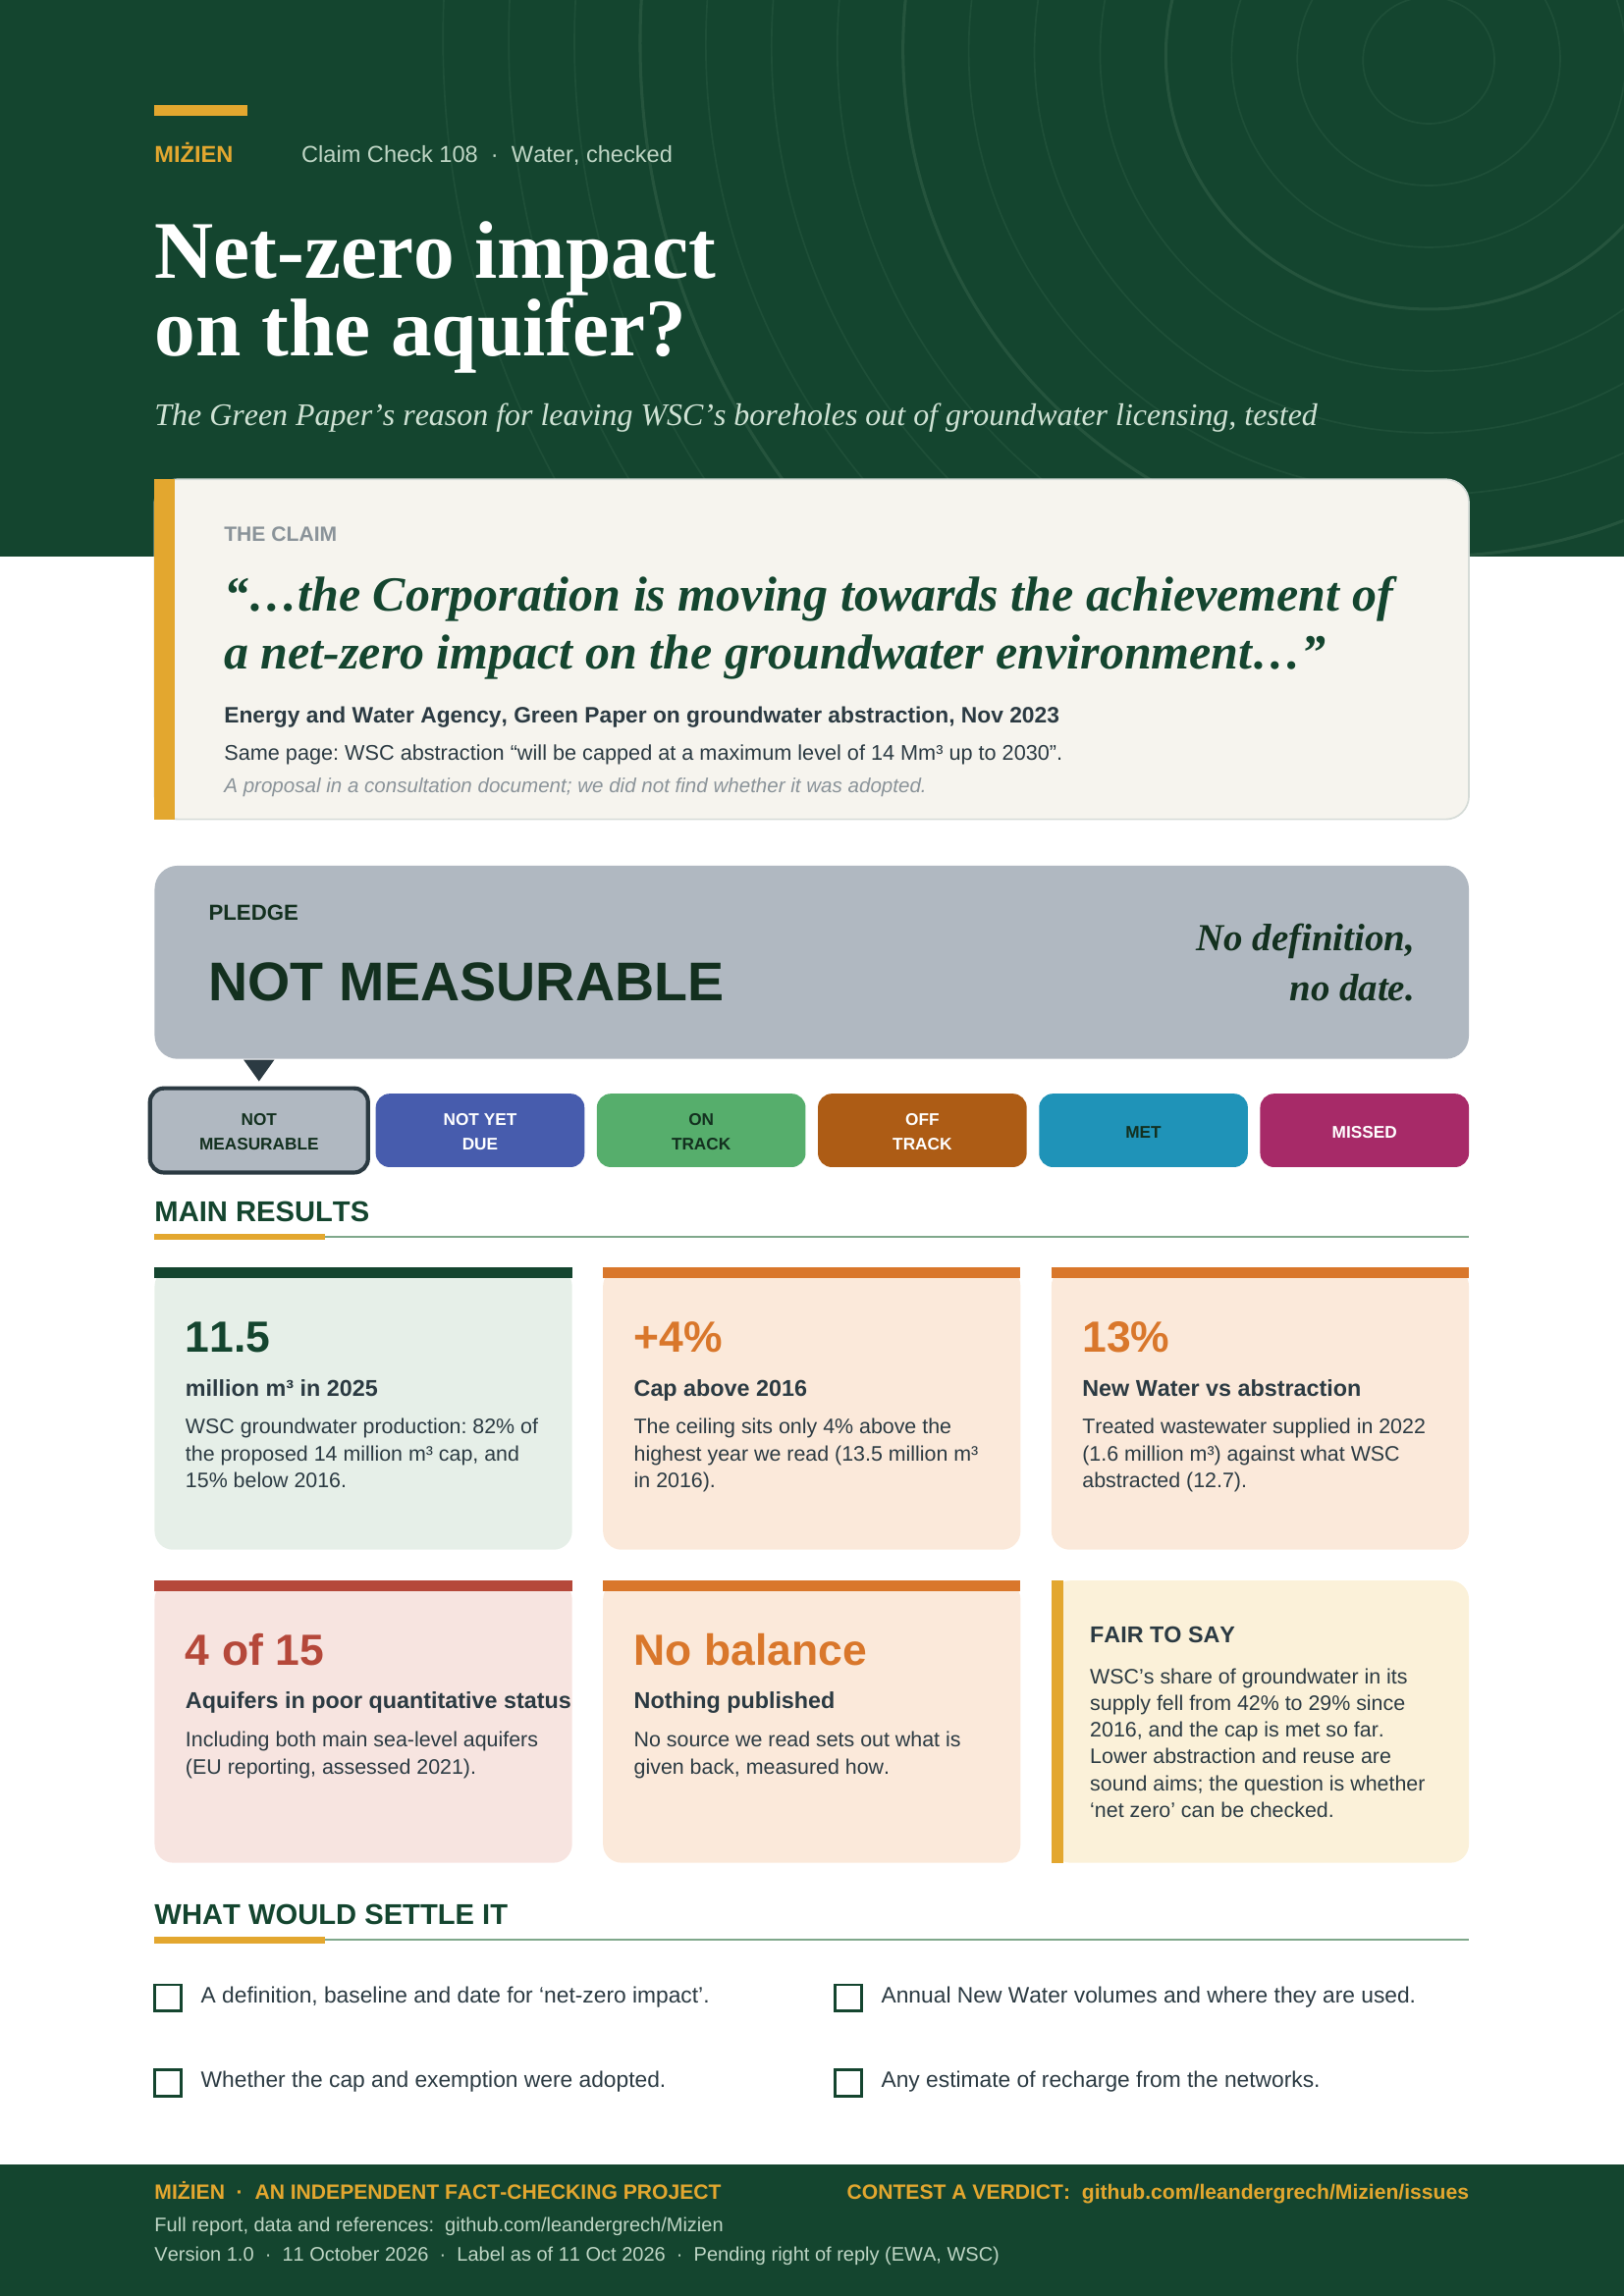
- CC-108A WSC’s annual groundwater abstraction “will be capped at a maximum level of 14 Mm³ up to 2030” (Energy and Water Agency [1])Production was 11.5 million m³ in 2025 (82% of the cap) and below 14 in every year read (highest 13.5 in 2016). The cap is 4% above that highest year; a proposal, adoption not found.
- CC-108B WSC “is moving towards the achievement of a net-zero impact on the groundwater environment” (Energy and Water Agency [1])No definition, baseline or date. Abstraction is 15% below 2016, but part of the fall reflects aquifer degradation [1]; New Water (1.6 million m³ in 2022) and unquantified recharge do not yet show a balance; sea-level aquifers still poor.
Claim Check 108 · Water, checked
Net-zero impact on the aquifer?
Testing the Green Paper’s reasons for exempting WSC’s boreholes from groundwater licensing
“…the Corporation is moving towards the achievement of a net-zero impact on the groundwater environment…”
Energy and Water Agency, Green Paper on groundwater abstraction, November 2023, p. 12.
Same page: WSC abstraction “will be capped at a maximum level of 14 Mm³ up to 2030”.
Verdict: Not measurable As of 11 Oct 2026: no definition, baseline or date for net zero
Version 1.0 · 11 October 2026
TL;DR
The Energy and Water Agency’s Green Paper of November 2023 [1] proposes that groundwater sources run by the Water Services Corporation (WSC) stay outside the new abstraction licensing framework, “given that the Corporation is moving towards the achievement of a net-zero impact on the groundwater environment through its operations”, and that WSC’s annual abstraction “will be capped at a maximum level of 14 Mm³ up to 2030”. We tested both statements against WSC’s production reports, Eurostat and the EU’s groundwater-body assessments.
- The cap is not tight. WSC groundwater production was 11.5 million m³ in 2025 [6, 7], 82% of the proposed 14. The highest year we read (13.5 million m³ in 2016) was already 96% of it, so the ceiling sits about 4% above that year and 21% above 2025.
- “Net-zero impact” has no definition, baseline or date in the Green Paper. Sapiano (Energy and Water Agency, 2020) describes it as giving back to the aquifer environment “at least, as much water” as WSC abstracts, by recharge and by supplying treated wastewater in place of groundwater [2]. We found no published balance.
- The give-back we can count is small. New Water (treated wastewater) was 1.6 million m³ in 2022 [1]: 13% of WSC’s abstraction that year, and meant for crop irrigation rather than to replace WSC’s own boreholes. WSC’s stated maximum of 7 million m³ [3] would be 61% of 2025 abstraction, before any recharge, which no source we read quantifies.
- The aquifers are still in poor quantitative status. The Green Paper says good status “will not be achieved” for the main sea-level bodies [1].
- Pledge label: not measurable (as of 11 October 2026). The aim cannot be checked as worded; the cap can, and is met so far. A gap in what was published, not a finding of failure.
- Not measurable
- Not yet due
- On track
- Off track
- Met
- Missed
What would make it measurable or on track
A definition of the net-zero balance (what is given back, where, measured how), a baseline and a date, with annual figures; or the adopted rule, with the 14 million m³ cap in force and reported against.
What would count against it
Annual WSC abstraction above 14 million m³, or a published balance showing give-back far below abstraction.
IN THIS REPORT
1 The statements and their sources
Our candidate record combined statements from several documents, and some of its wording came from search summaries. We read the Green Paper in full and two WSC pages, and separate what each says.
| Source | Wording | Status |
|---|---|---|
| Energy and Water Agency, Green Paper on the Regulation of Groundwater Abstraction in the Maltese Islands, Nov 2023, p. 12 [1] | “The Groundwater Abstraction Licensing Framework will not be applicable to groundwater sources operated by the Water Services Corporation, given that the Corporation is moving towards the achievement of a net-zero impact on the groundwater environment through its operations. Annual groundwater abstraction levels by the Water Services Corporation will be capped at a maximum level of 14 Mm³ up to 2030.” | Primary wording (verbatim). A proposal in a consultation document; outcome not found |
| Sapiano (Energy and Water Agency), Acque Sotterranee 2020, p. 31 [2] | Describes the concept, citing WSC 2018: the utility gives back “at least, as much water as the groundwater it abstracts … through intended and unintended aquifer recharge and the supply of treated wastewaters to be used in substitution of groundwater”. | Agency author’s description of WSC’s aim |
| WSC news release, 2 April 2019 [3] | Says the project will cut groundwater abstraction “by 4 billion litres per year” and make “A maximum of 7 billion litres a year of recycled water” available to agriculture. Checked separately in Claim Check 039. | Primary; context |
| Sustain Europe, unsigned article, 6 Nov 2018 [5] | Says WSC “will be giving back to the environment, at least an equivalent volume of the abstracted natural freshwater resources”. The article does not name its source. | Outlet text; speaker not named, not rated |
2 Method
Question. Is WSC’s groundwater abstraction within the proposed cap, and is there evidence that it is “moving towards” a net-zero impact on the groundwater environment? Can either be checked as worded?
Cap. We compare the 14 million m³ with WSC’s reported groundwater production: 2016 from its 2016 annual report [6] and 2022–2025 from the 2025 report’s production chart [7], transcribed for Claim Check 009. Years 2017–2021 were not read. Eurostat’s public-supply groundwater abstraction (2024, estimated) [8] is shown for comparison; it measures something different and runs about 1.2 million m³ above WSC’s own 2024 figure.
Net-zero impact. We take the concept as Sapiano [2] describes it and count what can be counted: WSC’s own abstraction, the New Water volume (Green Paper [1]; WSC [3]) and national abstraction and recharge (Eurostat [8]). Aquifer status is from the EEA’s WISE reporting of the third river basin management plan cycle (status assessed 2021) [9]. Code: tools/cc-108-report/calc.py; results in data/cc-108/checks.csv.
Grades. The Green Paper and WSC reports are self-reported or agency documents (C); Eurostat figures are official statistics flagged as estimates (C); our arithmetic is an order-of-magnitude check and is labelled so.
3 The 14 million m³ cap
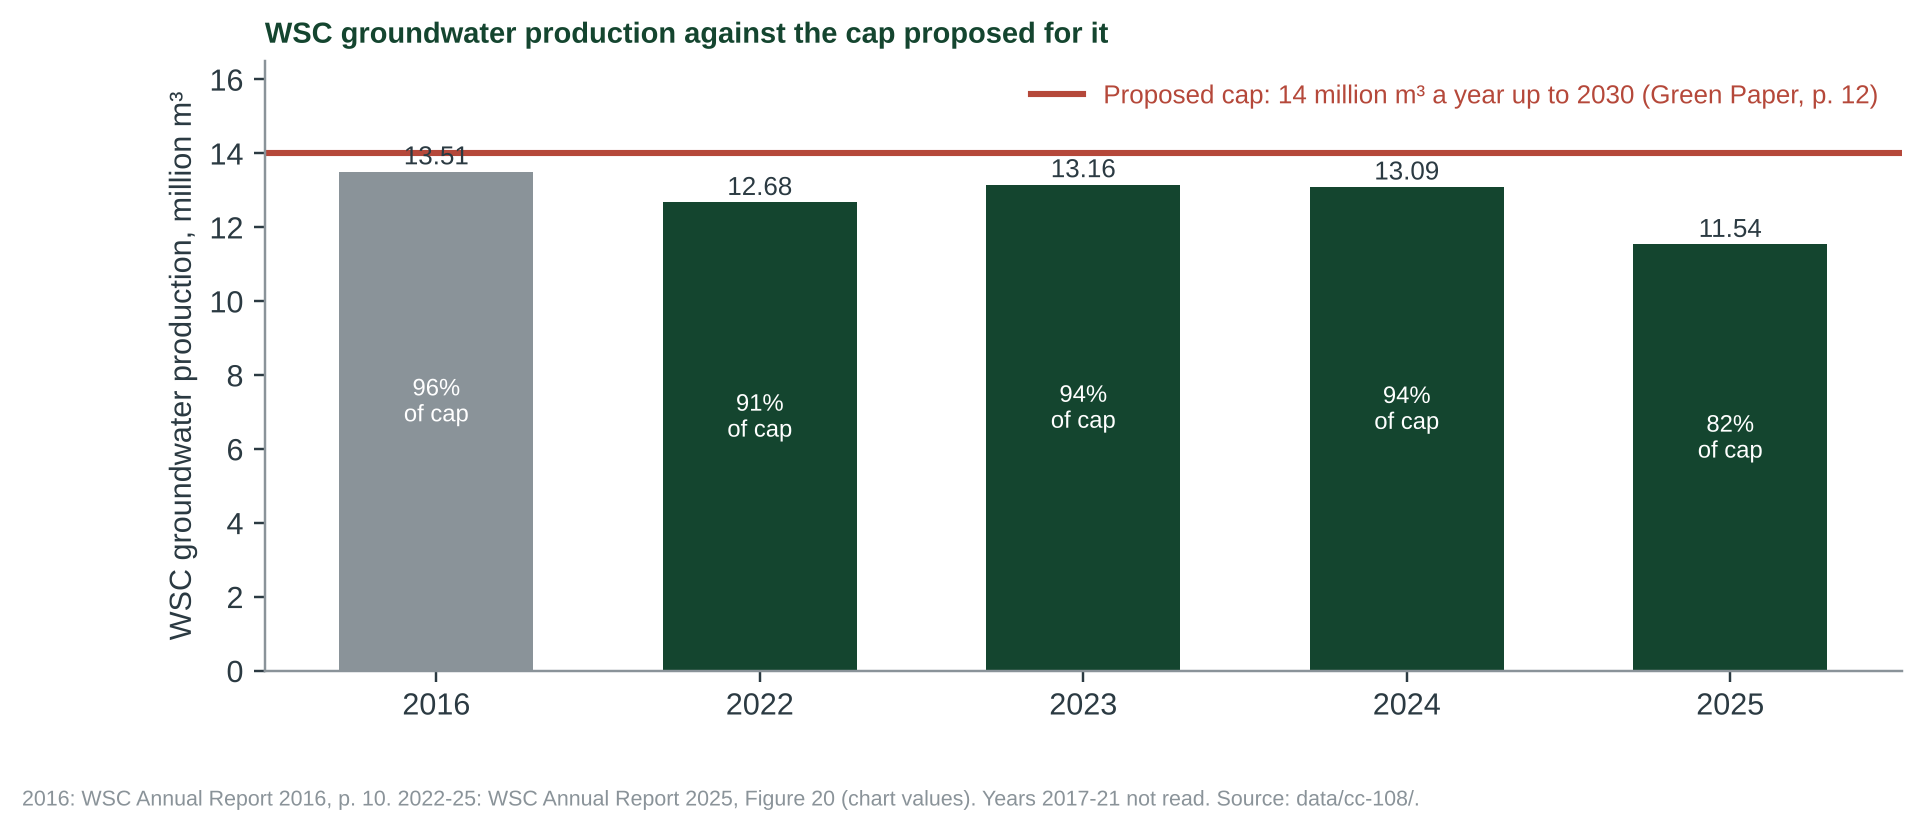
| Measure | Value | Source |
|---|---|---|
| Proposed cap for WSC, up to 2030 | 14.0 million m³ a year | Green Paper p. 12 [1] |
| WSC groundwater production 2016 / 2022 / 2023 / 2024 / 2025 | 13.51 / 12.68 / 13.16 / 13.09 / 11.54 | WSC AR 2016, AR 2025 [6, 7] |
| Share of the cap, same years | 96% / 91% / 94% / 94% / 82% | calculated |
| Cap above the highest year read (2016) | +3.7% | calculated |
| Cap above 2025 production | +21% (2.46 million m³ of headroom) | calculated |
| Eurostat public-supply groundwater abstraction, 2024 | 14.28 million m³ (estimated) | Eurostat env_wat_abs [8] |
| WSC share of national fresh groundwater abstraction, 2024 | 34% (13.09 of 38.46 million m³) | calculated [7, 8] |
The 2025 chart values carry the small internal differences recorded for Claim Check 009.
Fairness to WSC and the Agency
- WSC’s production fell about 15% from 2016 to 2025 while its total production rose about 23% (Claim Check 039): groundwater’s share of its supply fell from 42% to 29%.
- The Green Paper proposes the cap and the exemption; it is a consultation document. We did not find the adopted regulation, so the cap is tested as a stated intention, not as a legal limit.
- The Green Paper also says WSC’s abstraction is “fully accounted for” and that its stations are monitored for salinity (p. 5) [1]. That is context for the exemption, not the reason the Green Paper gives for it.
4 ‘Net-zero impact’: what can be counted
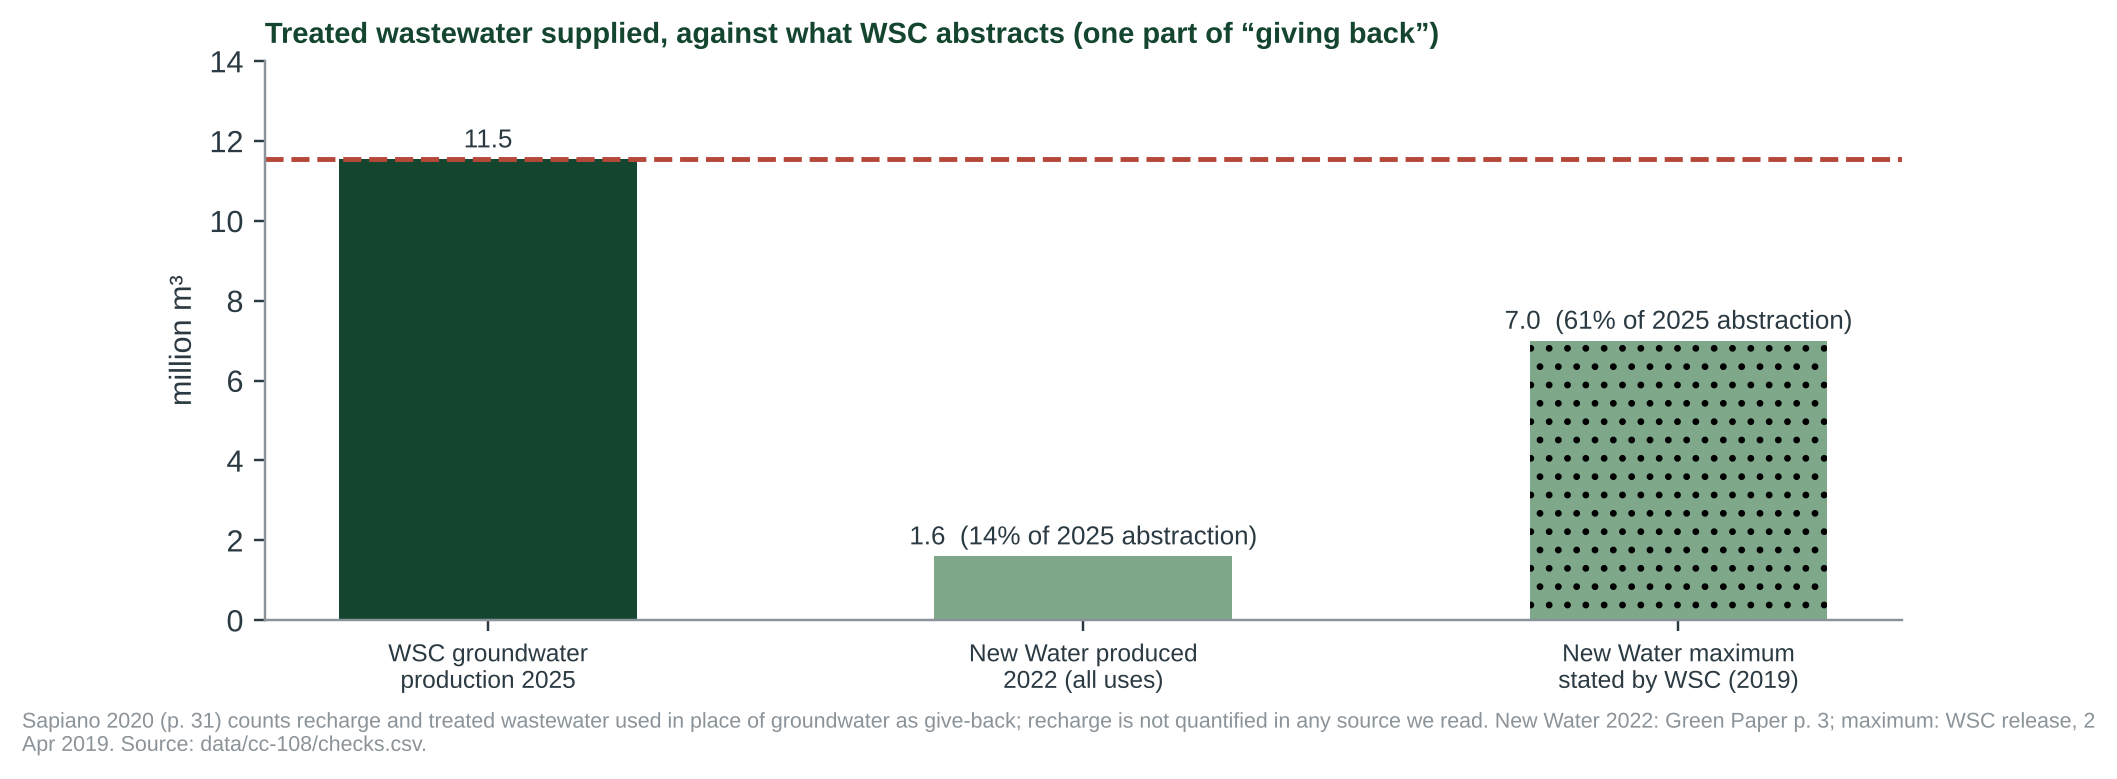
| Item | Value | Source |
|---|---|---|
| New Water produced in 2022 (combined; intended for crop irrigation) | 1.6 million m³ (13% of WSC’s 2022 abstraction) | Green Paper p. 3 [1]; calculated |
| New Water maximum stated by WSC, 2019 | 7 million m³ a year (61% of WSC’s 2025 abstraction) | WSC release [3]; calculated |
| Aquifer recharge from WSC operations (leaks, sewer exfiltration) | not quantified in any source we read | — |
| National fresh groundwater abstraction 2024 against estimated recharge | 38.5 vs 41.5 million m³ (93%), both estimates | Eurostat [8] |
| Groundwater bodies in poor quantitative status (3rd cycle, assessed 2021) | 4 of 15, including both main sea-level bodies | EEA WISE [9] |
| Groundwater bodies in poor chemical status (same) | 15 of 15 | EEA WISE [9] |
What the counting shows
- Direction, yes; balance, not shown. WSC’s abstraction is lower than in 2016 and treated wastewater is being supplied, so “moving towards” is consistent with the numbers. But on Sapiano’s definition [2] the give-back must equal what is abstracted, and the quantified part is far from it: even at WSC’s stated maximum for New Water, 4.5 million m³ of 2025 abstraction would be unmatched, unless unquantified recharge makes up the difference.
- New Water mostly replaces other people’s groundwater. It is meant for crop irrigation [1], so it relieves the aquifer by displacing farm boreholes, not WSC’s own. That fits Sapiano’s definition, which counts treated wastewater “used in substitution of groundwater”, but it means the accounting is across users, and no source we read does it.
- The aquifer’s condition does not settle it either way. The sea-level bodies are in poor quantitative status, and the Green Paper says good status “will not be achieved” for them (p. 10) [1]. The Green Paper names over-abstraction as the cause of saline intrusion (p. 2) [1], and agriculture is the largest abstractor [8]; the status data do not isolate WSC’s share, and residence times of years to decades (Claim Check 009) mean one year cannot show recovery.
- No target date, no metric. The Green Paper says “moving towards”; it gives no year for reaching net zero and no indicator that would show it.
5 Testing the statements
| Sub-claim | Said by | What the evidence shows | Rating |
|---|---|---|---|
| A. WSC’s annual groundwater abstraction “will be capped at a maximum level of 14 Mm³ up to 2030” | Energy and Water Agency [1] | Production was 11.5 million m³ in 2025 (82% of the cap) and below 14 in every year read (highest 13.5 in 2016). The cap is 4% above that highest year; a proposal, adoption not found. | WITHIN CAP SO FAR |
| B. WSC “is moving towards the achievement of a net-zero impact on the groundwater environment” | Energy and Water Agency [1] | No definition, baseline or date. Abstraction is 15% below 2016, but part of the fall reflects aquifer degradation [1]; New Water (1.6 million m³ in 2022) and unquantified recharge do not yet show a balance; sea-level aquifers still poor. | NOT MEASURABLE AS WORDED |
6 Pledge label and requests for evidence
As of 11 October 2026. The net-zero aim has no definition, baseline or date; the cap is met so far but sits above recent use.
Why. The Green Paper states an intention (“moving towards”) and a proposed cap. The cap can be checked, and is met so far. The net-zero aim, which is the reason the Green Paper gives for the exemption, has no indicator, so delivery cannot be shown or refuted. A target is not a statement of fact, so we do not call it false; we label it Not measurable (Appendix A lists the six pledge labels).
What this label does not say. It does not say WSC is failing or that the exemption is wrong. Lower abstraction and wastewater reuse are sound aims. A checkable version would read: “From [year], WSC’s groundwater abstraction minus the volume it returns to or saves from the aquifer, measured as [method], will be zero or negative by [date].”
Evidence we are asking for
- From the Energy and Water Agency: the definition, baseline year, date and indicator behind “net-zero impact on the groundwater environment”, and whether the Green Paper’s cap and exemption were adopted.
- From WSC: annual groundwater abstraction by source since 2014, and the annual volume of New Water supplied and where it is used.
- From WSC and the Agency: any estimate of unintended aquifer recharge from the networks, and the 2018 framework document that Sapiano [2] cites.
- From the Agency: how the 14 million m³ is measured (metered abstraction or production) and how it relates to Eurostat’s public-supply series.
7 Limitations
- The Green Paper is a consultation proposal. We did not find the White Paper, regulation or any report on whether the cap and exemption were adopted (a web search of 11 Oct 2026 found only the Green Paper, its consultation pages and comment letters; ERA and legislation.mt were not searched in full).
- WSC’s 2016 and 2025 production series come from different reports; we did not verify that definitions match. Years 2017–2021 were not read. The 2025 values are read from a chart.
- We do not know whether the Green Paper’s “abstraction” means WSC’s reported production or metered abstraction, or how Eurostat’s public-supply figure is built.
- Page numbers for the Green Paper are the printed spread numbers (the PDF holds two pages per sheet). Sapiano’s page is the journal pagination (PDF page 7 of 8).
- The New Water maximum is a capacity statement from 2019, not an outturn. No New Water volume after 2022 was found, so the give-back figures are a lower bound on what is delivered today.
- The WSC pages were read live on 11 Oct 2026. We did not find the “equivalent volume” wording on them and did not read WSC’s 2018 framework document; the concept is taken from Sapiano’s description.
References
- [1] Energy and Water Agency (Nov 2023). Green Paper on the Regulation of Groundwater Abstraction in the Maltese Islands, pp. 3, 5, 6, 10, 12. (Full text read 11 Oct 2026; page numbers are the printed spread numbers.) https://energywateragency.gov.mt/wp-content/uploads/2023/11/GREEN-PAPER.pdf
- [2] Sapiano M. (2020). Integrated Water Resources Management in the Maltese Islands. Acque Sotterranee – Italian Journal of Groundwater 9(3):25–32. doi:10.7343/as-2020-477. (Full text read; open access; author at the Energy and Water Agency.) https://doi.org/10.7343/as-2020-477
- [3] Water Services Corporation (2 April 2019). European Commission Endorses WSC’s ‘Net Zero-Impact’ Utility Project. News release. (Read live 11 Oct 2026.) https://www.wsc.com.mt/european-commission-endorses-wscs-net-zero-impact-utility-project/
- [4] Water Services Corporation (16 April 2018). Towards a Net Zero-Impact Utility: new €100 million EU-funded project. (Read live 11 Oct 2026.) https://www.wsc.com.mt/towards-a-net-zero-impact-utility-new-e100-million-eu-funded-project-set-to-improve-water-quality-to-all-new-highs/
- [5] Sustain Europe (6 November 2018). Closing the water loop – improving the sustainability of Malta’s water resources. Unsigned article. https://www.sustaineurope.com/closing-the-water-loop-%E2%80%93-improving-the-sustainability-of-malta%E2%80%99s-water-resources-20181105.html
- [6] Water Services Corporation (2017). Annual Report 2016, p. 10. (Read in the Internet Archive copy for Claim Check 039.) https://www.wsc.com.mt/wp-content/uploads/2018/03/Annual_Report_-_16.pdf
- [7] Water Services Corporation. Annual Report 2025, Figure 20 (groundwater production 2022–2025), as transcribed for Claim Check 009; parlament.mt refused this site’s request on 11 Oct 2026. https://parlament.mt/media/139352/wsc-annual-report-2025.pdf
- [8] Eurostat. Water abstraction by source and sector (env_wat_abs) and renewable freshwater resources (env_wat_res), Malta; retrieved 5 Oct 2026. Values flagged ‘e’ (estimated). https://ec.europa.eu/eurostat/databrowser/view/env_wat_abs/default/table
- [9] European Environment Agency. WISE Water Framework Directive database, groundwater bodies, Malta, 2nd and 3rd reporting cycles; retrieved 5 Oct 2026 for Claim Check 009 (data/cc-009/wise_gwb_status.csv). https://water.discomap.eea.europa.eu/arcgis/rest/services/WISE_WFD/WFD2022_GroundWaterBody_WM/MapServer/0
- [10] MiŻien. Analysis code and outputs: tools/cc-108-report/; data/cc-108/.
Appendix A: series standards and verdict scale
Every investigation in this series follows the same rules so that verdicts are comparable and challengeable.
| Verdict | Meaning |
|---|---|
| SUPPORTED | Evidence consistently backs the claim as stated. |
| LARGELY SUPPORTED | Backed by the evidence, with minor caveats that do not change the substance. |
| NOT SUBSTANTIATED | Stated more strongly than the evidence offered or available allows. May be true in some conditions but has not been shown. |
| MISLEADING | Omits material facts so that the overall impression is inaccurate, even if individual statements are defensible. |
| CONTRADICTED | The available evidence points against the claim. |
Pledge labels
A pledge is a promise of future action, so it cannot be true or false when it is made. It gets one of these labels instead of a verdict, with the date of the evidence behind it.
| Pledge label | Meaning |
|---|---|
| NOT MEASURABLE | The pledge as worded has no definition, baseline or date against which delivery could be checked. |
| NOT YET DUE | Measurable; the deadline or term has not passed and no progress data have been published yet. |
| ON TRACK | Published progress is at or ahead of a straight-line path (or the pledge's own milestones) to the target by the deadline. |
| OFF TRACK | Published progress is behind that path, and the target has not yet been shown to be met or missed. |
| MET | Documents or data show the target was reached, by the deadline if one was set. |
| MISSED | The deadline or term has passed, and documents or data that can be shown say the target was not reached. |
Confidence
High: multiple independent lines of evidence agree. Moderate: evidence is relevant but incomplete or indirect. Low: evidence is thin, second-hand or conflicting.
Evidence grades
A experiment · B observational study with a control or gradient · C review, guidance or official statistics · D assertion or anecdote. The Green Paper, WSC reports and Sapiano (an Energy and Water Agency author) are agency or self-reported documents (C); our own arithmetic is an order-of-magnitude estimate.
Standards
- Quote the speaker, not the headline, with outlet and date, and link the original where possible.
- Separate the claim from the evidence offered for it, and say who made which statement.
- Grade the evidence and show differing views side by side where the evidence is unsettled.
- State what we could not access or verify, and what would change the verdict either way.
- Ask for the missing evidence in specific, answerable requests.
- Offer a right of reply where a check finds a claim Not substantiated, Misleading or Contradicted (or a pledge Not measurable, Off track or Missed), before wider circulation, and append responses.
- Correct errors openly with a version number and change log.
- Whistle-blow only on evidence: a verdict of Misleading or Contradicted requires documents or data that can be shown, not inference.
- Check every side. Government, opposition, NGOs and developers are held to the same standard.
Appendix B: revision log
| Version | Date | Change |
|---|---|---|
| 1.0 | 11 Oct 2026 | First issue. Pledge label: not measurable. The 14 million m³ cap is met so far (WSC production 11.5 million m³ in 2025, 82% of it) but sits close to the highest year read (13.5 in 2016). The net-zero aim has no definition, baseline or date; the give-back we can count (New Water 1.6 million m³ in 2022) is small against 11.5 million m³ abstracted. Draft pending right of reply from the Energy and Water Agency and the Water Services Corporation. |
Sources and archived copies
-
Green Paper on the Regulation of Groundwater Abstraction in the Maltese Islands, Energy and Water Agency, 2023-11.
Original · fetched and fingerprinted 2026-10-10; no public snapshot yet
Primary wording, p. 12 (printed spread numbers). Read in full 11 Oct 2026; PDF sha256 c75845a6...ed447. -
Integrated Water Resources Management in the Maltese Islands (Sapiano 2020, p. 31), Acque Sotterranee 9(3), 2020.
Original · fetched and fingerprinted 2026-10-10; no public snapshot yet
Agency author's description of the net-zero impact concept (give back at least as much water as is abstracted). -
European Commission Endorses WSC's 'Net Zero-Impact' Utility Project, Water Services Corporation, 2019-04-02.
Original · Archived copy
Read live 11 Oct 2026. Context (4 billion litres; 7 billion litres of recycled water). Does not contain the "equivalent volume" wording. -
Towards a Net Zero-Impact Utility: new EUR 100 million EU-funded project, Water Services Corporation, 2018-04-16.
Original · fetched and fingerprinted 2026-10-10; no public snapshot yet
Read live 11 Oct 2026. Context; no give-back wording. -
Closing the water loop, Sustain Europe (unsigned), 2018-11-06.
Original · not yet archived
Carries the "at least an equivalent volume" wording without naming a speaker; not rated.
Right of reply
Not applicable until a draft verdict exists.
Connections
How this claim relates to the others: who made it, the themes it shares with other claims, and the patterns it shows. A connection is a reason to read two checks side by side. It does not make either one right or wrong. How connections are found.
Who made it
Other claims by Energy and Water Agency 1
Linked directly 3
Claims that share a theme with this one. A theme is a cause, a mechanism, a target or a way of presenting figures that the editors have found in several claims; its strength says how close the link is.
Water chain: farm waste, sewage, sea, aquifer Shared driver · Strong
The Commission blames farm waste in the sewers for poor treatment; agricultural nitrates are behind groundwater failure. Treated water also feeds 'new water' irrigation.
Same pattern
Pattern tags name a recurring way a claim can mislead. They describe the statement, not the speaker.
Promise-without-baseline
A target or pledge with no stated starting point, scope or counting basis.
- CC-008 Flyovers and congestion (Not substantiated)
- CC-010 Tree-planting counts (Largely supported)
- CC-011 Ten minutes' walk to green space (pledge: Not measurable)
- CC-012 Ta' Qali gravel and grass (Contradicted)
- CC-017 Land reclamation outside the Freeport (Not substantiated)
- CC-021 Malta-Gozo tunnel traffic (not yet checked)
- CC-029 First offshore wind farm (Largely supported)
- CC-030 Carbon-neutral airport (Not substantiated)
- CC-031 Gozo, first climate-neutral region (Largely supported)
- CC-039 Net Zero Impact Utility (pledge: Not measurable)
- CC-055 Manoel Island back to the public (Supported)
- CC-079 Waste-to-energy: 4.5% of energy (Misleading)
- CC-092 PN: afforestation in a net-zero Gozo (pledge: Not measurable)
- CC-107 A net-zero Gozo by 2040 (pledge: Not measurable)
- CC-125 EU: Malta Social Climate Plan EUR 60.6 million (not yet checked)
Two steps away 6
Not linked to this claim directly, but linked to a claim that is. These are found by following the links, not chosen by the editors, so they are looser: they show where one theme meets another.
- CC-005 “92% excellent” bathing water (Supported)through Water chain: farm waste, sewage, sea, aquiferCC-009Water chain: farm waste, sewage, sea, aquifer
- CC-047 Nitrates in the aquifer (Largely supported)through Water chain: farm waste, sewage, sea, aquiferCC-009Water chain: farm waste, sewage, sea, aquifer or Water chain: farm waste, sewage, sea, aquiferCC-101Water chain: farm waste, sewage, sea, aquifer
- CC-117 EU: Malta missed recycling targets (reasoned opinion) (not yet checked)through Water chain: farm waste, sewage, sea, aquiferCC-101EU findings of unmet obligations
- CC-118 Council: Malta second-highest water stress, groundwater failing (Largely supported)through Water chain: farm waste, sewage, sea, aquiferCC-009Water chain: farm waste, sewage, sea, aquifer or Water chain: farm waste, sewage, sea, aquiferCC-101Water chain: farm waste, sewage, sea, aquifer
- CC-128 EU: Malta missed the water-plan timetable (not yet checked)through Water chain: farm waste, sewage, sea, aquiferCC-101EU findings of unmet obligations
- CC-129 EU: Malta has not updated its air pollution programme (not yet checked)through Water chain: farm waste, sewage, sea, aquiferCC-101EU findings of unmet obligations
Three steps away 6
One step further again. At this distance a connection says more about how the themes fit together than about this claim.
- CC-004 'Strong progress' in waste separation (Not substantiated)through Water chain: farm waste, sewage, sea, aquiferCC-101EU findings of unmet obligationsCC-117Waste and construction
- CC-041 Sewage plants compliant by 2026 (not yet checked)through Water chain: farm waste, sewage, sea, aquiferCC-009Water chain: farm waste, sewage, sea, aquiferCC-005Water chain: farm waste, sewage, sea, aquifer
- CC-042 'From Blue Flag to Red Alert' (Largely supported)through Water chain: farm waste, sewage, sea, aquiferCC-009Water chain: farm waste, sewage, sea, aquiferCC-005Water chain: farm waste, sewage, sea, aquifer
- CC-043 13 Blue Flag beaches (not yet checked)through Water chain: farm waste, sewage, sea, aquiferCC-009Water chain: farm waste, sewage, sea, aquiferCC-005Water chain: farm waste, sewage, sea, aquifer
- CC-081 Landfill share rising (not yet checked)through Water chain: farm waste, sewage, sea, aquiferCC-101EU findings of unmet obligationsCC-117Waste and construction
- CC-111 EU: 621 kg of waste a head, 74% landfilled (Supported)through Water chain: farm waste, sewage, sea, aquiferCC-101EU findings of unmet obligationsCC-117Waste and construction
Similar wording
Claims whose own words overlap with this one, with the words they share. Found by comparing the wording of the claims, not their verdicts; a lead to read them together, not a finding.
- CC-039 Net Zero Impact Utility (pledge: Not measurable)shares: corporation, abstraction, net
- CC-101 EU: no registration or prior authorisation of water abstraction in Malta (Largely supported)shares: abstraction, groundwater, impact
Timeline
What was said, what was published before and after it, and each step of this check, in date order. Statements and sources carry the date they were published. The steps of the check carry the date the research was done, from the check's research log. Other statements by the same body on the same topic show whether a position was repeated, changed or corrected.
2018
- 6 November 2018 Reported Closing the water loop - improving the sustainability of Malta's water resources, Sustain Europe
2023
- November 2023 The statement Energy and Water Agency (EWA) (this claim)
- November 2023 Statement published Green Paper on the Regulation of Groundwater Abstraction in the Maltese Islands (full text, pp. 3, 5, 6, 10, 12), Energy and Water Agency
- November 2023 Evidence published Green Paper on the Regulation of Groundwater Abstraction in the Maltese Islands, Energy and Water Agency
2024
- 2024 Later statement by Manuel Sapiano on Water CC-040 Low water use per head (Largely supported)
2026
- 5 October 2026 Added to the claims to check
- 11 October 2026 Check started Candidate taken by worker C. Green Paper PDF, both WSC pages and Sapiano 2020 read; Wayback unreachable (connection reset).
- 11 October 2026 Exact wording found Verbatim wording found in the Green Paper p. 12 (exemption reason and 14 Mm3 cap). The "equivalent volume" wording from the candidate record is not on either WSC page; found only in an unsigned Sustain Europe article (2018), not attributed.
- 11 October 2026 Note Calculations in tools/cc-108-report/calc.py from data/cc-108/inputs.csv (WSC series from CC-039/CC-009, Eurostat, Green Paper, WSC 2019 release). Search for the outcome of the Green Paper (1 web search) found nothing on adoption.
- 11 October 2026 Version 1.0: first issue First issue. Pledge label: not measurable. Draft pending right of reply.
- 11 October 2026 Evidence reviewed
- 11 October 2026 Pledge label: Not measurable WSC annual groundwater abstraction capped at 14 Mm3 up to 2030; WSC 'moving towards' net-zero impact on the groundwater environment
2027
- 11 October 2027 Coming up: Evidence review due Each finished check is reviewed against new evidence within a year.
2030
- 31 December 2030 Coming up: Pledge deadline
Every change to this claim's record is public: history of the record.
Download the report and flyer