CC-039 · Water · Water supply & groundwater
Net Zero Impact Utility
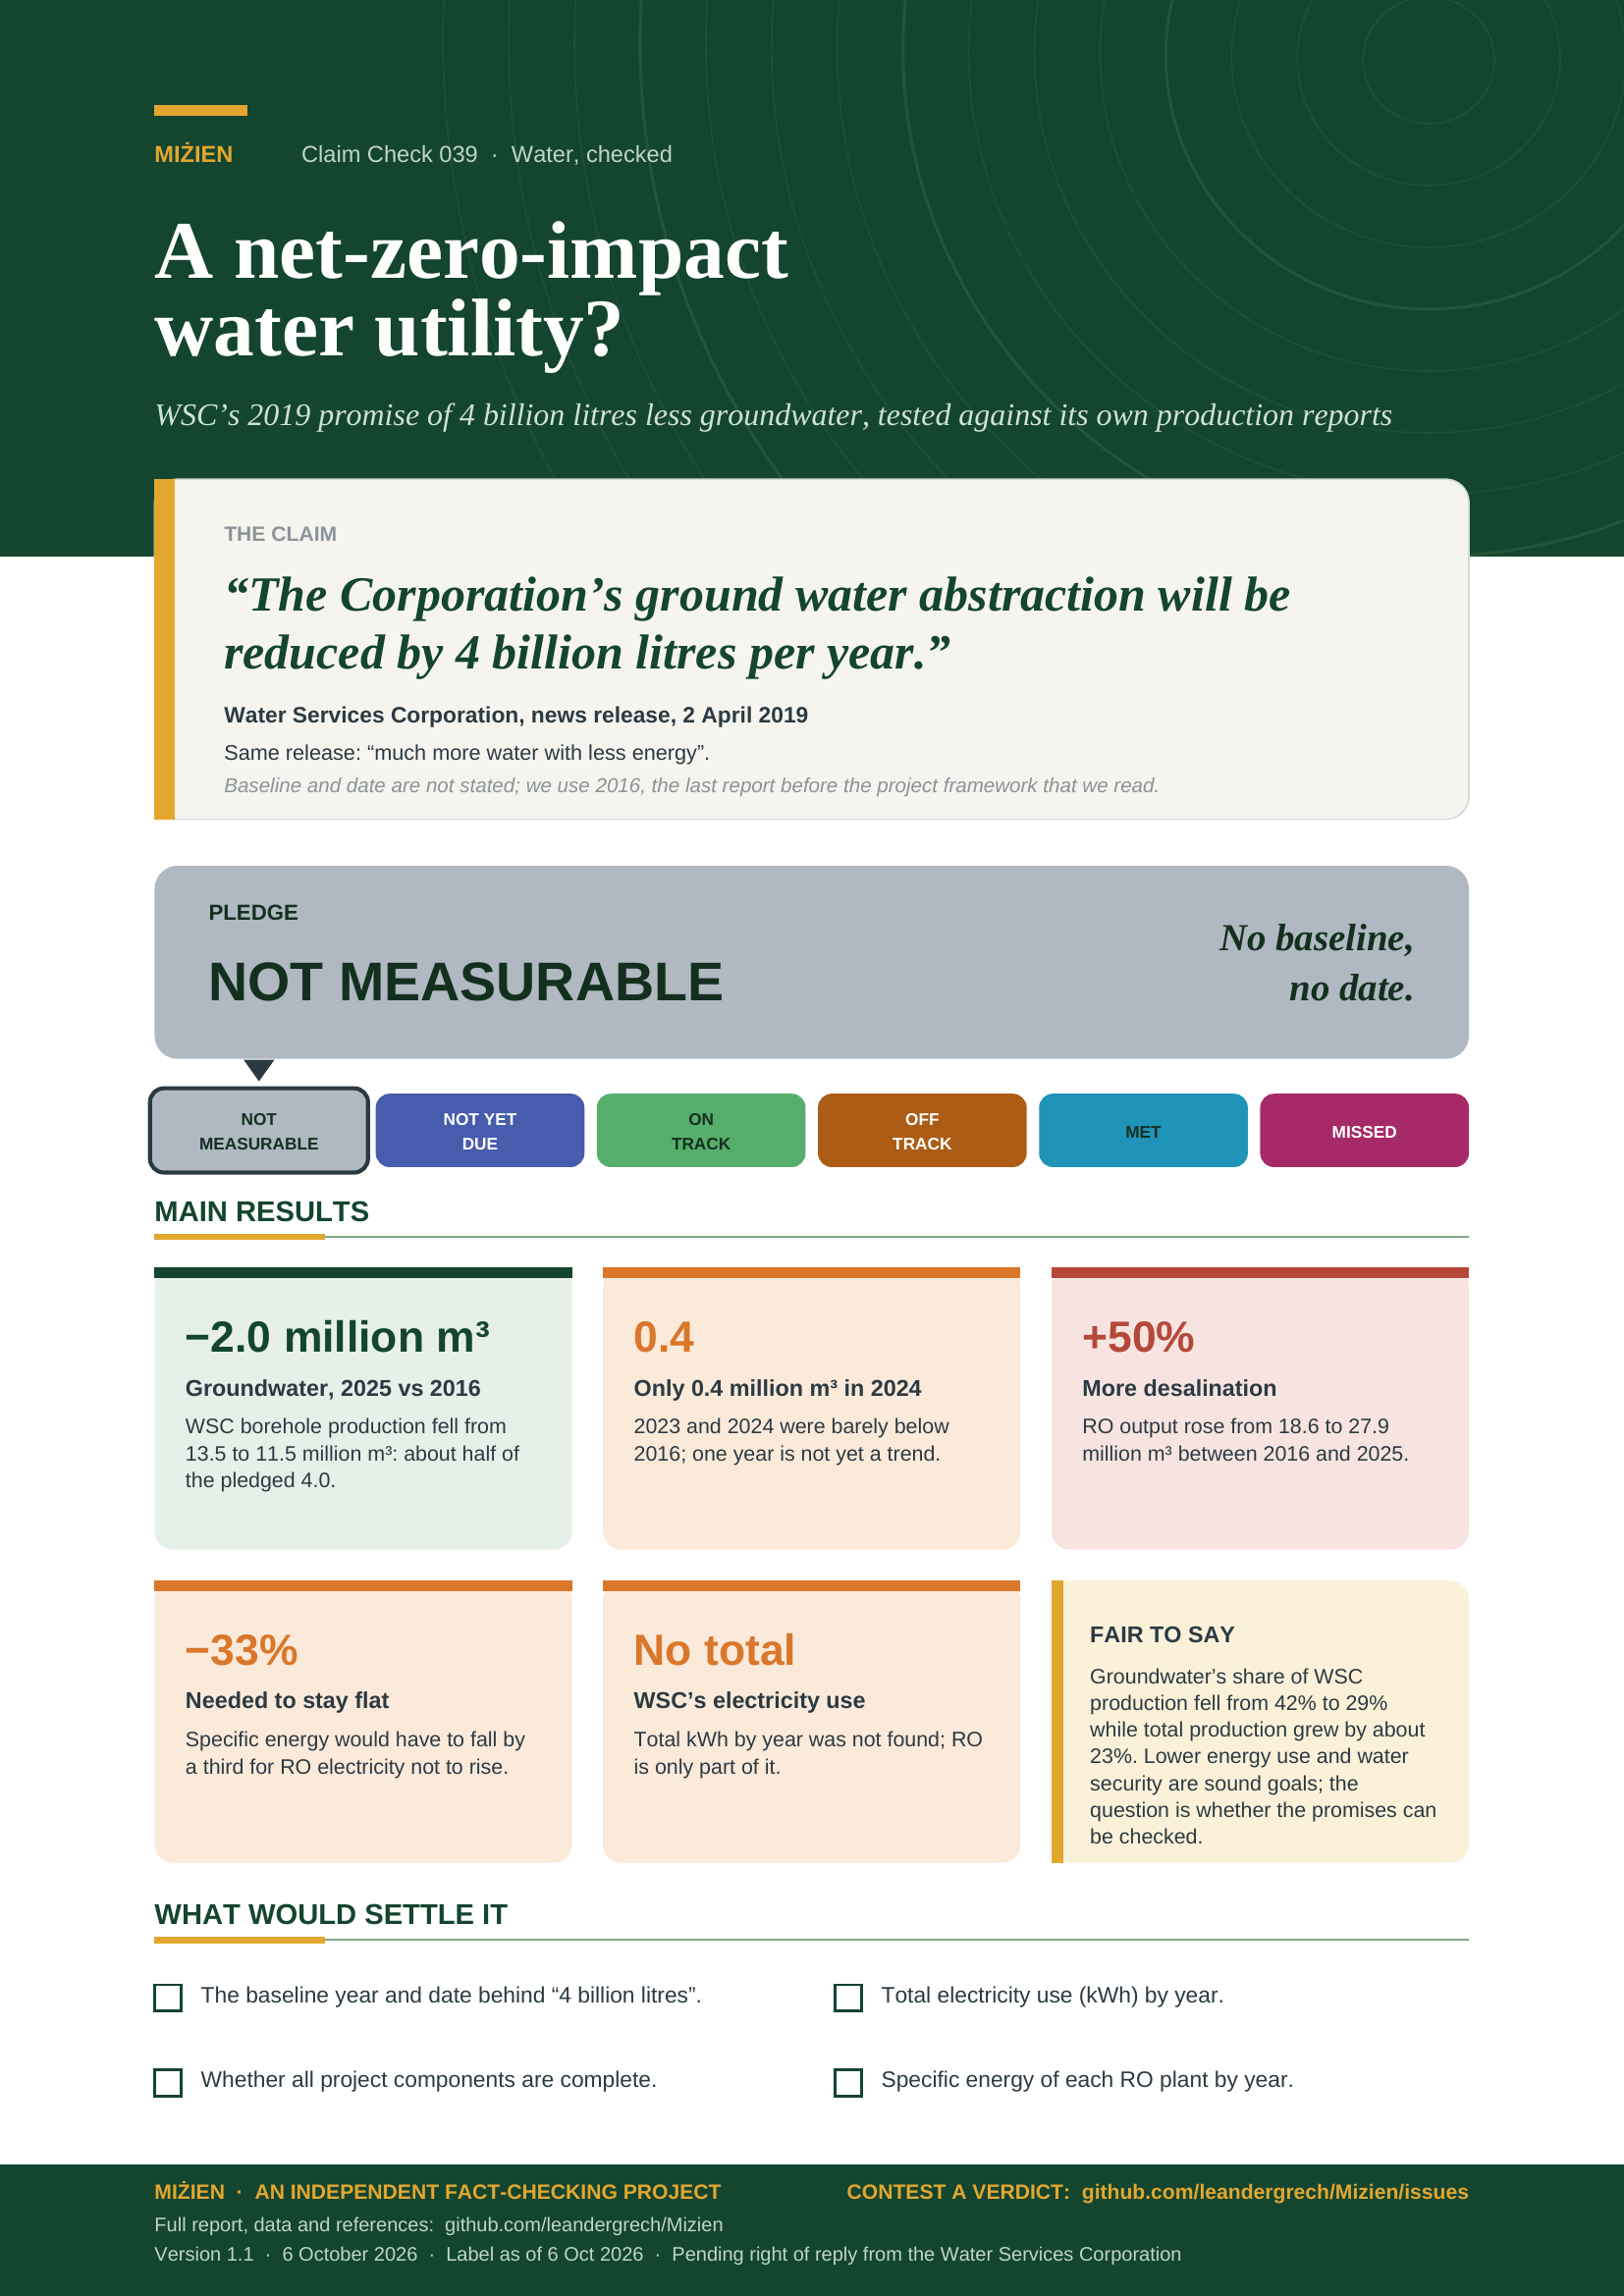
Pledge: Not measurable as of 6 October 2026 Draft: right of reply pending
The pledge
Not measurable as of 6 October 2026
Not measurable: the pledge as worded has no definition, baseline or date against which delivery could be checked.
No baseline year, date or boundary stated. Against 2016, WSC groundwater production was 2.0 million m3 lower in 2025 (about half of 4.0) but only 0.4 million m3 lower in 2024 (0.3 in 2023); RO output rose about 50%.
- Target
- Groundwater abstraction reduced by 4 billion litres a year; more water with less energy
- Made by
- Water Services Corporation
- Made in
- WSC news release, European Commission endorses the Net Zero Impact Utility project (2 April 2019)
- Deadline
- none stated
All pledges and how they are labelled · See it on the pledges timeline
Parts of this claim
The claim is split into parts that are tested separately, as in the report below. Each part has its own number.
- CC-039A Groundwater abstraction “will be reduced by 4 billion litres per year” (WSC [1])No baseline year or date. Against 2016, WSC groundwater production is lower by 0.3–2.0 million m³ in 2022–25 (9–49% of 4.0), lowest in 2025.
- CC-039B Desalination produces “much more water with less energy” (WSC [1])More water: RO output +50% since 2016. Less energy per m³: whole-utility energy per m³ produced 4.68 (2022) to 4.60 (2024) kWh/m³ [8], a 1.7% fall; RO plant figures by year not found; RO electricity likely higher in total.
- CC-039C Extra production without increasing the utility’s overall net power requirements (WSC framework, as described in [3])RO alone would need a third lower specific energy to stay flat. Whole-utility kWh not published; intensity 4.68 to 4.60 kWh/m³ (2022–24) while production rose 9%, so total energy likely up [8].
Claim Check 039 · Water, checked
A net-zero-impact water utility?
Testing WSC’s promise of 4 billion litres less groundwater and less energy per litre
“The Corporation’s ground water abstraction will be reduced by 4 billion litres per year.”
Water Services Corporation, news release, 2 April 2019.
Same release: desalination upgrades mean “much more water with less energy”.
Verdict: Not measurable As of 6 Oct 2026: no baseline, date or boundary stated
Version 1.1 · 6 October 2026
TL;DR
In a statement of 2 April 2019 [1], the Water Services Corporation (WSC) said that the EU part-financed Net Zero Impact Utility project would cut its groundwater abstraction “by 4 billion litres per year” and produce “much more water with less energy”. The project’s framework has also been described as letting extra production be met “without increasing the overall net power requirements” of the utility [3]. We tested these statements against WSC’s own production reports and Eurostat.
- The groundwater pledge has no baseline and no date. 4 billion litres is 4.0 million m³, about 30% of the 13.5 million m³ WSC took from boreholes in 2016 [4]. WSC does not say from which year, or by when.
- Measured against 2016, the cut so far is real but partial. WSC groundwater production was 11.5 million m³ in 2025 [6], 2.0 million m³ below 2016: about half the pledged amount. In 2023 and 2024 it was only 0.3–0.4 million m³ below. Eurostat’s public-supply series is 1.0–1.2 million m³ lower in 2024 than in 2018–19 [7].
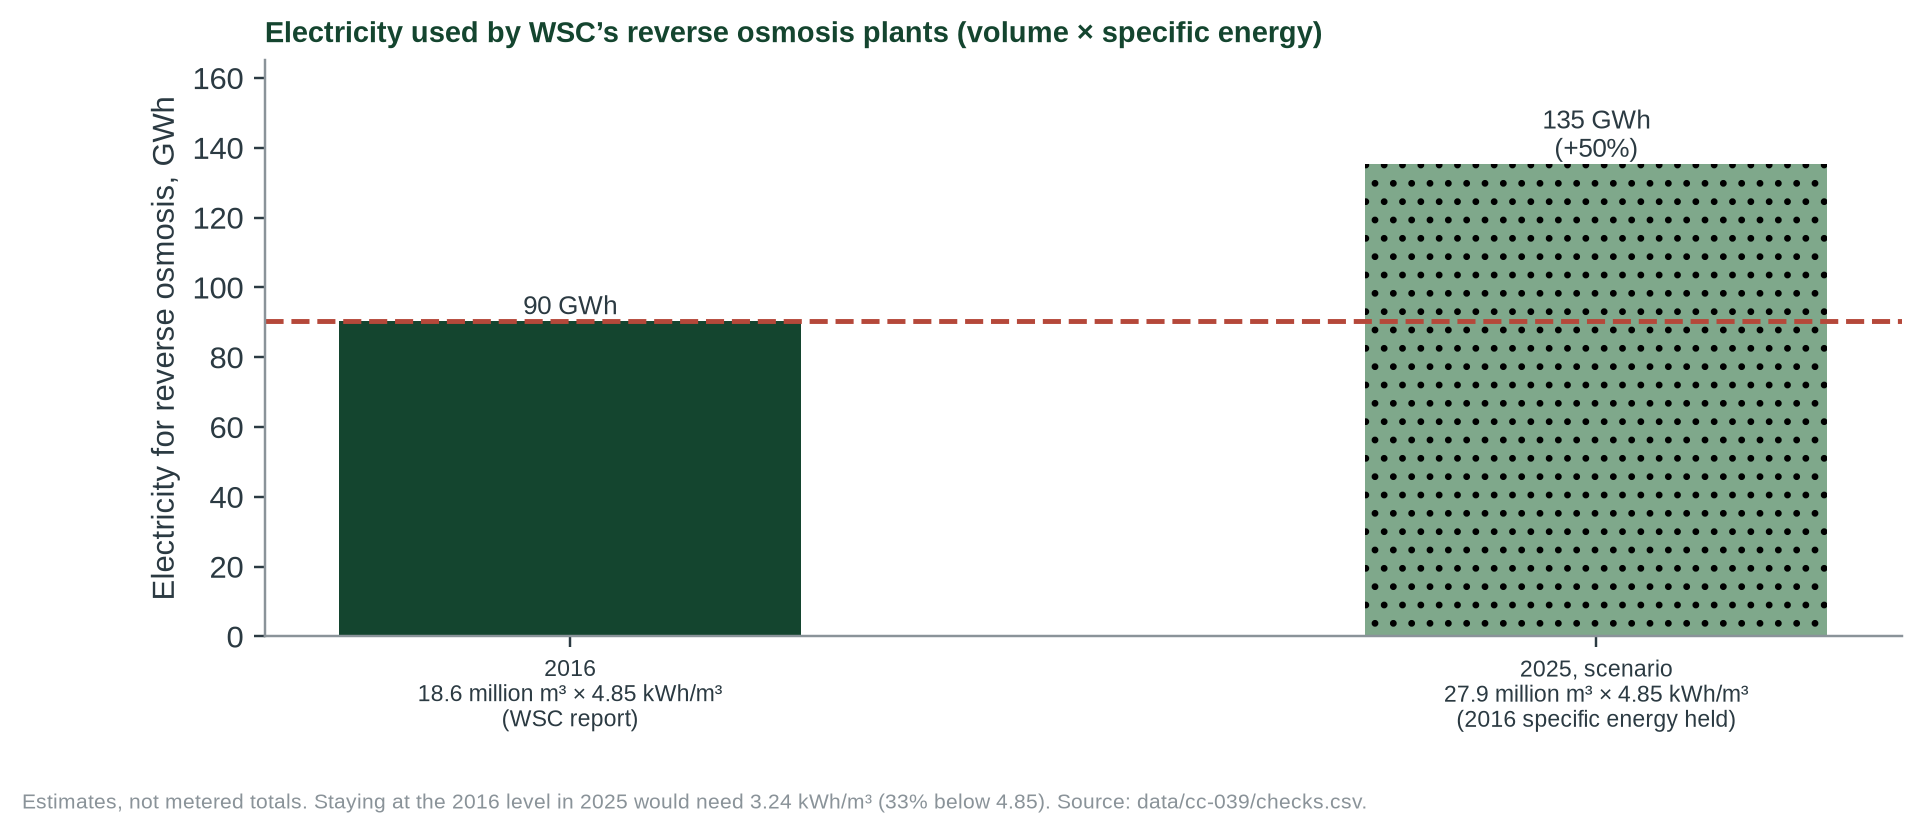
- More water now comes from desalination, which costs energy. Reverse-osmosis output rose about 50% between 2016 and 2025 (18.6 to 27.9 million m³) [4, 6]. At the 2016 specific energy that is about 45 GWh more electricity a year; to stand still, specific energy would have to fall by a third.
- Pledge label: not measurable (as of 6 October 2026). Neither promise states a baseline, boundary or date, and WSC’s total electricity use by year was not found. That is a gap in what WSC published, not a finding of failure.
- Not measurable
- Not yet due
- On track
- Off track
- Met
- Missed
What would make it measurable or on track
A stated baseline year and completion date for the 4 billion litre cut, and WSC’s total electricity use (kWh) by year on a stated boundary, showing it flat or falling while production rose.
What would count against it
WSC’s own series showing groundwater production back near 13 million m³ with the project complete, or metered electricity use rising with production.
IN THIS REPORT
1 The statements and their sources
Our candidate record combined several statements from different documents. We read two WSC pages (through the Internet Archive, because wsc.com.mt shows a bot challenge to scripts) and a peer-reviewed overview by an Energy and Water Agency author, and separate what each says.
| Source | Wording | Status |
|---|---|---|
| WSC news release, 2 April 2019 [1] | “The Corporation’s ground water abstraction will be reduced by 4 billion litres per year.” Also: the capacity and efficiency of the desalination plants “are being upgraded thereby producing much more water with less energy”. | Primary wording (verbatim) |
| WSC project page, 16 April 2018 [2] | Describes the project’s components (more efficient RO plants, many more remotely monitored boreholes “rested” as needed, a new RO plant at Ħondoq, a tunnel from Pembroke to Ta’ Qali). Says the tunnel will save “approximately 3.5 Giga Watts of energy” (sic) and about 1,800 t of CO₂ a year. No groundwater volume. | Primary; context |
| Sapiano (Energy and Water Agency), Acque Sotterranee 2020, p. 30 [3] | Describes WSC’s “Net-Zero Impact” framework (citing WSC 2018, which we did not read): it aims to “enable any increased production to address water demand to be met without increasing the overall net power requirements of the water utility”. | Second-hand description of WSC’s aim |
2 Method
Question. Is there evidence that WSC’s groundwater abstraction has fallen by 4 billion litres a year, and that it produces more water without more energy? Can either promise be checked as worded?
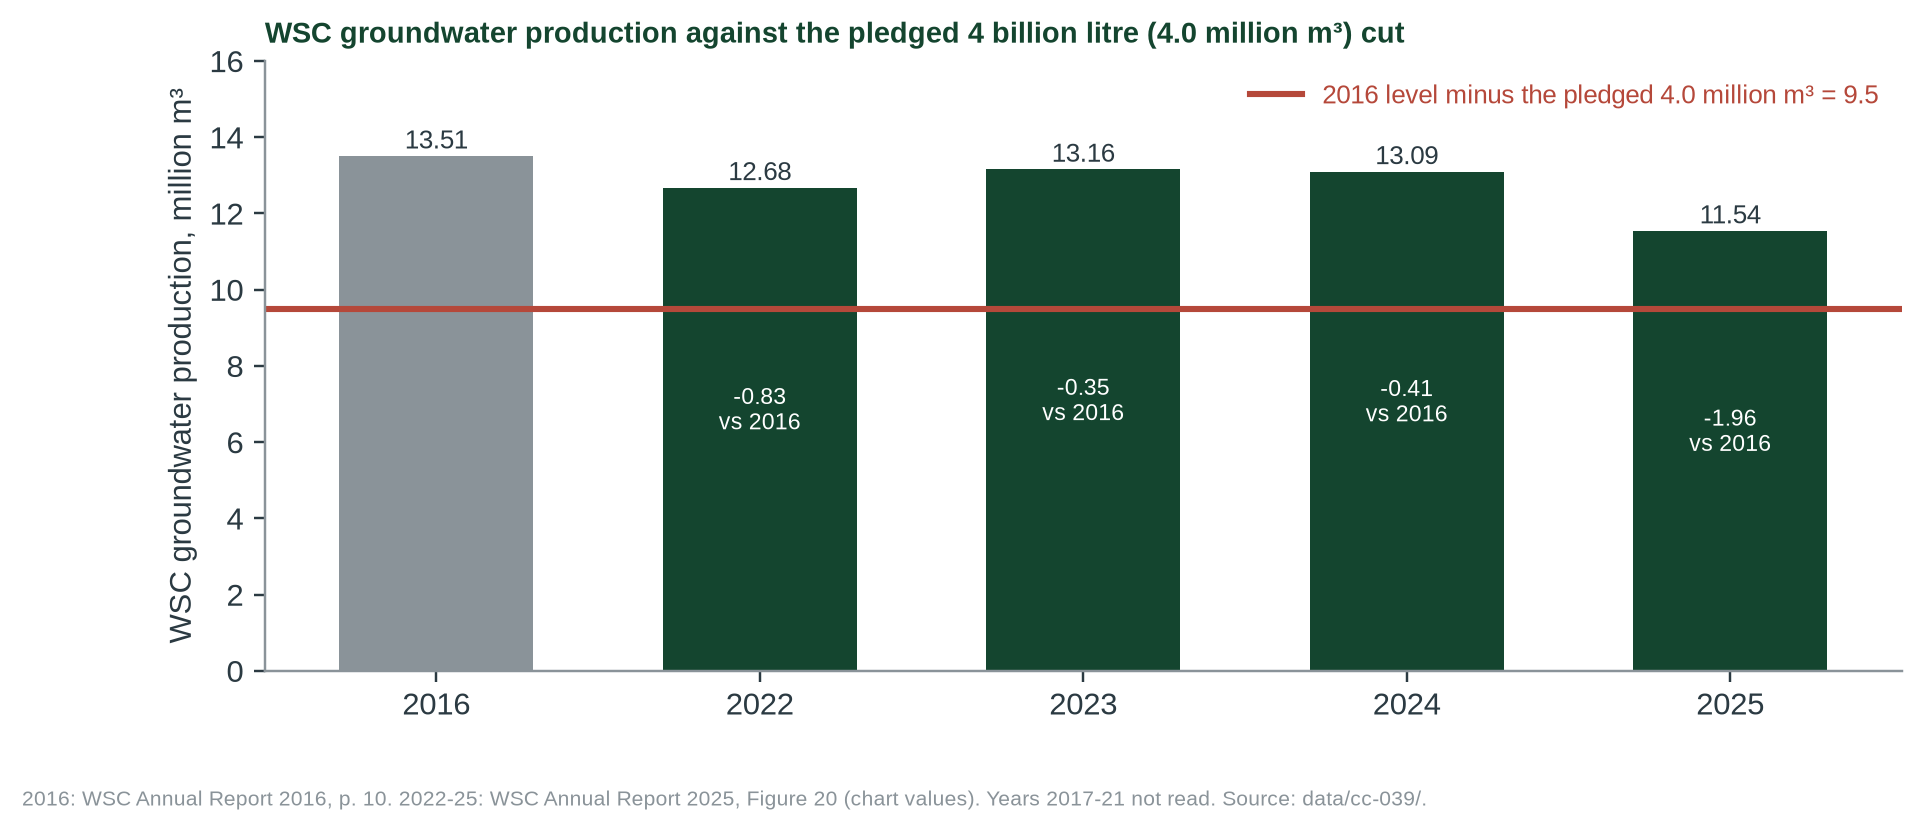
Groundwater. 4 billion litres = 4.0 million m³ (1 m³ = 1,000 litres). We compare it with WSC’s reported groundwater production: 2016 from WSC’s 2016 annual report [4] (the last report before the project framework that we read), and 2022–2025 from the 2025 report’s production chart [6], transcribed for Claim Check 009 (WSC’s 2022 report gives about 12.7 million m³ for 2022 [5], the same). We also use Eurostat’s public-supply groundwater abstraction for 2018, 2019 and 2024 [7] (estimated values, a different measure that runs about 1 million m³ above WSC’s own series). Years 2017–2021 were not read.
Energy. WSC’s 2016 report gives the specific power of its RO plants (4.85 kWh/m³) [4]. We multiply volume by specific energy for 2016, and for 2025 show a scenario holding the 2016 specific energy, and the level (3.24 kWh/m³) that would keep RO electricity flat. WSC’s Impact and Allocation Report for 2024 [8] gives a whole-utility energy figure per cubic metre produced for 2022–2024 (read first-hand, the relevant pages); we found no total kWh for the whole utility. WSC’s Annual Report 2024 could not be opened. Code: tools/cc-039-report/calc.py; results in data/cc-039/checks.csv.
Grades. WSC’s annual reports are self-reported company documents (C); Eurostat figures are official statistics, flagged as estimates (C); our arithmetic is an order-of-magnitude check and is labelled as such.
3 Groundwater: what the data show
| Measure | Baseline | Latest | Change | Share of the 4.0 pledged |
|---|---|---|---|---|
| WSC groundwater production, 2016 → 2025 [4, 6] | 13.51 | 11.54 | −1.96 | 49% |
| WSC groundwater production, 2016 → 2024 [4, 6] | 13.51 | 13.09 | −0.41 | 10% |
| Eurostat public supply, 2018 → 2024 [7] | 15.24 | 14.28 | −0.96 | 24% |
| Eurostat public supply, 2019 → 2024 [7] | 15.52 | 14.28 | −1.24 | 31% |
All volumes in million m³. A full 4.0 million m³ cut from the 2016 level would leave 9.5 million m³; no year we read is near that.
Fairness to WSC
- Its groundwater share of production fell from 42% (2016) to 29% (2025) while total production grew by about 23% (32.1 to 39.5 million m³) [4, 6]. Put against demand growth, the groundwater cut is larger than the raw change suggests.
- WSC’s 2022 report describes reactivating eight boreholes or pumping sources by 2022 to spread abstraction (to relieve local pressure) [5]. Spreading abstraction is a quality aim; it does not by itself reduce volume.
- The 2019 statement gave no baseline or date; we chose 2016 as a published pre-project reference and other choices move the result.
4 Energy: what the data show
| Input or result | Value | Source |
|---|---|---|
| RO output 2016 → 2025 | 18.6 → 27.9 million m³ (+50%) | WSC AR 2016, AR 2025 [4, 6] |
| RO specific energy 2016 | 4.85 kWh/m³ | WSC AR 2016 [4] |
| RO electricity 2016 (estimate) | 90 GWh | calculated |
| Specific energy for flat RO electricity in 2025 | 3.24 kWh/m³ (−33%) | calculated |
| WSC energy per m³ produced, whole utility, 2022 → 2023 → 2024 | 4.68 → 4.52 → 4.60 kWh/m³ | WSC Impact and Allocation Report FY2024, p. 13 [8] |
| Implied total energy 2022 → 2024 (indicative) | 166 → 179 GWh (+7%) | calculated; boundary unverified |
| Electricity bill 2016, RO plants’ share | €10.1M of €16.6M (61%) | WSC AR 2016, note 2 [4] |
| Ħondoq RO plant vs conventional plants | 23.5% less energy | WSC AR 2022 [5] |
| Ħondoq RO specific energy 2024 | 3.11 kWh/m³ (2021 baseline 4.1) | WSC Impact and Allocation Report FY2024, pp. 24, 28 [8] |
The whole-utility figure is WSC’s “Total Energy Requirement per m³ produced”; the report does not define its boundary, so it is not comparable with the 2016 RO figure (4.85 kWh/m³). Implied total = intensity × production (groundwater + RO, WSC AR 2025 Fig 20), assuming “produced” means that production.
What the energy data mean
- “Much more water with less energy” can be read per cubic metre. On that reading, the only like-for-like series we have is WSC’s whole-utility energy per m³ produced, 4.68 (2022), 4.52 (2023), 4.60 (2024) kWh/m³ [8]: a small fall that is not steady, and not comparable with 2016’s RO-only 4.85. The Ħondoq plant, which WSC says uses 23.5% less energy than conventional plants [5], serves a small share of output (5.0% of RO water in 2022 [5]).
- “Without increasing the overall net power requirements” is a total, not a per-unit, claim. RO output grew by half; a fall of a third in specific energy would be needed to keep RO electricity flat. The figures we have point the other way: WSC’s whole-utility intensity barely moved from 2022 to 2024 while production rose 9%, which implies more total energy (indicative; boundary not defined in [8]). WSC’s own 2022 report says its expenditure rose by about €2 million in energy consumed, which it ties to “a strategic decision to improve potable water quality by increasing the production from its reverse osmosis plants” [5].
- The offsetting savings WSC cites are small. The Pembroke–Ta’ Qali tunnel is said to save about 3.5 GWh a year (WSC writes “Giga Watts”) [2], against an RO increase of tens of GWh. WSC’s figure is its own estimate.
- We could not test the whole utility. Groundwater pumping, sewage treatment and distribution energy, and any renewable generation, are outside our RO estimate, and no total kWh by year was found.
5 Testing the statements
| Sub-claim | Said by | What the evidence shows | Rating |
|---|---|---|---|
| A. Groundwater abstraction “will be reduced by 4 billion litres per year” | WSC [1] | No baseline year or date. Against 2016, WSC groundwater production is lower by 0.3–2.0 million m³ in 2022–25 (9–49% of 4.0), lowest in 2025. | NO BASELINE OR DATE |
| B. Desalination produces “much more water with less energy” | WSC [1] | More water: RO output +50% since 2016. Less energy per m³: whole-utility energy per m³ produced 4.68 (2022) to 4.60 (2024) kWh/m³ [8], a 1.7% fall; RO plant figures by year not found; RO electricity likely higher in total. | MIXED |
| C. Extra production without increasing the utility’s overall net power requirements | WSC framework, as described in [3] | RO alone would need a third lower specific energy to stay flat. Whole-utility kWh not published; intensity 4.68 to 4.60 kWh/m³ (2022–24) while production rose 9%, so total energy likely up [8]. | NOT TESTABLE AS WORDED |
6 Pledge label and requests for evidence
As of 6 October 2026. No baseline, date or boundary stated; indicators move the right way for groundwater and the wrong way for RO energy.
Why. Both promises are statements of intended outcome. The groundwater promise names an amount but no starting year and no completion date; the energy promise names no baseline, boundary or date. A pledge is not a statement of fact, so we do not call it false. As worded it cannot be shown to have been met or missed, so we label it Not measurable (Appendix A lists the six pledge labels). Our indicative figures are given so readers can see where the data point.
What this label does not say. It does not say the project failed, that WSC’s figures are wrong, or that the aim is undesirable. Water security and lower energy intensity are sound goals. A checkable version would read: “Compared with [year], WSC’s groundwater production will fall by 4.0 million m³ a year by [date], while its total electricity use stays at or below [X] GWh.”
Evidence we are asking for
- From WSC: the baseline year and completion date behind “4 billion litres per year”, and annual groundwater abstraction by source since 2014.
- From WSC: total electricity consumption (kWh) by year, split by RO, groundwater pumping, distribution and sewage treatment, and the boundary of “net zero” impact on energy.
- From WSC: whether all components of the Net Zero Impact Utility project are complete, and the 2018 framework document that Sapiano [3] cites.
- From WSC: the specific energy of each RO plant by year, and the boundary of the “Total Energy Requirement” indicator.
7 Limitations
- WSC’s 2016 and 2025 production series come from different reports; we did not verify that definitions match (WSC’s 2022 report agrees with the 2025 report for 2022). Years 2017–2021 were not read.
- The 2025 values are read from a chart and carry the small internal differences recorded for Claim Check 009.
- WSC’s Annual Report 2024 could not be opened (parlament.mt refuses scripts; no archive copy found). Its Impact and Allocation Report for 2024 [8] was read (relevant pages) and gives the energy figures used. A search-engine summary had given 4.68 kWh/m³ as an RO figure for 2024; the report shows it is the whole-utility figure for 2022, so it is not used.
- The RO electricity estimates are volume times specific energy, not metered totals.
- We did not establish which project components were complete, or when. The live wsc.com.mt pages show a bot challenge to scripts; both WSC pages were read in Wayback copies of 2024.
- Sapiano’s description of the framework cites a WSC 2018 document that we did not read.
References
- [1] Water Services Corporation (2 April 2019). European Commission Endorses WSC’s ‘Net Zero-Impact’ Utility Project. News release. (Read in the Internet Archive copy of 10 Sep 2024.) https://www.wsc.com.mt/european-commission-endorses-wscs-net-zero-impact-utility-project/
- [2] Water Services Corporation (16 April 2018). Towards a Net Zero-Impact Utility: new €100 Million EU-funded project set to improve water quality to all-new highs. (Read in the Internet Archive.) https://www.wsc.com.mt/towards-a-net-zero-impact-utility-new-e100-million-eu-funded-project-set-to-improve-water-quality-to-all-new-highs/
- [3] Sapiano M. (2020). Integrated Water Resources Management in the Maltese Islands. Acque Sotterranee – Italian Journal of Groundwater 9(3):25–32. doi:10.7343/as-2020-477. (Full text read; open access.) https://doi.org/10.7343/as-2020-477
- [4] Water Services Corporation (2017). Annual Report 2016, pp. 9–10 and note 2. (Read in the Internet Archive copy.) https://www.wsc.com.mt/wp-content/uploads/2018/03/Annual_Report_-_16.pdf
- [5] Water Services Corporation (2023). Annual Report 2022, pp. 13–14 and 28. (Read in the Internet Archive copy.) https://www.wsc.com.mt/wp-content/uploads/2023/06/WSC-Annual-Report-2022.pdf
- [6] Water Services Corporation. Annual Report 2025, Figure 20 (groundwater and RO production, 2022–2025), as transcribed for Claim Check 009. Supplied by the maintainer; this site could not open it. https://parlament.mt/media/139352/wsc-annual-report-2025.pdf
- [7] Eurostat. Water abstraction by source and sector (env_wat_abs), Malta, fresh groundwater; updated 16 Sep 2026, retrieved 5 Oct 2026. Values flagged ‘e’ (estimated). https://ec.europa.eu/eurostat/databrowser/view/env_wat_abs/default/table
- [8] Water Services Corporation. Impact and Allocation Report, Financial Year 2024 (Green Bond report), pp. 13, 24, 28. Relevant pages read 6 Oct 2026; self-reported. https://www.wsc.com.mt/wp-content/uploads/2025/04/Impact-and-Allocation-Report-24.pdf
- [9] MiŻien. Analysis code and outputs: tools/cc-039-report/; data/cc-039/.
Appendix A: series standards and verdict scale
Every investigation in this series follows the same rules so that verdicts are comparable and challengeable.
| Verdict | Meaning |
|---|---|
| SUPPORTED | Evidence consistently backs the claim as stated. |
| LARGELY SUPPORTED | Backed by the evidence, with minor caveats that do not change the substance. |
| NOT SUBSTANTIATED | Stated more strongly than the evidence offered or available allows. May be true in some conditions but has not been shown. |
| MISLEADING | Omits material facts so that the overall impression is inaccurate, even if individual statements are defensible. |
| CONTRADICTED | The available evidence points against the claim. |
Pledge labels
A pledge is a promise of future action, so it cannot be true or false when it is made. It gets one of these labels instead of a verdict, with the date of the evidence behind it.
| Pledge label | Meaning |
|---|---|
| NOT MEASURABLE | The pledge as worded has no definition, baseline or date against which delivery could be checked. |
| NOT YET DUE | Measurable; the deadline or term has not passed and no progress data have been published yet. |
| ON TRACK | Published progress is at or ahead of a straight-line path (or the pledge's own milestones) to the target by the deadline. |
| OFF TRACK | Published progress is behind that path, and the target has not yet been shown to be met or missed. |
| MET | Documents or data show the target was reached, by the deadline if one was set. |
| MISSED | The deadline or term has passed, and documents or data that can be shown say the target was not reached. |
Confidence
High: multiple independent lines of evidence agree. Moderate: evidence is relevant but incomplete or indirect. Low: evidence is thin, second-hand or conflicting.
Evidence grades
A experiment · B observational study with a control or gradient · C review, guidance or official statistics · D assertion or anecdote. WSC annual reports are self-reported (C); our own arithmetic is an order-of-magnitude estimate.
Standards
- Quote the speaker, not the headline, with outlet and date, and link the original where possible.
- Separate the claim from the evidence offered for it, and say who made which statement.
- Grade the evidence and show differing views side by side where the evidence is unsettled.
- State what we could not access or verify, and what would change the verdict either way.
- Ask for the missing evidence in specific, answerable requests.
- Offer a right of reply where a check finds a claim Not substantiated, Misleading or Contradicted (or a pledge Not measurable, Off track or Missed), before wider circulation, and append responses.
- Correct errors openly with a version number and change log.
- Whistle-blow only on evidence: a verdict of Misleading or Contradicted requires documents or data that can be shown, not inference.
- Check every side. Government, opposition, NGOs and developers are held to the same standard.
Appendix B: revision log
| Version | Date | Change |
|---|---|---|
| 1.0 | 5 Oct 2026 | First issue. Pledge label: not measurable. Groundwater: no baseline or date; against 2016, WSC production was 2.0 million m³ lower in 2025 (49% of the pledged 4.0). Energy: RO output up 50% since 2016; WSC’s total electricity use not found. Draft pending right of reply from the Water Services Corporation. |
| 1.1 | 6 Oct 2026 | Corrections after audit: sub-claim A range restated as 0.3–2.0 million m³ (9–49% of 4.0), matching the data. The 4.68 kWh/m³ figure, taken from a search summary, was replaced by figures read in WSC’s Impact and Allocation Report 2024 (4.68 is the whole-utility figure for 2022, not an RO figure for 2024); the RO 2024 bar was removed. 2016 baseline wording, WSC page date (16 Apr 2018) and Sapiano page citation checked. Label unchanged. Pending right of reply. |
Sources and archived copies
-
Towards a Net Zero-Impact Utility, Water Services Corporation, 2018-04-16.
Original · fetched and fingerprinted 2026-10-10; no public snapshot yet
Project launch page, posted 16 Apr 2018 (date read on the Wayback copy; no groundwater volume). Read in the Wayback copy; wsc.com.mt shows a bot challenge to scripts. -
European Commission Endorses WSC's 'Net Zero-Impact' Utility Project, Water Services Corporation, 2019-04-02.
Original · Archived copy
Primary wording of the 4 billion litre statement. Read in the Wayback copy of 10 Sep 2024. -
Integrated Water Resources Management in the Maltese Islands (Sapiano 2020, p. 30), Acque Sotterranee 9(3), 2020.
Original · fetched and fingerprinted 2026-10-10; no public snapshot yet
Describes the framework's energy aim (second-hand description of WSC 2018). Pages 25-32 and p. 30 checked against the open-access PDF.
Right of reply
Not applicable until a draft verdict exists.
Connections
How this claim relates to the others: who made it, the themes it shares with other claims, and the patterns it shows. A connection is a reason to read two checks side by side. It does not make either one right or wrong. How connections are found.
Who made it
Other claims by Water Services Corporation 3
Linked directly 3
Claims that share a theme with this one. A theme is a cause, a mechanism, a target or a way of presenting figures that the editors have found in several claims; its strength says how close the link is.
Water chain: farm waste, sewage, sea, aquifer Shared cause · Weak (indicative)
The Commission blames farm waste in the sewers for poor treatment; agricultural nitrates are behind groundwater failure. Treated water also feeds 'new water' irrigation.
Same pattern
Pattern tags name a recurring way a claim can mislead. They describe the statement, not the speaker.
Promise-without-baseline
A target or pledge with no stated starting point, scope or counting basis.
- CC-008 Flyovers and congestion (Not substantiated)
- CC-010 Tree-planting counts (Largely supported)
- CC-011 Ten minutes' walk to green space (pledge: Not measurable)
- CC-012 Ta' Qali gravel and grass (Contradicted)
- CC-017 Land reclamation outside the Freeport (Not substantiated)
- CC-021 Malta-Gozo tunnel traffic (not yet checked)
- CC-029 First offshore wind farm (Largely supported)
- CC-030 Carbon-neutral airport (Not substantiated)
- CC-031 Gozo, first climate-neutral region (Largely supported)
- CC-055 Manoel Island back to the public (Supported)
- CC-079 Waste-to-energy: 4.5% of energy (Misleading)
- CC-092 PN: afforestation in a net-zero Gozo (pledge: Not measurable)
- CC-107 A net-zero Gozo by 2040 (pledge: Not measurable)
- CC-108 Net-zero impact on the groundwater environment (pledge: Not measurable)
- CC-125 EU: Malta Social Climate Plan EUR 60.6 million (not yet checked)
Two steps away 6
Not linked to this claim directly, but linked to a claim that is. These are found by following the links, not chosen by the editors, so they are looser: they show where one theme meets another.
- CC-005 “92% excellent” bathing water (Supported)through Water chain: farm waste, sewage, sea, aquiferCC-009Water chain: farm waste, sewage, sea, aquifer
- CC-047 Nitrates in the aquifer (Largely supported)through Water chain: farm waste, sewage, sea, aquiferCC-009Water chain: farm waste, sewage, sea, aquifer or Water chain: farm waste, sewage, sea, aquiferCC-101Water chain: farm waste, sewage, sea, aquifer
- CC-117 EU: Malta missed recycling targets (reasoned opinion) (not yet checked)through Water chain: farm waste, sewage, sea, aquiferCC-101EU findings of unmet obligations
- CC-118 Council: Malta second-highest water stress, groundwater failing (Largely supported)through Water chain: farm waste, sewage, sea, aquiferCC-009Water chain: farm waste, sewage, sea, aquifer or Water chain: farm waste, sewage, sea, aquiferCC-101Water chain: farm waste, sewage, sea, aquifer
- CC-128 EU: Malta missed the water-plan timetable (not yet checked)through Water chain: farm waste, sewage, sea, aquiferCC-101EU findings of unmet obligations
- CC-129 EU: Malta has not updated its air pollution programme (not yet checked)through Water chain: farm waste, sewage, sea, aquiferCC-101EU findings of unmet obligations
Three steps away 6
One step further again. At this distance a connection says more about how the themes fit together than about this claim.
- CC-004 'Strong progress' in waste separation (Not substantiated)through Water chain: farm waste, sewage, sea, aquiferCC-101EU findings of unmet obligationsCC-117Waste and construction
- CC-041 Sewage plants compliant by 2026 (not yet checked)through Water chain: farm waste, sewage, sea, aquiferCC-009Water chain: farm waste, sewage, sea, aquiferCC-005Water chain: farm waste, sewage, sea, aquifer
- CC-042 'From Blue Flag to Red Alert' (Largely supported)through Water chain: farm waste, sewage, sea, aquiferCC-009Water chain: farm waste, sewage, sea, aquiferCC-005Water chain: farm waste, sewage, sea, aquifer
- CC-043 13 Blue Flag beaches (not yet checked)through Water chain: farm waste, sewage, sea, aquiferCC-009Water chain: farm waste, sewage, sea, aquiferCC-005Water chain: farm waste, sewage, sea, aquifer
- CC-081 Landfill share rising (not yet checked)through Water chain: farm waste, sewage, sea, aquiferCC-101EU findings of unmet obligationsCC-117Waste and construction
- CC-111 EU: 621 kg of waste a head, 74% landfilled (Supported)through Water chain: farm waste, sewage, sea, aquiferCC-101EU findings of unmet obligationsCC-117Waste and construction
Similar wording
Claims whose own words overlap with this one, with the words they share. Found by comparing the wording of the claims, not their verdicts; a lead to read them together, not a finding.
- CC-108 Net-zero impact on the groundwater environment (pledge: Not measurable)shares: corporation, abstraction, net
- CC-101 EU: no registration or prior authorisation of water abstraction in Malta (Largely supported)shares: abstraction, impact, water
Timeline
What was said, what was published before and after it, and each step of this check, in date order. Statements and sources carry the date they were published. The steps of the check carry the date the research was done, from the check's research log. Other statements by the same body on the same topic show whether a position was repeated, changed or corrected.
2017
- 2017 Evidence published WSC Annual Report 2016, Water Services Corporation
2019
- 2 April 2019 The statement Water Services Corporation (WSC) (this claim)
- 2 April 2019 Statement published European Commission Endorses WSC's 'Net Zero-Impact' Utility Project, Water Services Corporation
2020
- 2020 Evidence published Integrated Water Resources Management in the Maltese Islands (Sapiano), Acque Sotterranee
2023
- 2023 Evidence published WSC Annual Report 2022, Water Services Corporation
2024
- 2024 Later statement by Water Services Corporation on Water CC-041 Sewage plants compliant by 2026 (not yet checked)
2026
- 25 August 2026 Later statement by Water Services Corporation on Water CC-009 More RO, less WSC groundwater (Largely supported)
- 16 September 2026 Evidence published Water abstraction by source and sector (env_wat_abs), Eurostat
- 4 October 2026 Added to the claims to check
- 5 October 2026 Check started Candidate taken by worker C; the live WSC site shows a bot challenge, so its pages were read via the Internet Archive.
- 5 October 2026 Exact wording found Verbatim wording found in WSC's news release of 2 Apr 2019 (Wayback copy of 10 Sep 2024); energy aim read in Sapiano 2020, p. 30.
- 5 October 2026 Note WSC Annual Reports 2016 and 2022 read (Wayback); 2022-25 series from the 2025 report as transcribed for CC-009; Eurostat env_wat_abs; calculations in tools/cc-039-report/calc.py.
- 5 October 2026 Version 1.0: first issue First issue. Pledge label: not measurable. Draft pending right of reply.
- 6 October 2026 Note WSC Annual Report 2024 could not be obtained (parlament.mt 403; no Wayback copy). WSC's Impact and Allocation Report FY2024 (wsc.com.mt, Apr 2025) was read instead: p. 13 whole-utility 'Total Energy Requirement per m3 produced' 4.68 (2022 baseline), 4.52 (2023), 4.60 (2024); pp. 24 and 28 Hondoq 3.11 kWh/m3 (2024). The earlier search summary had misattributed 4.68 as a 2024 RO figure. Wayback copy of the 2018 project page shows 'Posted on April 16, 2018'. Sapiano 2020 PDF header pages 25-32; the net-power passage is on p. 30.
- 6 October 2026 Version 1.1 1.1: corrections after the 6 Oct 2026 audit: sub-claim A range, second-hand energy inputs replaced by first-hand figures, baseline wording, source date, Sapiano pages. Label unchanged (Not measurable). Pending right of reply.
- 6 October 2026 Evidence reviewed
- 6 October 2026 Pledge label: Not measurable Groundwater abstraction reduced by 4 billion litres a year; more water with less energy
- 6 October 2026 Correction Sub-claim A range corrected to 0.3-2.0 million m3 (9-49% of 4.0) to match data/cc-039/checks.csv (2023: 0.348, 8.7%). Removed the second-hand 4.68 kWh/m3 'RO 2024' figure and the +33% RO electricity bar; replaced by first-hand whole-utility figures from the Impact and Allocation Report 2024. Ratings and label unchanged. all corrections
- 6 October 2026 Clarification Baseline wording now 'the last report before the project framework that we read'; WSC project-page source dated 16 Apr 2018; Sapiano page range and p. 30 verified. all corrections
2027
- 6 October 2027 Coming up: Evidence review due Each finished check is reviewed against new evidence within a year.
Every change to this claim's record is public: history of the record.
Download the report and flyer