CC-062 · Planning & Housing · Development & construction
Construction is 9-14% of the economy
Largely supported Moderate confidence Draft: no right of reply needed
Parts of this claim
The claim is split into parts that are tested separately, as in the report below. Each part has its own number.
- CC-062A Construction and real estate account for around 9% of GVA, direct effects aloneKPMG Table 1.1: 9.1% (2024); Eurostat: 9.6% (2024), 9.7% (2025), same definition (imputed rents excluded).
- CC-062B About 14% once indirect linkages are factored inReproduces from KPMG Table 1.3 (14.04%); outputs match Eurostat. Modelled with 2015 multipliers we could not re-derive; counts imputed rents, which the 9% does not.
Claim Check 062 · Planning and housing
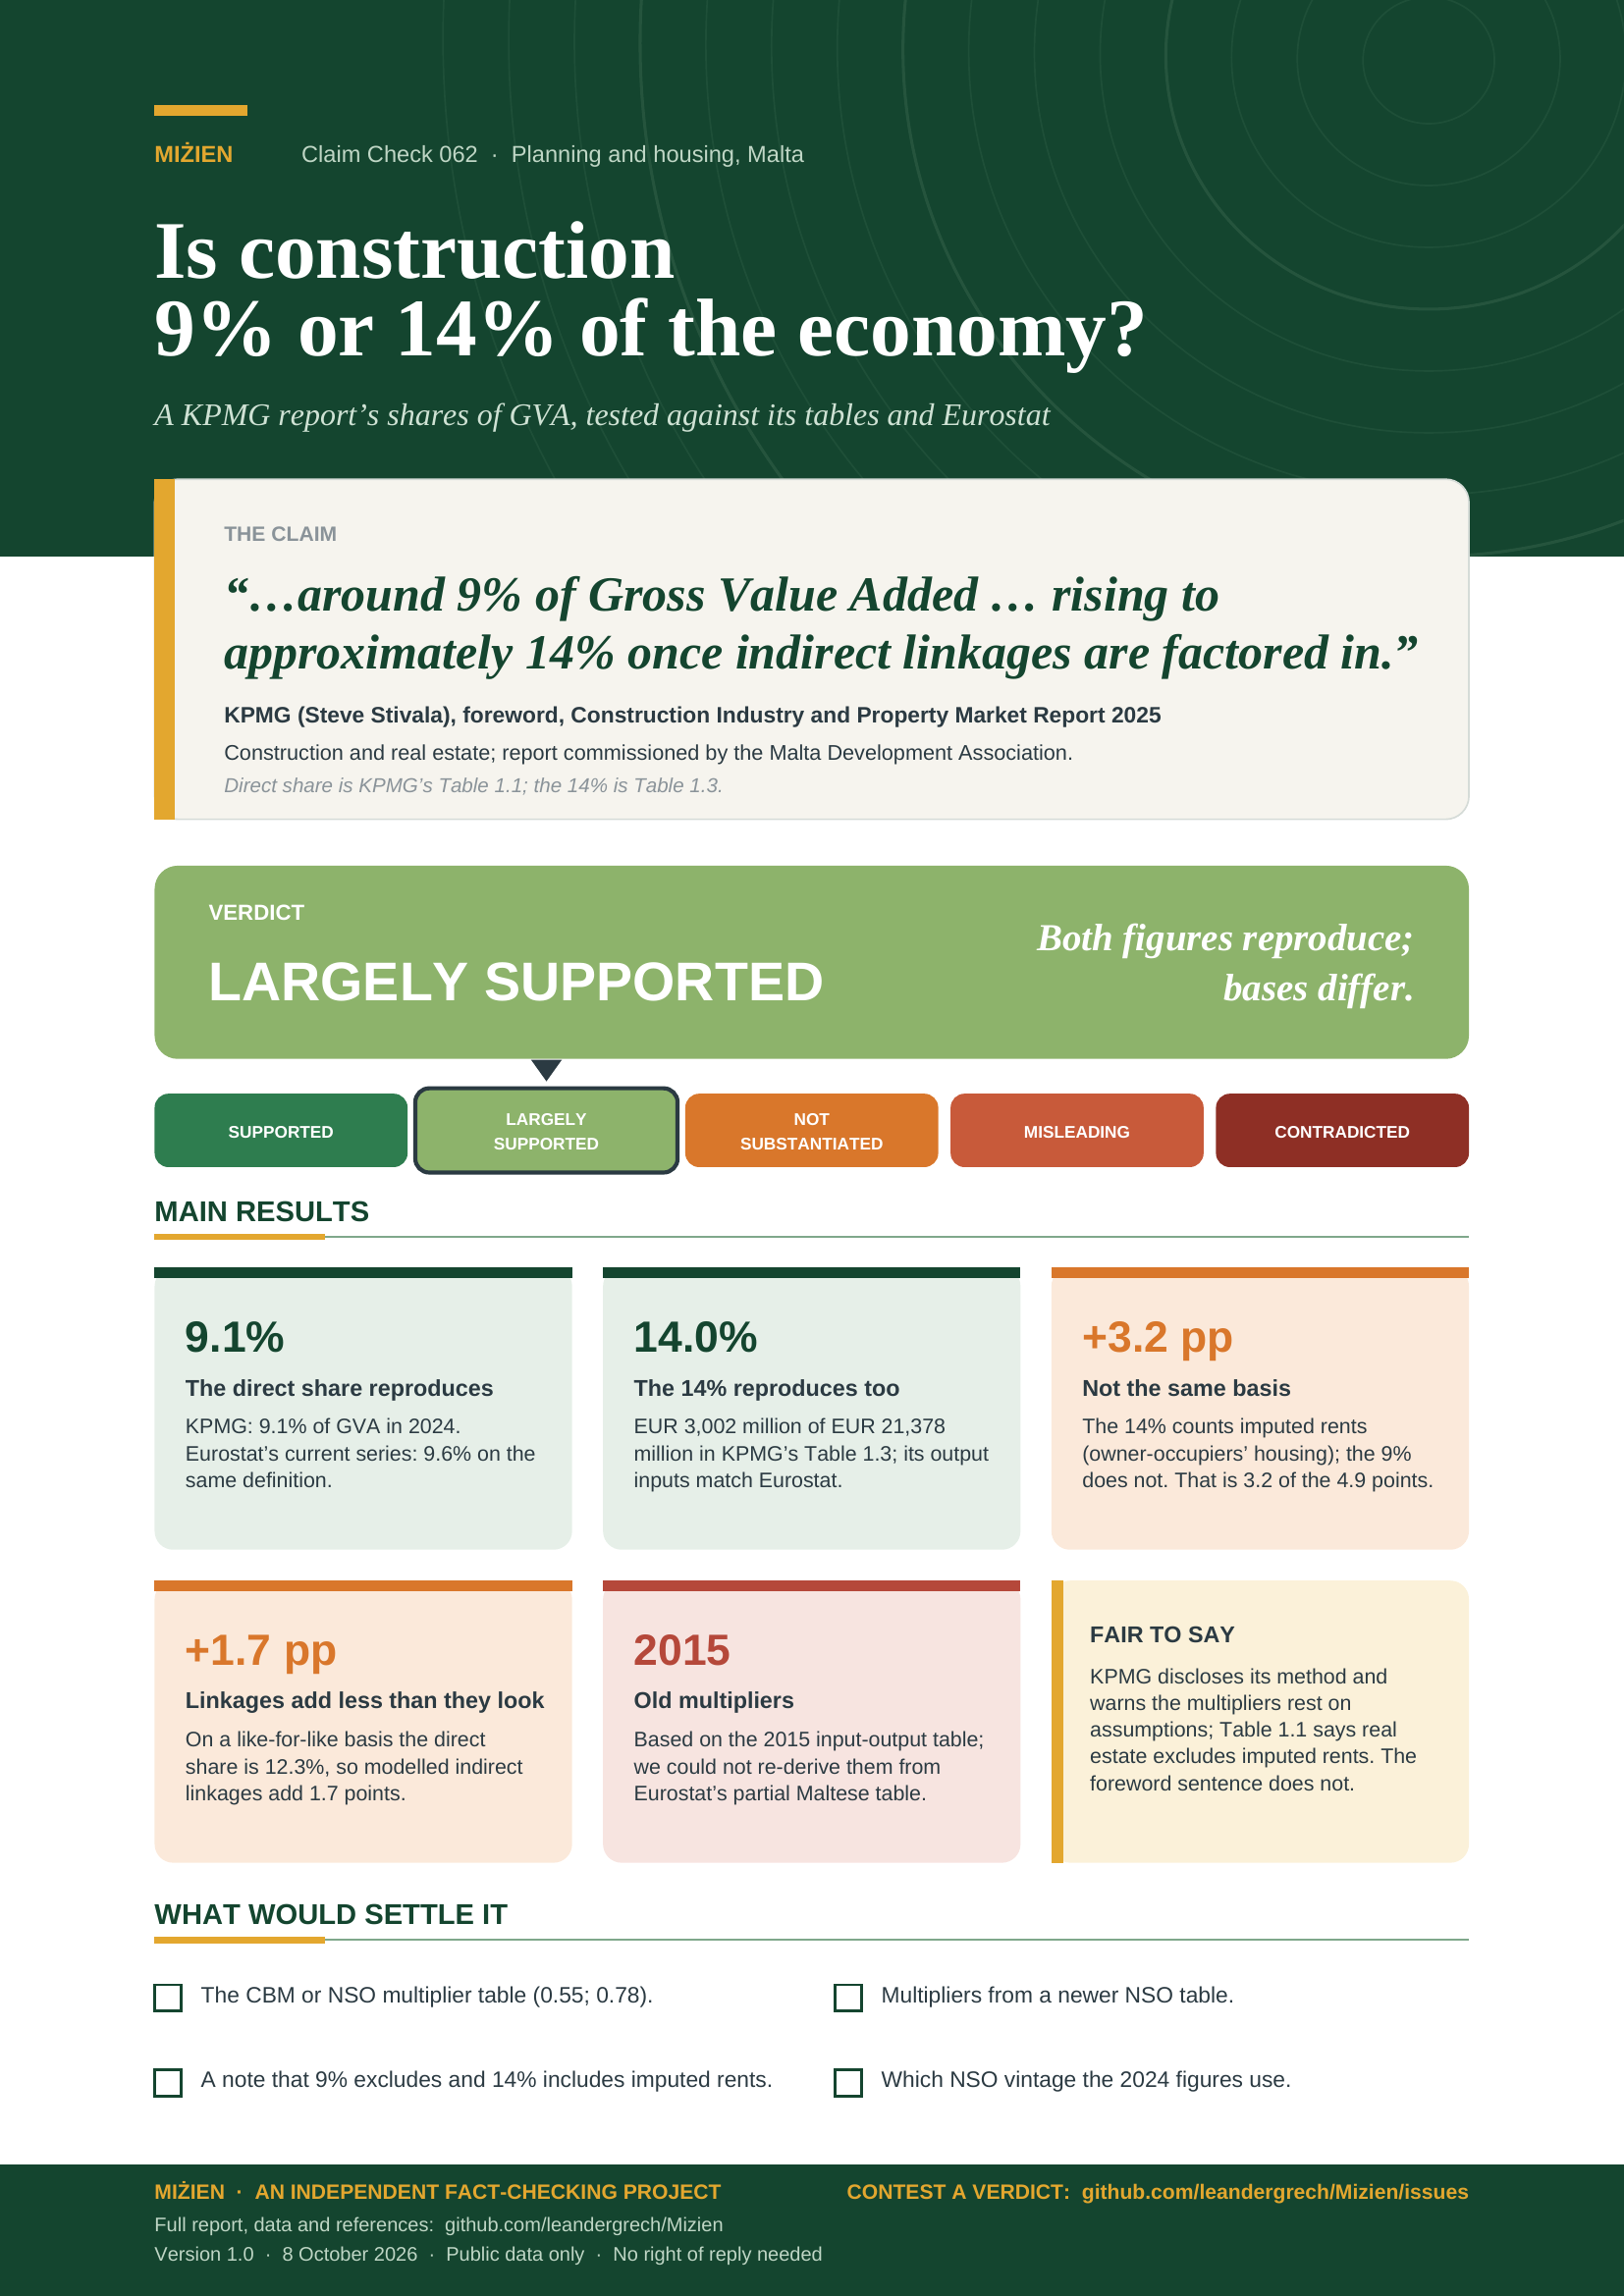
Is construction 9% or 14% of the economy?
Testing a KPMG report’s shares of Malta’s gross value added against its own tables and Eurostat
“…around 9% of Gross Value Added … rising to approximately 14% once indirect linkages are factored in.”
KPMG (Steve Stivala), foreword, Construction Industry and Property Market Report 2025.
Dec 2025; commissioned by the Malta Development Association.
Verdict: Largely supported Both figures reproduce; different bases, modelled 14%
Version 1.0 · 8 October 2026
TL;DR
The foreword to KPMG’s Construction Industry and Property Market Report 2025, prepared for the Malta Development Association (MDA), says: “Construction and real estate collectively account for around 9% of Gross Value Added (GVA) when considering direct effects alone, rising to approximately 14% once indirect linkages are factored in.” We recomputed both figures from the report’s own tables and from Eurostat’s national accounts. Both reproduce. They are not, however, measured the same way: about two-thirds of the step from 9% to 14% comes from a change in how housing services are counted, not from indirect linkages.
- The 9% reproduces. KPMG’s Table 1.1: 9.1% of GVA in 2024 (imputed rents excluded). Eurostat’s current series: 9.6% for 2024, 9.7% for 2025, same definition.
- The 14% reproduces arithmetically. Table 1.3 applies multipliers (0.55; 0.78) to 2024 output and gets EUR 3,002 million, 14.04% of GVA; its output inputs match Eurostat’s.
- The two figures are not like for like. The 9% leaves out imputed rents (the value of owner-occupiers’ housing); the 14% includes them. On KPMG’s own figures the direct share with imputed rents is 12.3%, so indirect linkages add 1.7 percentage points, not 5.
- The multipliers are old and could not be re-derived. Central Bank of Malta Type I multipliers from the 2015 input-output table (second-hand); Eurostat’s Maltese table is incomplete, so we could not rebuild them. KPMG warns of assumptions that “may not hold true in real life”.
- Verdict: largely supported (moderate confidence). Both figures match the data and the method is disclosed. The caveats concern what the sentence does not say: that the two figures use different treatments of imputed rents, and that the 14% is a modelled estimate.
- Supported
- Largely supported
- Not substantiated
- Misleading
- Contradicted
What would move the verdict up
A readable source for the multipliers (the Central Bank of Malta or NSO tables) that reproduces 0.55 and 0.78, and a statement alongside the figures that the 9% excludes imputed rents and the 14% includes them.
What would move it down
Evidence that the 2015-based multipliers differ materially from those of the NSO’s latest input-output table, or that the output figures used in Table 1.3 are not NSO’s.
IN THIS REPORT
1 The claim and what we could verify
The sentence is in the foreword of the report, signed by Steve Stivala, Director, Advisory Services, KPMG (PDF p. 10) [1]. The report states that it was commissioned by the Malta Development Association and sponsored by four banks and the Property Malta Foundation, and that KPMG undertakes no advocacy services for the Association (PDF pp. 2–3) [1]. We read the foreword, executive summary and Chapter 1 (the economic contribution), where the figures are built; we did not read the other chapters. The foreword does not cite a table, but Table 1.1 (p. 23) and Table 1.3 (p. 30) give 9.1% and 14.04%.
| What was said | Who | Access |
|---|---|---|
| “Construction and real estate collectively account for around 9% of Gross Value Added (GVA) when considering direct effects alone, rising to approximately 14% once indirect linkages are factored in.” | KPMG, foreword [1] | Read in full (PDF p. 10) |
| Table 1.1: 9.1% of total GVA less imputed rents in 2024 (construction F plus real estate L excluding imputed rents) | KPMG, from NSO data [1] | Read (PDF p. 23) |
| Table 1.3: EUR 3,002 million, 14.04% of total GVA, from output multiplied by Type 1 value-added multipliers | KPMG, using Central Bank of Malta multipliers ◆ [1] | Read (PDF p. 30); multipliers not retrieved |
2 Method
Question. Do the data support construction and real estate being about 9% of Malta’s GVA directly and about 14% including indirect linkages, and are the two numbers measured on the same basis?
Evidence. KPMG’s Tables 1.1–1.3, transcribed with page numbers [1]; Eurostat’s national accounts by industry (nama_10_a64: gross value added and output, current prices) [2]; Eurostat’s symmetric input-output tables for Malta (naio_10_cp1750, 2015 and 2020) to test whether the multipliers can be re-derived [3]. All numbers are recomputed by tools/cc-062-report/calc.py from files in data/cc-062/ and written to data/cc-062/checks.csv.
Grades. Official national-accounts statistics are grade C; KPMG’s report is a commissioned analysis of official statistics and is graded C; the multiplier-based estimate is a model and is graded C with the caveats in Section 4. No peer-reviewed study is needed to test an accounting ratio. Verdicts follow the five-point scale in Appendix A.
3 What the data show
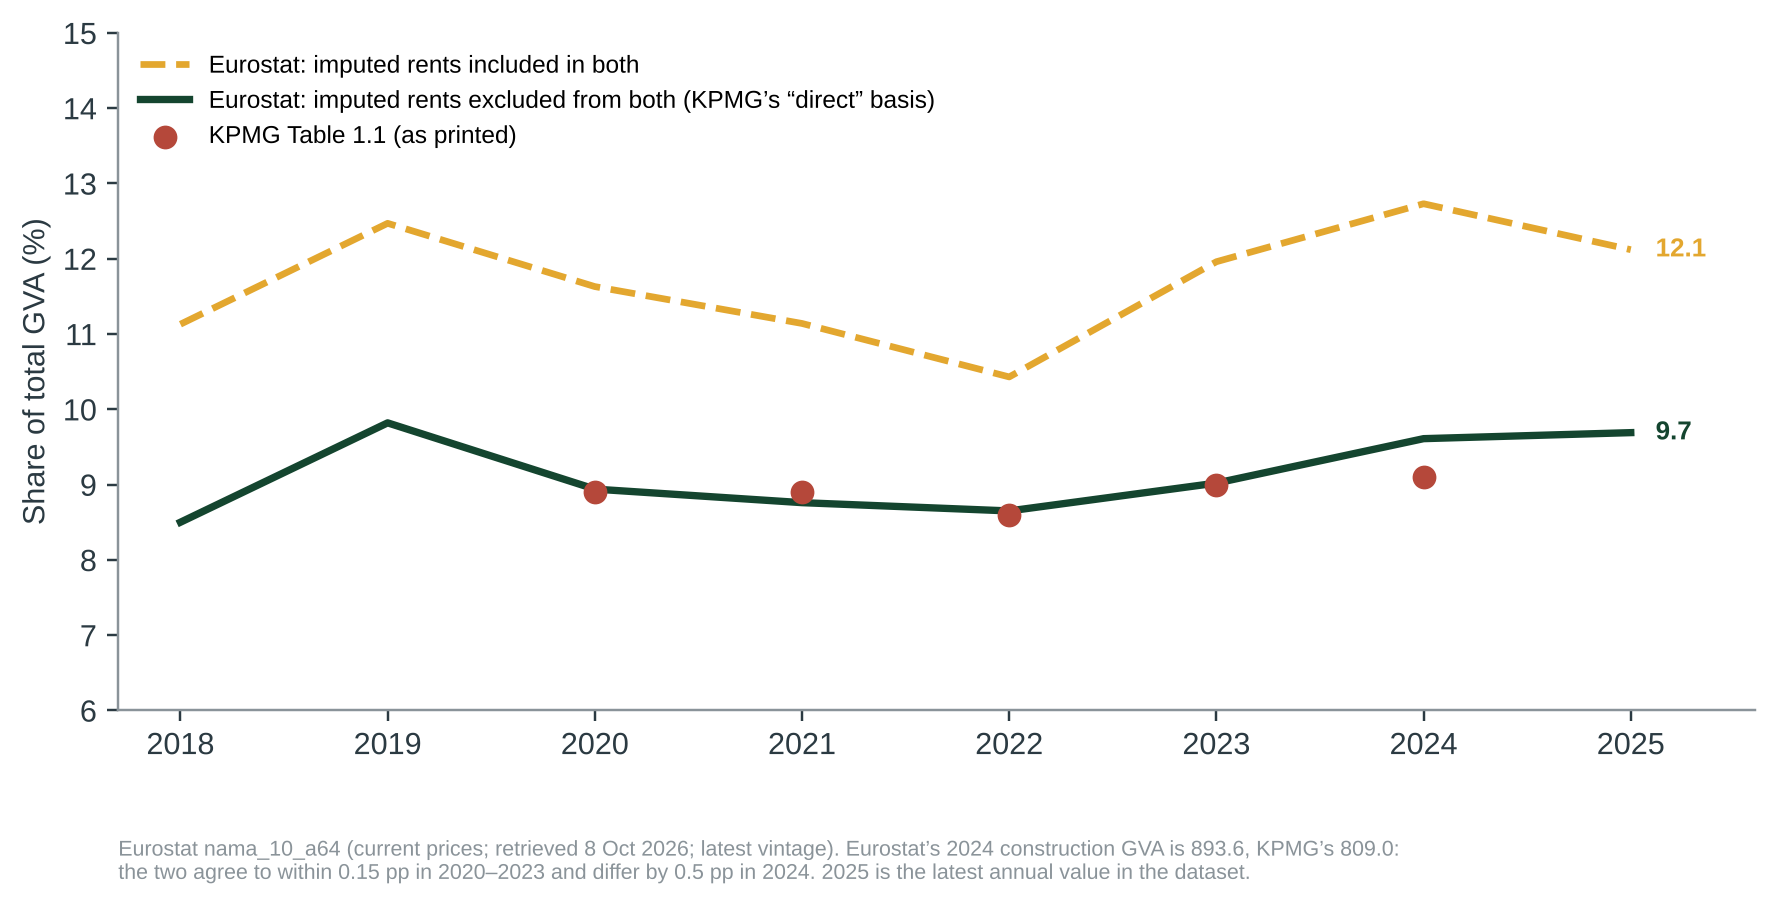
The direct share. KPMG defines the “building industry” as construction (NACE F) plus real estate activities excluding imputed rents (part of NACE L), and divides by total GVA less imputed rents. For 2024 that is EUR 1,875 million of EUR 20,617 million, or 9.1% (Table 1.1) [1]. Eurostat’s current series gives the same ratio as 9.0% for 2023, 9.6% for 2024 and 9.7% for 2025 [2]. The 2024 difference arises because Eurostat’s construction GVA for 2024 (EUR 893.6 million) is now higher than KPMG’s (EUR 809.0 million); in 2020–2023 the two series agree to within 0.15 percentage points (Figure 2).
The 14%. Table 1.3 multiplies 2024 output (construction EUR 2,395 million; real estate including imputed rents EUR 2,438 million) by Type 1 value-added multipliers of 0.55 and 0.78. That gives EUR 1,317 and 1,901 million; after subtracting EUR 216 million for inter-industry linkages the total is EUR 3,002 million, which is 14.04% of total GVA of EUR 21,378 million [1]. We reproduce each step. Eurostat’s output figures for 2024 are 2,396 and 2,439, within 0.1% of KPMG’s [2].
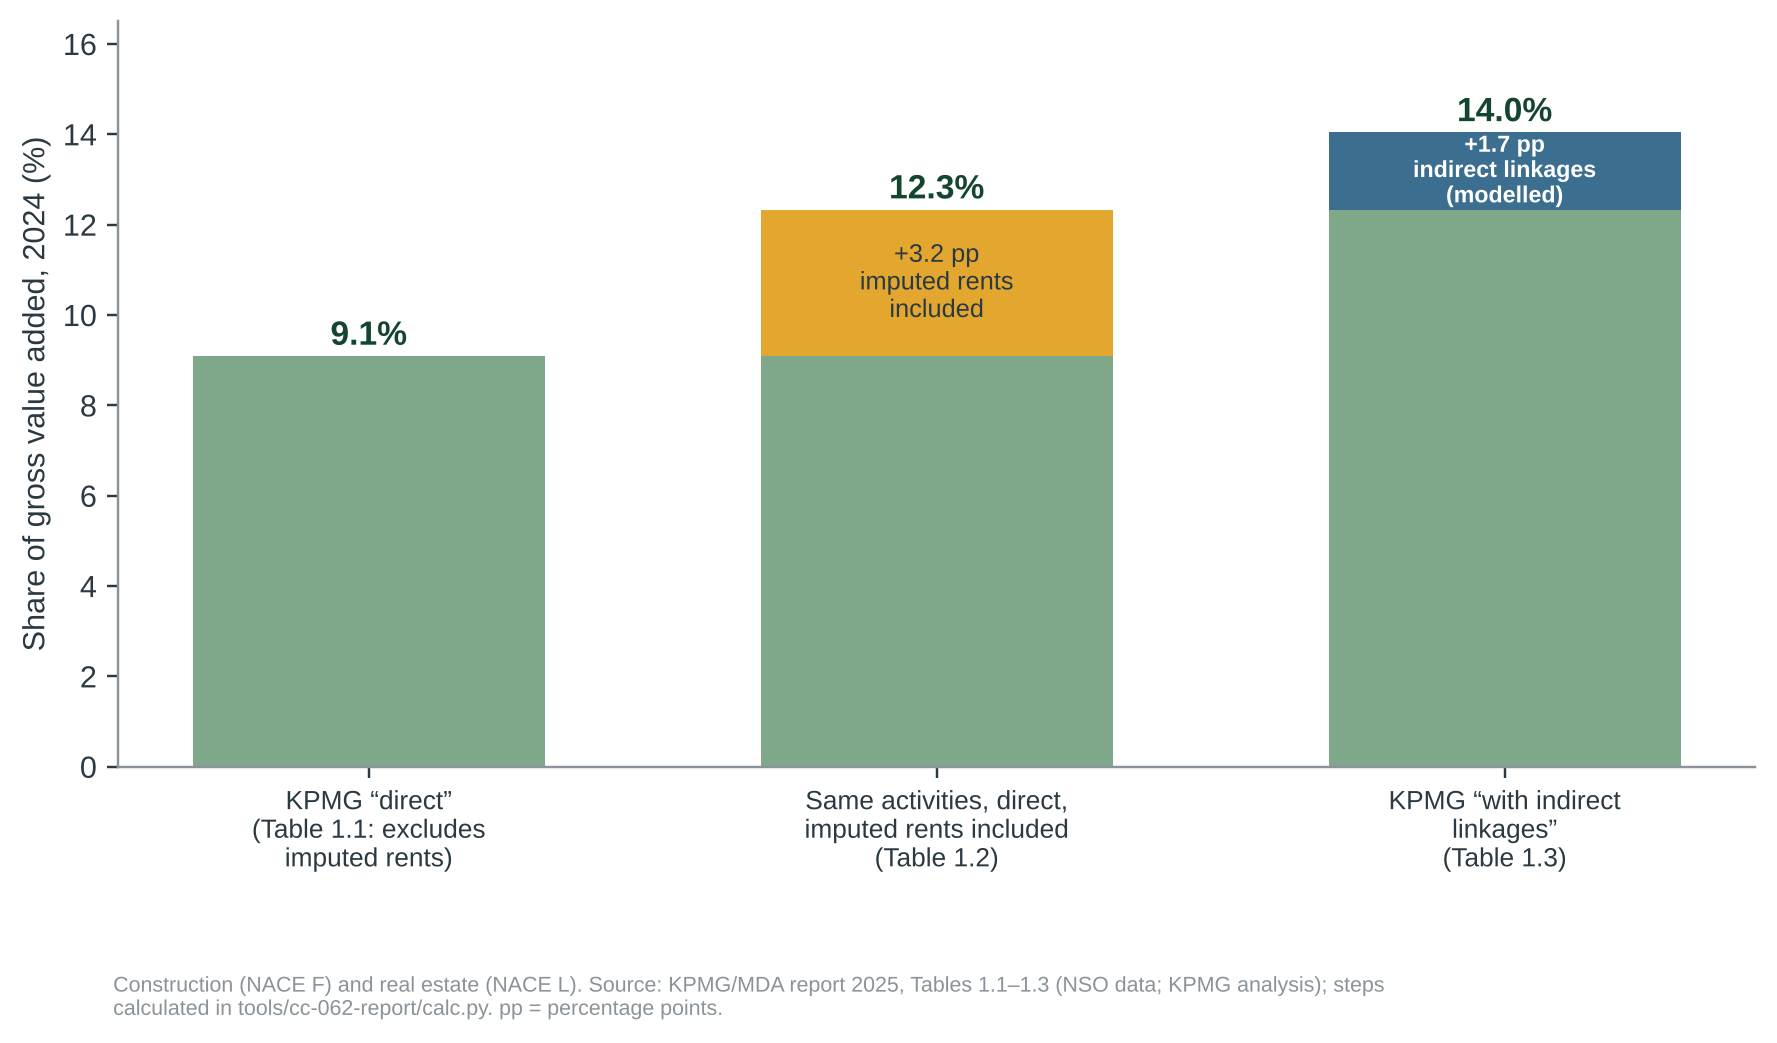
Why 9% and 14% differ. The real-estate output in Table 1.3 includes imputed rents, and total GVA includes them; the 9% leaves both out. Putting the direct figures on the 14%’s basis (construction EUR 809 million plus real estate including imputed rents EUR 1,827 million, from Table 1.2, divided by total GVA of EUR 21,378 million) gives 12.3%. The step from 9.1% to 14.0% then splits into 3.2 points from the change of basis and 1.7 points from indirect linkages (Figure 1).
| Figure | Value | Source | Grade |
|---|---|---|---|
| Direct share, imputed rents excluded, 2024 | 9.1% (KPMG); 9.6% (Eurostat) | KPMG Table 1.1 [1]; Eurostat nama_10_a64 [2] | C |
| Direct share, imputed rents included, 2024 | 12.3% (KPMG’s figures); 12.7% (Eurostat) | KPMG Table 1.2 [1]; Eurostat [2] | C |
| Direct plus indirect (modelled), 2024 | 14.04%, EUR 3,002 million | KPMG Table 1.3 [1] | C |
| Output, construction / real estate, 2024 | 2,395 / 2,438 (KPMG); 2,396 / 2,439 (Eurostat) | KPMG Table 1.3 [1]; Eurostat [2] | C |
| Multipliers (Type 1 value added): construction / real estate | 0.55 / 0.78, 2015 table | KPMG p. 30, 34 [1]; CBM publication not retrieved ◆ | C |
| Malta SIOT 2015 in Eurostat: value added in industries with a published column | EUR 6,443 million of 8,889 (72%) | Eurostat naio_10_cp1750 [3] | C |
All values in data/cc-062/checks.csv. Eurostat figures are current-price national accounts retrieved on 8 Oct 2026 and carry no status flags in the extract; KPMG’s NSO figures are an earlier vintage. pp = percentage points.
4 Where the evidence points different ways
Q1 Is the direct share about 9%?
YES, ON KPMG’S DEFINITIONEVIDENCE FOR THE CLAIM'S IMPRESSION
KPMG’s Table 1.1 gives 9.1% for 2024 and 8.6–9.0% for 2020–2023; Eurostat’s current series reproduces 2020–2023 within 0.15 points and gives 9.6% for 2024 and 9.7% for 2025 [1][2].
EVIDENCE AGAINST
The figure depends on the definition. It leaves out imputed rents and a list of related activities KPMG names but could not include (for example architecture and engineering, quarrying, building-materials manufacturing, p. 21). Counting imputed rents in both numerator and denominator gives 12.7% (2024, Eurostat).
Q2 Is about 14% a fair figure “once indirect linkages are factored in”?
REPRODUCES; BASIS AND MODEL CAVEATSEVIDENCE FOR THE CLAIM'S IMPRESSION
The arithmetic reproduces (14.04%), the method is disclosed (output times Type 1 multiplier, less inter-industry linkages) and the output inputs match Eurostat [1][2]. KPMG states the multipliers are the latest published Central Bank of Malta Type 1 value-added multipliers, based on the 2015 input-output table ◆.
EVIDENCE AGAINST
The 14% counts imputed rents; the 9% does not, so the two are not on one basis (Figure 1). The multipliers are from a 2015 table, and KPMG’s footnote 16 says they rest on assumptions on relative prices and supply constraints that “may not hold true in real life”. We could not re-derive 0.55 and 0.78: Eurostat’s published Malta table covers 72% of value added.
5 Testing the claim
| Sub-claim | What the evidence shows | Rating |
|---|---|---|
| A. Construction and real estate account for around 9% of GVA, direct effects alone | KPMG Table 1.1: 9.1% (2024); Eurostat: 9.6% (2024), 9.7% (2025), same definition (imputed rents excluded). | SUPPORTED |
| B. About 14% once indirect linkages are factored in | Reproduces from KPMG Table 1.3 (14.04%); outputs match Eurostat. Modelled with 2015 multipliers we could not re-derive; counts imputed rents, which the 9% does not. | LARGELY SUPPORTED |
6 Verdict and requests for evidence
Both figures reproduce from the data; the two use different bases and the 14% is a model estimate. Confidence: moderate.
Why. (1) The 9% is KPMG’s own Table 1.1 and is reproduced by Eurostat (9.6% for 2024 on the same definition). (2) The 14% is KPMG’s Table 1.3; we reproduce every line, and the output inputs match Eurostat. (3) Two caveats limit the claim: the 14% includes imputed rents while the 9% does not, which accounts for 3.2 of the 4.9 points between them, and the multipliers behind the indirect part could not be verified. Neither changes the substance (the sector is about a tenth of GVA directly, and more once linkages are modelled), which our scale calls Largely supported. Confidence is moderate because the indirect part rests on a model we could not re-derive.
What this verdict does not say. It does not say the sector’s true economic weight is 14%, that multiplier effects are a share of GDP, or anything about the report’s other findings. It says the two figures in the foreword match the data and the report’s own tables.
Evidence we are asking for
- The Central Bank of Malta or NSO table that gives the 2015-based Type 1 value-added multipliers (0.55; 0.78).
- Multipliers from a more recent NSO input-output table, if one has been published.
- A note, where the figures are quoted, that the 9% excludes imputed rents and the 14% includes them.
7 Limitations
- We read the foreword, executive summary and Chapter 1 of a 124-page report, not the whole report.
- The NSO figures in Tables 1.1–1.3 are read through KPMG (◆ second-hand); nso.gov.mt returns 403 to scripts, and we compared them with Eurostat’s national accounts, which carry NSO’s data.
- We could not retrieve the Central Bank of Malta publication of the multipliers (centralbankmalta.org returned 403); the multipliers are therefore known only through KPMG ◆. Web searches (8 Oct 2026) found a Central Bank working paper and an Xjenza article on Maltese multipliers for other base years, which we did not open.
- Eurostat’s Maltese input-output table is partial (72% of value added in 2015; empty columns for several industries), so we could not rebuild the multipliers; this is a limit of the open data, not evidence that KPMG’s figures are wrong.
- Eurostat’s 2024 and 2025 national-accounts values are subject to revision; 2025 is the latest annual value in the dataset and is not flagged in our extract.
- A multiplier is a modelled response to a hypothetical change in demand, not an observed share of the economy; KPMG’s footnote 16 (p. 30) says multipliers should be interpreted with caution.
References
- [1] KPMG (Dec 2025). Construction Industry and Property Market Report 2025, 9th edition, for the Malta Development Association. 124 pp. Read 8 Oct 2026 (foreword, executive summary, Chapter 1). https://assets.kpmg.com/content/dam/kpmgsites/mt/pdf/2025/12/kpmg-mda-construction-industry-and-property-market-report-2025.pdf
- [2] Eurostat. nama_10_a64: gross value added and output by industry (NACE A*64), current prices, Malta, 2015–2025; retrieved 8 Oct 2026. https://ec.europa.eu/eurostat/databrowser/view/nama_10_a64/
- [3] Eurostat. naio_10_cp1750: symmetric input-output table at basic prices, industry by industry, domestic output, Malta, 2015 and 2020; retrieved 8 Oct 2026. https://ec.europa.eu/eurostat/databrowser/view/naio_10_cp1750/
- [4] MiŻien. Data and calculations: data/cc-062/; tools/cc-062-report/calc.py.
Appendix A: series standards and verdict scale
Every investigation in this series follows the same rules so that verdicts are comparable and challengeable.
| Verdict | Meaning |
|---|---|
| SUPPORTED | Evidence consistently backs the claim as stated. |
| LARGELY SUPPORTED | Backed by the evidence, with minor caveats that do not change the substance. |
| NOT SUBSTANTIATED | Stated more strongly than the evidence offered or available allows. May be true in some conditions but has not been shown. |
| MISLEADING | Omits material facts so that the overall impression is inaccurate, even if individual statements are defensible. |
| CONTRADICTED | The available evidence points against the claim. |
Confidence
High: multiple independent lines of evidence agree. Moderate: evidence is relevant but incomplete or indirect. Low: evidence is thin, second-hand or conflicting.
Evidence grades
A experiment · B observational study with a control or gradient · C review, guidance or official statistics · D assertion or anecdote. ◆ marks a source known only second-hand.
Standards
- Quote the speaker, not the headline, with outlet and date, and link the original where possible.
- Separate the claim from the evidence offered for it, and say who made which statement.
- Grade the evidence and show differing views side by side where the evidence is unsettled.
- State what we could not access or verify, and what would change the verdict either way.
- Ask for the missing evidence in specific, answerable requests.
- Offer a right of reply where a check finds a claim Not substantiated, Misleading or Contradicted (or a pledge Not measurable, Off track or Missed), before wider circulation, and append responses.
- Correct errors openly with a version number and change log.
- Whistle-blow only on evidence: a verdict of Misleading or Contradicted requires documents or data that can be shown, not inference.
- Check every side. Government, opposition, NGOs and developers are held to the same standard.
Appendix B: revision log
| Version | Date | Change |
|---|---|---|
| 1.0 | 8 Oct 2026 | First issue. Verdict Largely supported (moderate confidence); no right of reply needed. |
Sources and archived copies
-
Construction Industry and Property Market Report 2025 (foreword, PDF p. 10; Tables 1.1-1.3, pp. 23-30), KPMG for the Malta Development Association, Dec 2025.
Original · Archived copy
The claim, in the foreword. Read 8 Oct 2026 (foreword, executive summary, Chapter 1); not committed (copyright); SHA-256 in data/cc-062/source_hash.txt.
Right of reply
Not needed: this check finds the claim supported. A right of reply is sought when a check finds a claim Not substantiated, Misleading or Contradicted.
Connections
How this claim relates to the others: who made it, the themes it shares with other claims, and the patterns it shows. A connection is a reason to read two checks side by side. It does not make either one right or wrong. How connections are found.
Who made it
Other claims by KPMG 1
Linked directly 2
Claims that share a theme with this one. A theme is a cause, a mechanism, a target or a way of presenting figures that the editors have found in several claims; its strength says how close the link is.
Planning, housing and land take Shared driver · Weak (indicative)
Permit volumes, enforcement and housing demand drive land take. Claims about prices, enforcement, reclamation and land loss rest on the same planning system and the same data (PA permits, NSO prices, land-cover maps).
Two steps away 4
Not linked to this claim directly, but linked to a claim that is. These are found by following the links, not chosen by the editors, so they are looser: they show where one theme meets another.
- CC-013 Permits keep property prices in check (Largely supported)through Planning, housing and land takeCC-018Planning, housing and land take or Planning, housing and land takeCC-123Planning, housing and land take
- CC-014 Fewer enforcement notices, fewer illegalities (Misleading)through Planning, housing and land takeCC-018Planning, housing and land take or Planning, housing and land takeCC-123Planning, housing and land take
- CC-017 Land reclamation outside the Freeport (Not substantiated)through Planning, housing and land takeCC-018Planning, housing and land take
- CC-019 830,000 m2 of land lost in five years (Not substantiated)through Planning, housing and land takeCC-018Planning, housing and land take or Planning, housing and land takeCC-123Planning, housing and land take
Three steps away 11
One step further again. At this distance a connection says more about how the themes fit together than about this claim.
- CC-001 Upper Barrakka concrete (Not substantiated)through Planning, housing and land takeCC-018Planning, housing and land takeCC-019Sealed soil and concrete
- CC-002 Comino tree compensation (Largely supported)through Planning, housing and land takeCC-018Planning, housing and land takeCC-017Waste and construction
- CC-004 'Strong progress' in waste separation (Not substantiated)through Planning, housing and land takeCC-018Planning, housing and land takeCC-017Waste and construction
- CC-008 Flyovers and congestion (Not substantiated)through Planning, housing and land takeCC-018Planning, housing and land takeCC-017Waste and construction
- CC-012 Ta' Qali gravel and grass (Contradicted)through Planning, housing and land takeCC-018Planning, housing and land takeCC-019Sealed soil and concrete
- CC-058 96% of farmland in use (not yet checked)through Planning, housing and land takeCC-018Planning, housing and land takeCC-019Planning, housing and land take
- CC-059 Subsidies are 20% of farm output (not yet checked)through Planning, housing and land takeCC-018Planning, housing and land takeCC-019Farmland and farming pressure
- CC-060 7,000 first-time buyers helped (not yet checked)through Planning, housing and land takeCC-018Planning, housing and land takeCC-013Planning, housing and land take
- CC-063 Construction waste: 'standstill' warning (Not substantiated)through Planning, housing and land takeCC-018Planning, housing and land takeCC-017Waste and construction
- CC-127 EU: Malta has the lowest organic share in the EU (not yet checked)through Planning, housing and land takeCC-018Planning, housing and land takeCC-019Farmland and farming pressure
- CC-130 NGOs: ODZ racecourse policy ends protection (not yet checked)through Planning, housing and land takeCC-018Planning, housing and land takeCC-019Farmland and farming pressure
Similar wording
Claims whose own words overlap with this one, with the words they share. Found by comparing the wording of the claims, not their verdicts; a lead to read them together, not a finding.
- CC-123 KPMG: 8,716 residential units approved in 2024, up 7.4% (not yet checked)shares: kpmg, construction, commissioned
Timeline
What was said, what was published before and after it, and each step of this check, in date order. Statements and sources carry the date they were published. The steps of the check carry the date the research was done, from the check's research log. Other statements by the same body on the same topic show whether a position was repeated, changed or corrected.
2025
- December 2025 The statement KPMG (this claim)
- December 2025 Statement published Construction Industry and Property Market Report 2025, KPMG for the MDA
- December 2025 Statement by KPMG on Planning & Housing CC-123 KPMG: 8,716 residential units approved in 2024, up 7.4% (not yet checked)
2026
- 4 October 2026 Added to the claims to check
- 8 October 2026 Evidence published Eurostat nama_10_a64: GVA and output by industry, Malta, Eurostat
- 8 October 2026 Evidence published Eurostat naio_10_cp1750: symmetric input-output table, Malta (2015, 2020), Eurostat
- 8 October 2026 Check started Worker B picked the claim from the queue (not started).
- 8 October 2026 Exact wording found Verbatim sentence found in the foreword (PDF p. 10) of the KPMG report, signed by Steve Stivala, Director, Advisory Services; the claim record's text was a paraphrase attributing it to the MDA.
- 8 October 2026 Note KPMG Tables 1.1-1.3 transcribed; shares recomputed and compared with Eurostat nama_10_a64; Eurostat's Malta input-output table (naio_10_cp1750) found too incomplete to re-derive the multipliers.
- 8 October 2026 Version 1.0: first issue First issue. Verdict Largely supported (moderate confidence); no right of reply needed. Verdict in this version: Largely supported, moderate confidence.
- 8 October 2026 Evidence reviewed
2027
- 8 October 2027 Coming up: Evidence review due Each finished check is reviewed against new evidence within a year.
Every change to this claim's record is public: history of the record.
Download the report and flyer