CC-037 · Air · Air quality & health
Highest share reporting pollution
Supported High confidence Draft: no right of reply needed
Parts of this claim
The claim is split into parts that are tested separately, as in the report below. Each part has its own number.
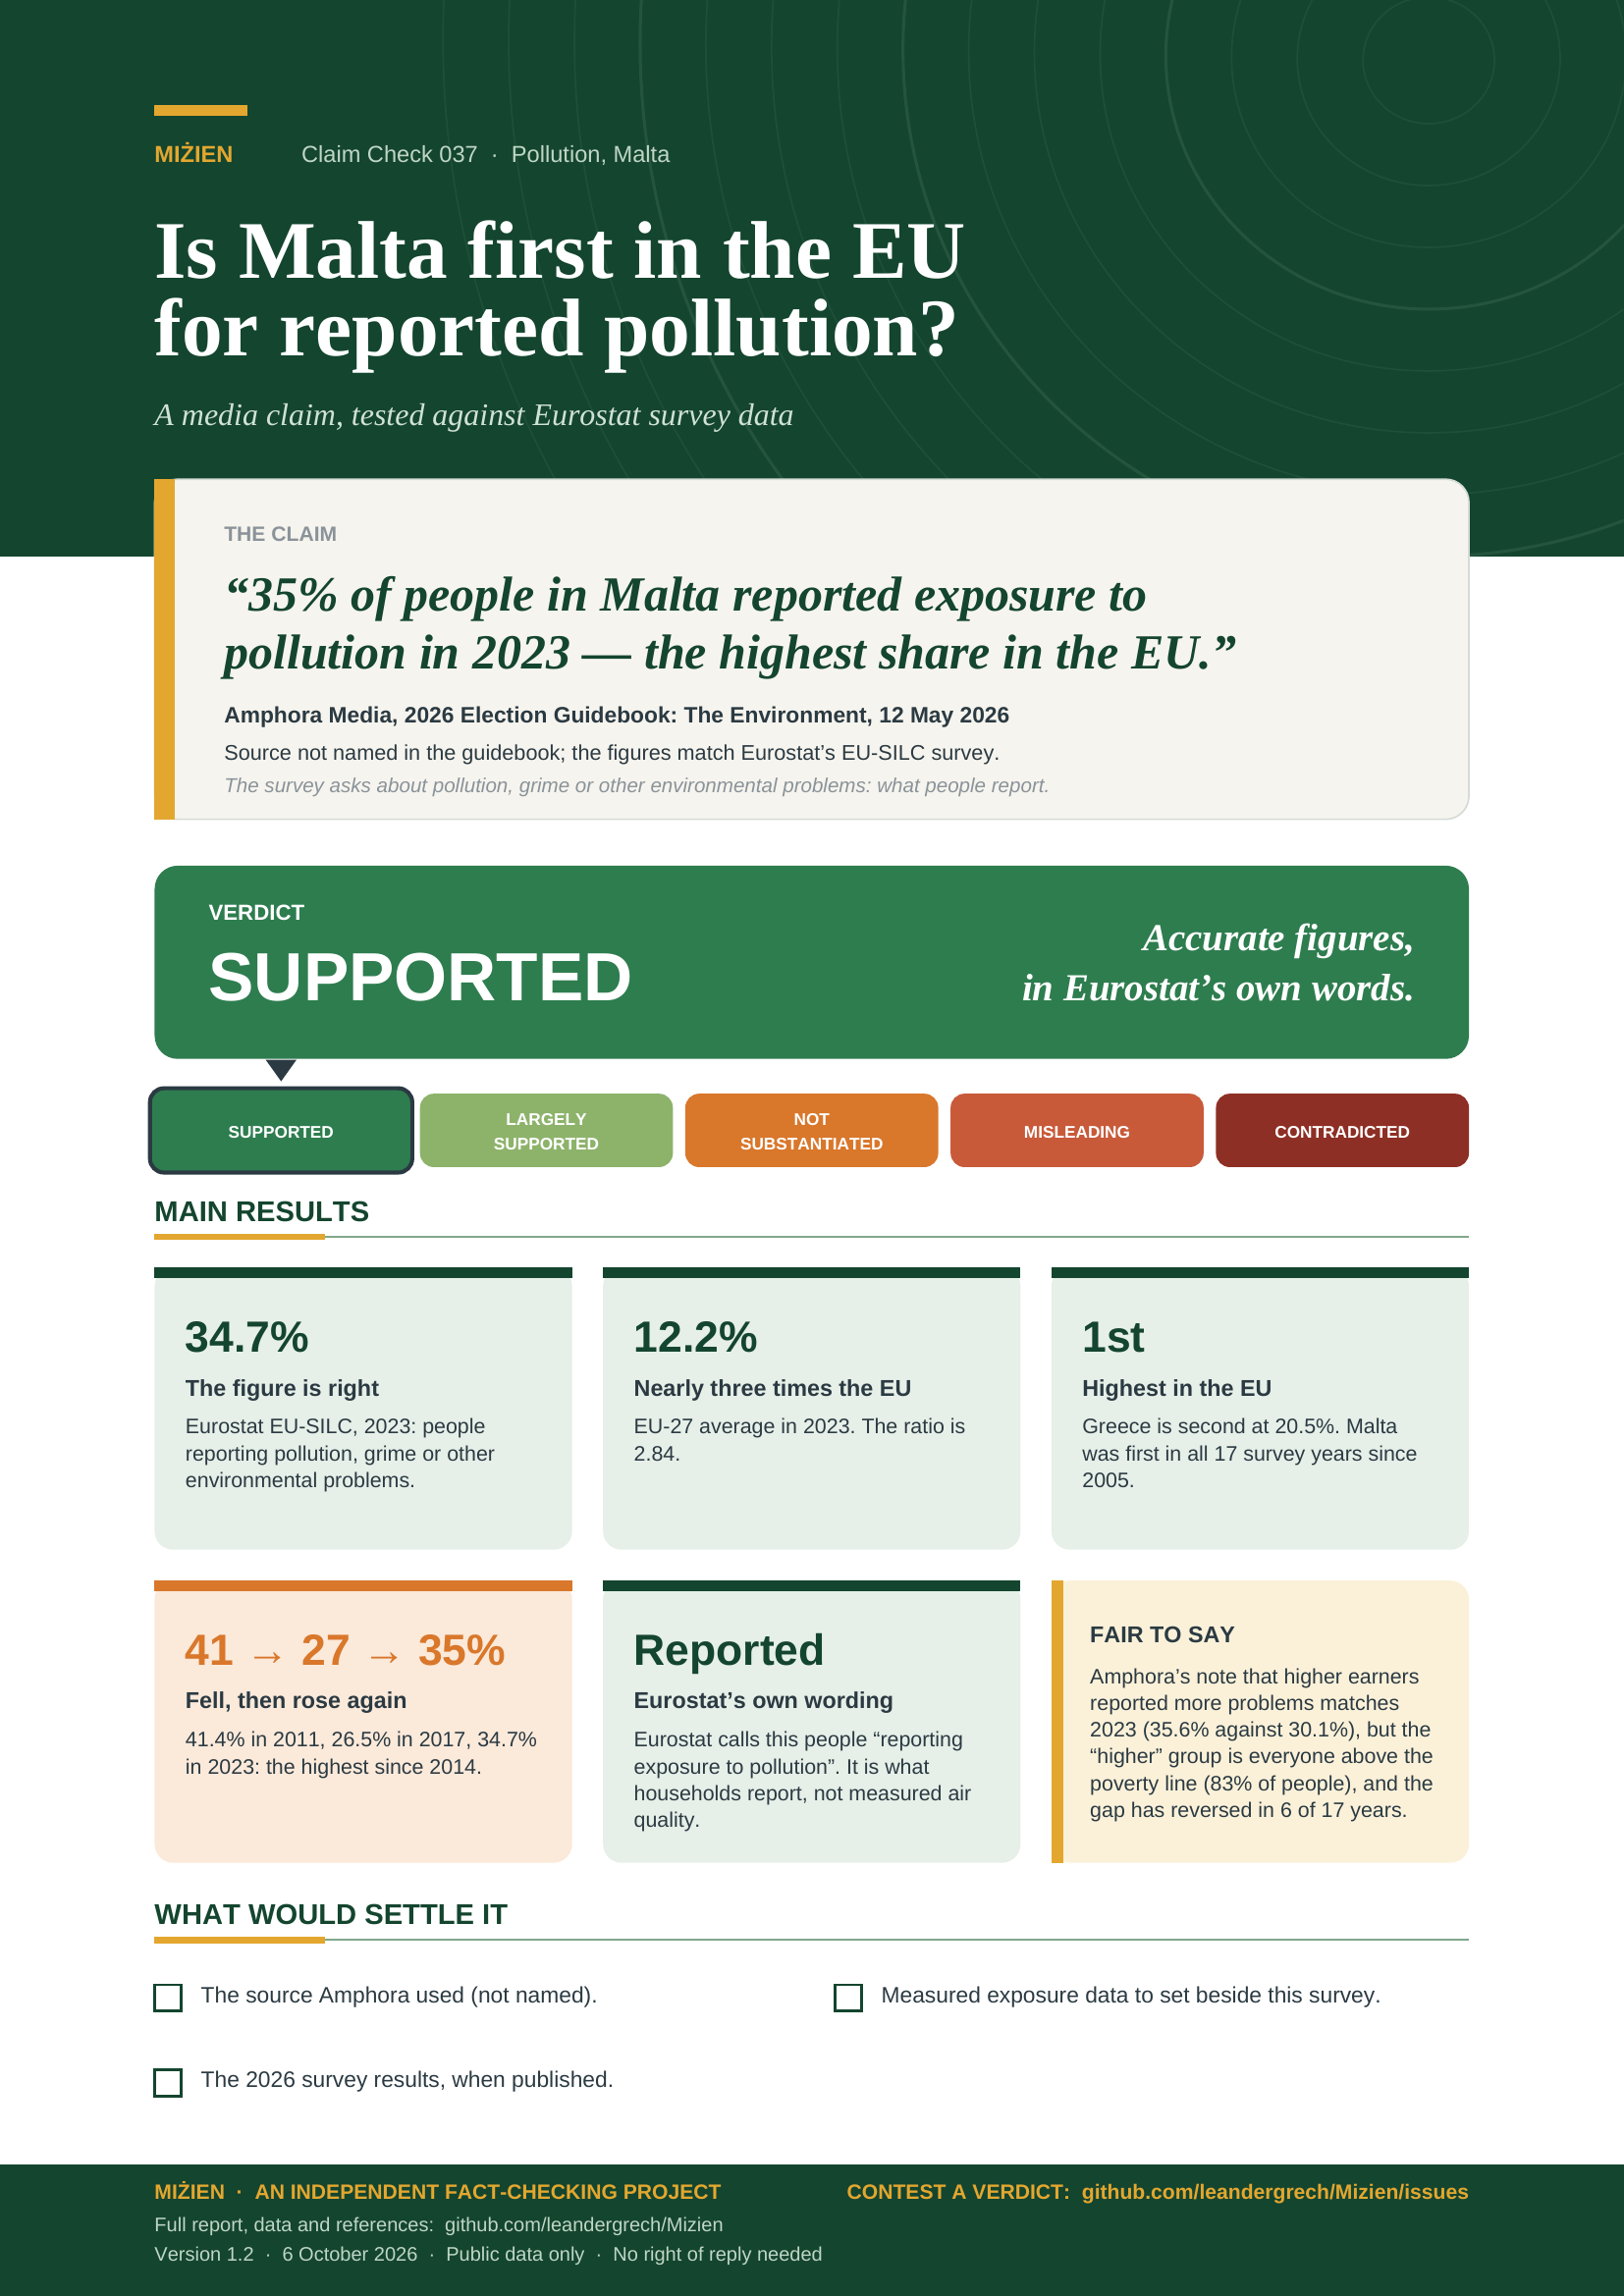
- CC-037A 35% of people in Malta reported pollution in 2023Eurostat: 34.7% [2].
- CC-037B The highest share in the EUFirst of 27; Greece second at 20.5%; first in all 17 years with data [2].
- CC-037C Nearly three times the EU average of 12%12.2% EU-27; ratio 2.84 (2.9 on the rounded figures) [2].
- CC-037D “Exposure to pollution” (intro wording)Eurostat’s own wording, shortened: it describes the indicator as people “reporting exposure to pollution, grime or other environmental problems” [5]. The survey records reported problems, not measured exposure [7].
- CC-037E High earners more affected than low earners2023: 35.6% above vs 30.1% below 60% of median income [2]. But the “above” group is 83.4% of people, not high earners [11]; the gap reversed in 6 of 17 years; EU-wide it runs the other way.
Claim Check 037 · Statistics and EU surveys
Is Malta first in the EU for reported pollution?
Testing a media claim about Malta’s share of people reporting pollution against Eurostat data
“35% of people in Malta reported exposure to pollution in 2023 — the highest share in the EU.”
Amphora Media, 2026 Election Guidebook: The Environment, 12 May 2026.
Source not named; the figures match Eurostat’s EU-SILC data.
Verdict: Supported Accurate; reported problems, in Eurostat’s own words
Version 1.2 · 6 October 2026
TL;DR
Amphora Media’s 2026 Election Guidebook: The Environment (12 May 2026) says: “35% of people in Malta reported exposure to pollution in 2023 — the highest share in the EU.” In the body it adds that this is “nearly three times the EU average of 12%”. Amphora does not name its source. We tested both statements against Eurostat’s EU-SILC survey indicator on pollution, grime and other environmental problems.
- The numbers are right. Eurostat gives 34.7% for Malta and 12.2% for the EU-27 in 2023. Rounded, that is 35% and 12%; the ratio is 2.84.
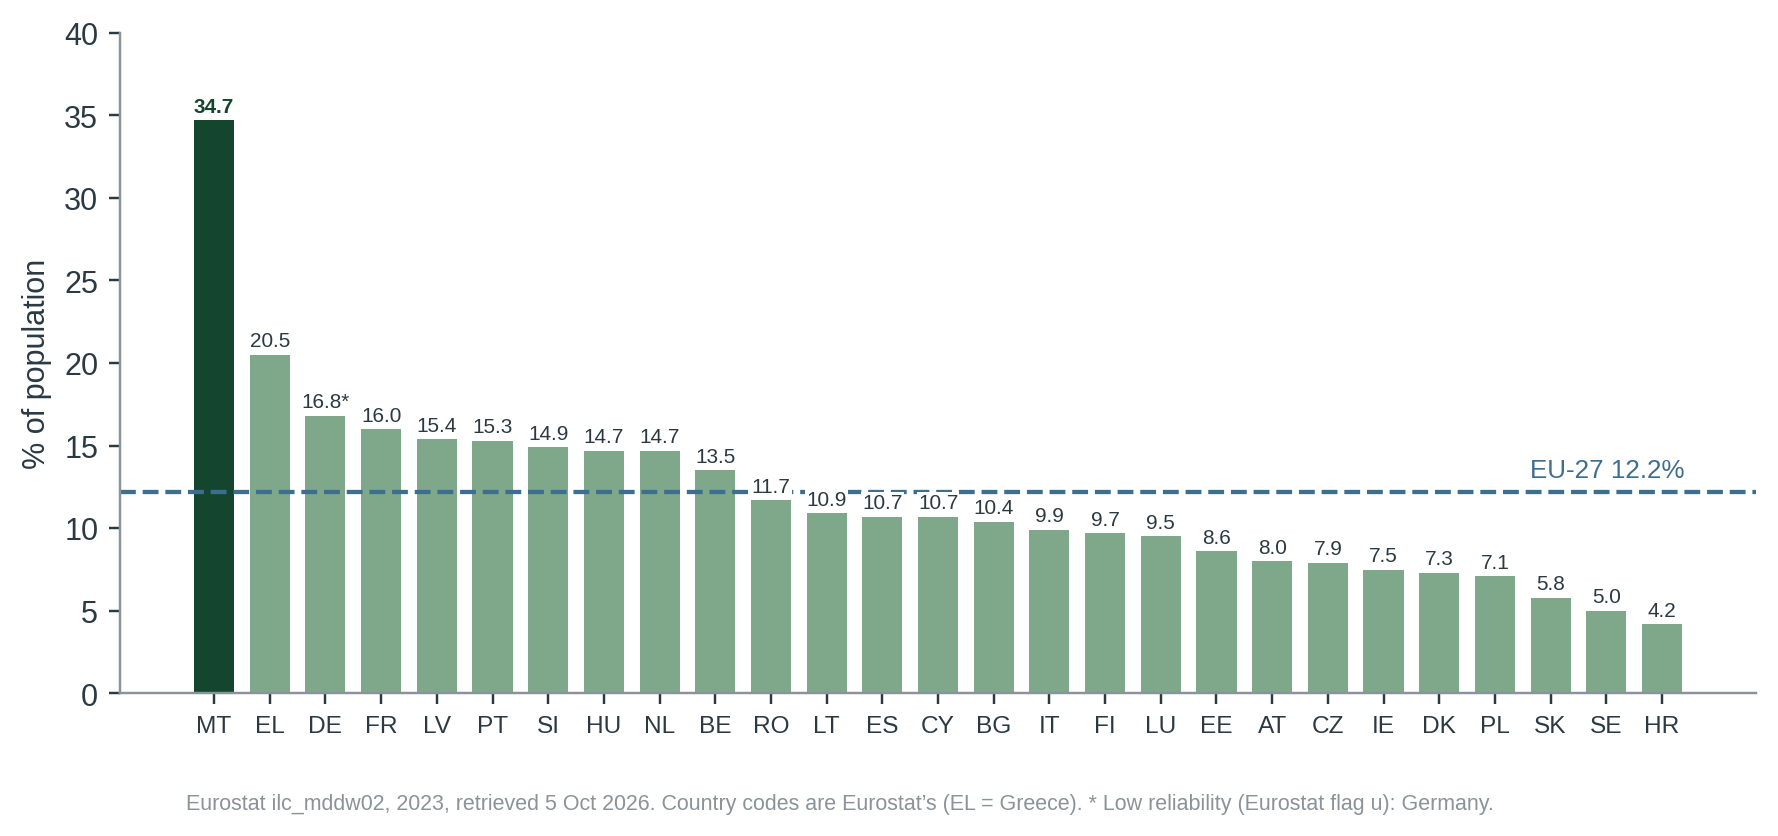
- Malta is first in the EU, by a wide margin. Greece is second at 20.5%. Malta has been first in every survey year with data since 2005 (17 of 17), and in 2023 it was also above every non-EU country in the table (the highest, Türkiye, 19.8%).
- “Reported exposure” is Eurostat’s own wording. The survey asks whether the household has a problem with pollution, grime or other environmental problems in its area. Eurostat describes the result as people “reporting exposure to pollution, grime or other environmental problems”; Amphora’s intro line shortens that. It records what people report, not measured air quality.
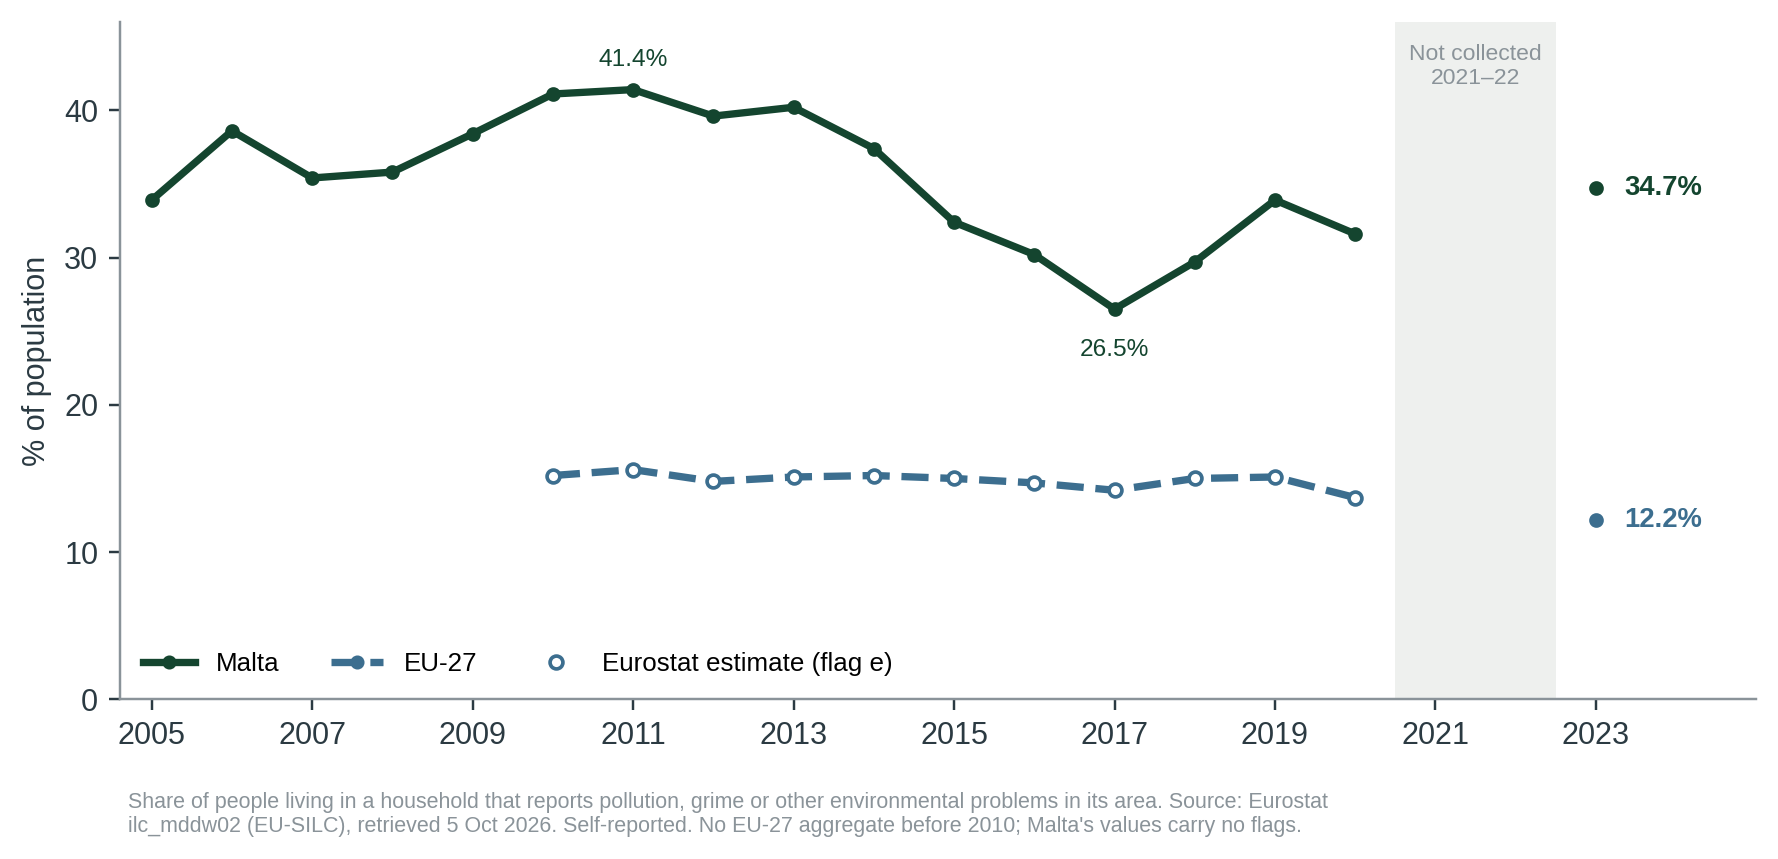
- Up since 2017, below the 2010–14 peak. The share was 41.4% in 2011 and 26.5% in 2017. At 34.7%, 2023 is 8.2 points above that low and the highest since 2014 (37.4%).
- Verdict: supported (high confidence). The statistic, the rank, the comparison and the wording all match Eurostat. A secondary sentence, that high earners were more affected, holds for 2023 but is loosely worded (sub-claim E).
- Supported
- Largely supported
- Not substantiated
- Misleading
- Contradicted
What would move the verdict up
None: Supported is the top of the scale.
What would move it down
A revision of Eurostat’s 2023 figures that removed Malta’s lead, or evidence that the Maltese result comes from a question, translation or sampling artefact rather than from what residents report.
IN THIS REPORT
1 The claim and what we could verify
The claim is Amphora Media’s own text, read in full on 5 October 2026 [1]. Amphora is a news outlet; we assess its wording, not any authority’s. The guidebook names no source for the figures and links none. Only the income sentence is attributed, to “the report”, which is not named. We identified the Eurostat data that reproduce the figures [2] and the Eurostat publications that report them in the same terms [5, 6].
| What Amphora says | Where | Access |
|---|---|---|
| “35% of people in Malta reported exposure to pollution in 2023 — the highest share in the EU.” | Introduction [1] | Read in full; no source given |
| “In 2023, more than a third of people (35%) in Malta reported exposure to pollution, grime, and other environmental problems. This is the highest share in the EU and nearly three times the EU average of 12%.” | Section “Is Malta becoming cleaner?” [1] | Read in full; no source given |
| “According to the report, high-earning households were more affected than low-earning ones.” | Same section [1] | Read in full; “the report” not named |
Likely source. Eurostat’s Statistics Explained article on the natural and living environment (last edited 14 August 2025) says Malta recorded “by far the highest share” (34.7%) of people reporting exposure to pollution, grime or other environmental problems, and names Malta among nine Member States where people at risk of poverty reported less (5.5 points lower) [5]. Eurostat’s news release of 1 September 2025 is headed “12% of EU population reported pollution in their area” [6]. Together they carry all three of Amphora’s statements. We cannot confirm that Amphora used them.
2 Method
Question. Are the 35%, the “highest in the EU” ranking and the comparison with a 12% EU average accurate, does “reported exposure to pollution” describe what was measured, and is the income statement right?
Evidence. This claim is statistical. We downloaded Eurostat’s ilc_mddw02 (updated 13 August 2026) and the at-risk-of-poverty rate ilc_li02 through the dissemination API on 5 October 2026 [2, 11], kept all Member States, years and Eurostat’s flags, and recomputed rank, ratios, trend and the income split with tools/cc-037-report/calc.py from data/cc-037/. We read Eurostat’s methodology note for the indicator [7], its 2025 article and news release [5, 6], and the EU legal acts that set how often the question is asked [8–10], all on 5 October 2026. Peer-reviewed literature was searched (Crossref, OpenAlex) for work comparing self-reported pollution with measurements.
Grades. Official statistics are grade C under our scale. Verdicts follow the five-point scale in Appendix A.
3 What the indicator measures
The indicator comes from the EU Statistics on Income and Living Conditions (EU-SILC), a household survey run by national statistics offices. One respondent answers for the household: does it have a problem with “pollution, grime or other environmental problems” in the local area, such as smoke, dust, unpleasant smells or polluted water? Eurostat then counts every person living in a household where the answer was yes, weighted to the population of private households; the indicator is that share [7]. It records whether the respondent considers this a problem for the household, and Eurostat sets no common standard for what counts as one [7].
Eurostat’s own publications describe the result as people “reporting exposure to pollution, grime or other environmental problems” [5] and speak of “self-reported exposure” [5]. Amphora’s wording follows that usage.
Self-reports and measurement overlap but do not coincide. In one Spanish cohort of 504 pregnant women, self-reported air-pollution annoyance was associated with modelled NO2 and VOC levels, but category-by-category agreement was low to moderate (11–72%) [3]. That is a conference abstract from another country and is context only.
Why there are no figures for 2021 and 2022
Until 2020 the question was asked, and the indicator published, every year. Since 2021 EU-SILC has run under Regulation (EU) 2019/1700, which collects some items every year and others every three or six years [8]. The pollution question (variable HS180) is now part of the three-yearly module “Labour market and housing” [9], which the Commission’s rolling plan schedules for 2023 and 2026 [10]. Eurostat’s release says the same: the data come from a module “collected every 3 years” [6]. So 2023 is the first year of the new cycle, and the next figures will be for 2026.
4 What the data show
| Indicator | Malta | EU / comparison | Source | Grade |
|---|---|---|---|---|
| Reporting pollution, grime or other problems, 2023 | 34.7% | 12.2% (EU-27) | Eurostat [2] | C |
| Ratio to EU-27 average, 2023 | 2.84× | 2.92× on the rounded 35% and 12% | calculated | C |
| Rank among 27 Member States, 2023 | 1st | Greece 20.5%, Germany 16.8% (low reliability), France 16.0% | calculated | C |
| Years ranked first, 2005–2023 | 17 of 17 | 25–27 Member States with data each year | calculated | C |
| Change since the 2017 low | +8.2 points | 26.5% → 34.7%; highest since 2014 (37.4%) | calculated | C |
| Above / below 60% of median income, 2023 | 35.6% / 30.1% | 11.8% / 14.0% (EU-27) | Eurostat [2] | C |
| People above 60% of median income, 2023 | 83.4% | at-risk-of-poverty rate 16.6% (EU-27 16.2%) | Eurostat [11] | C |
All values in data/cc-037/checks.csv. Member States with data: 25 in 2005–06 (none for Croatia and Romania), 26 in 2007–09 (none for Croatia) and in 2020 (none for Poland), 27 in the other years. No data for 2021 and 2022 (section 3).
5 Where the evidence points different ways
Q1 Is “reported exposure to pollution” an accurate description?
ACCURATE; EUROSTAT’S WORDINGEVIDENCE FOR THE CLAIM'S IMPRESSION
Eurostat itself describes the indicator as people “reporting exposure to pollution, grime or other environmental problems” [5]. Amphora’s body text uses the full wording, and “reported” makes clear that this is what people said.
EVIDENCE AGAINST
Read alone, “exposure to pollution” could be taken as measured exposure, which the survey does not provide, and “grime” covers dirt that is not pollution in the regulatory sense.
Q2 Does the ranking reflect real conditions or a survey effect?
UNCERTAIN; RANKING IS ROBUSTEVIDENCE FOR THE CLAIM'S IMPRESSION
Malta has led the EU in all 17 survey years with data, and in 2023 by 14.2 points, so a single year’s sampling noise does not explain it.
EVIDENCE AGAINST
Self-reports can reflect expectations as well as conditions (general context; one study found only partial agreement with measurements [3]), and Eurostat sets no common standard for what counts as a problem [7]. We found no study that separates these effects for Malta.
6 Testing the claim
| Sub-claim | What the evidence shows | Rating |
|---|---|---|
| A. 35% of people in Malta reported pollution in 2023 | Eurostat: 34.7% [2]. | ACCURATE |
| B. The highest share in the EU | First of 27; Greece second at 20.5%; first in all 17 years with data [2]. | ACCURATE |
| C. Nearly three times the EU average of 12% | 12.2% EU-27; ratio 2.84 (2.9 on the rounded figures) [2]. | ACCURATE |
| D. “Exposure to pollution” (intro wording) | Eurostat’s own wording, shortened: it describes the indicator as people “reporting exposure to pollution, grime or other environmental problems” [5]. The survey records reported problems, not measured exposure [7]. | ACCURATE (OFFICIAL WORDING) |
| E. High earners more affected than low earners | 2023: 35.6% above vs 30.1% below 60% of median income [2]. But the “above” group is 83.4% of people, not high earners [11]; the gap reversed in 6 of 17 years; EU-wide it runs the other way. | LARGELY ACCURATE |
The income sentence (E). Eurostat splits the indicator at 60% of median equivalised income, the at-risk-of-poverty line, not by earnings bands [7]. In Malta in 2023, 16.6% of people were below that line [11], so the “above” group is 83.4% of the population; most of it is not “high-earning”. For 2023 the direction Amphora gives is right, and Eurostat notes it: Malta is one of nine Member States where people at risk of poverty reported less (5.5 points lower) [5]. It is not a stable pattern: in 6 of the 17 survey years (2006, 2007, 2009, 2010, 2016 and 2018) people below the line reported more. Across the EU-27 the pattern runs the other way (14.0% below, 11.8% above, 2023) [2]. Eurostat’s article gave 14.1% and 11.9% from an earlier extraction [5].
7 Verdict and requests for evidence
The figures, rank, comparison and wording match Eurostat’s data and Eurostat’s own description of them. Confidence: high.
Why. (1) The 35%, the first place in the EU and the comparison with the EU average all reproduce from Eurostat’s own data. (2) The result is stable across 17 survey years. (3) “Reported exposure to pollution” is Eurostat’s own description of the indicator, shortened; it is context for readers, not a flaw in the statement. (4) Confidence is high because the data, Eurostat’s methodology note and its own publications agree. The verdict applies to the claim under review, the intro line and its restatement in the body. The income sentence is a separate statement, rated on its own (E).
What this verdict does not say. It does not say that Malta’s measured pollution is the highest in the EU, that any particular source is to blame, or that any authority has failed. It addresses only whether Amphora’s statement is accurate.
Evidence we are asking for
- The source Amphora refers to as “the report” for the income split, and the source of the 35% (neither is named in the guidebook).
- Measured exposure data (EEA air quality, noise maps) that could be set beside this perception indicator in a future check.
8 Limitations
- The indicator is self-reported and cannot be read as measured exposure.
- We did not compare it with measured concentrations in Malta; no such comparison was part of the claim.
- The question was not asked in 2021–2022 (three-yearly module since 2021); 2023 is the latest year and the next is 2026.
- Amphora names no source; the match to Eurostat’s data and publications is ours, through the figures (35%, 12%, the income split).
- Eurostat flags the EU-27 values for 2010–2020 as estimates and Germany’s 2023 value as of low reliability; Malta’s values carry no flags.
- The Aguilera abstract [3] is a conference abstract from Spain; it was read as an abstract only and is context.
References
- [1] Amphora Media (12 May 2026). 2026 Election Guidebook: The Environment. (Read in full, 5 Oct 2026; no source named.) https://www.amphora.media/2026/05/2026-election-guidebook-the-environment
- [2] Eurostat. ilc_mddw02 Pollution, grime or other environmental problems (EU-SILC); updated 13 Aug 2026, retrieved 5 Oct 2026, with flags. doi:10.2908/ILC_MDDW02. https://ec.europa.eu/eurostat/databrowser/view/ilc_mddw02/default/table
- [3] Aguilera I., Sunyer J., Fernández-Patier R., Jacquemin B., Aguirre A., Bomboi T. (2007). Self-reported traffic, air pollution annoyance, and GIS-modeled exposure to air pollutants in pregnant women. Epidemiology 18(5):S43. doi:10.1097/01.ede.0000276553.96485.21. (Conference abstract read.) https://doi.org/10.1097/01.ede.0000276553.96485.21
- [4] Miżien. Data and calculations: data/cc-037/; tools/cc-037-report/calc.py.
- [5] Eurostat. Quality of life indicators – natural and living environment. Statistics Explained; last edited 14 Aug 2025 (data from March 2025). Read 5 Oct 2026. https://ec.europa.eu/eurostat/statistics-explained/index.php?title=Quality_of_life_indicators_-_natural_and_living_environment
- [6] Eurostat (1 Sep 2025). 12% of EU population reported pollution in their area. Eurostat news. Read 5 Oct 2026. https://ec.europa.eu/eurostat/web/products-eurostat-news/w/ddn-20250901-1
- [7] Eurostat. EU statistics on income and living conditions (EU-SILC) methodology – environment of the dwelling. Statistics Explained; last edited 10 Aug 2023. Read 5 Oct 2026. https://ec.europa.eu/eurostat/statistics-explained/index.php?title=EU_statistics_on_income_and_living_conditions_(EU-SILC)_methodology_-_environment_of_the_dwelling
- [8] Regulation (EU) 2019/1700 of the European Parliament and of the Council of 10 October 2019 (IESS framework regulation), Annex IV point 2. OJ L 261I, 14.10.2019, p. 1. Read via the EU Publications Office, 5 Oct 2026. https://data.europa.eu/eli/reg/2019/1700/oj
- [9] Commission Delegated Regulation (EU) 2022/29 of 28 October 2021 (variables on labour market and housing), Annex: HS180. OJ L 7, 12.1.2022, p. 1. Read via the EU Publications Office, 5 Oct 2026. https://data.europa.eu/eli/reg_del/2022/29/oj
- [10] Commission Delegated Regulation (EU) 2020/256 of 16 December 2019 (multiannual rolling planning), Annex I. OJ L 54, 26.2.2020, p. 1. Read via the EU Publications Office, 5 Oct 2026. https://data.europa.eu/eli/reg_del/2020/256/oj
- [11] Eurostat. ilc_li02 At-risk-of-poverty rate by poverty threshold, age and sex (EU-SILC); updated 17 Sep 2026, retrieved 5 Oct 2026. https://ec.europa.eu/eurostat/databrowser/view/ilc_li02/default/table
Appendix A: series standards and verdict scale
Every investigation in this series follows the same rules so that verdicts are comparable and challengeable.
| Verdict | Meaning |
|---|---|
| SUPPORTED | Evidence consistently backs the claim as stated. |
| LARGELY SUPPORTED | Backed by the evidence, with minor caveats that do not change the substance. |
| NOT SUBSTANTIATED | Stated more strongly than the evidence offered or available allows. May be true in some conditions but has not been shown. |
| MISLEADING | Omits material facts so that the overall impression is inaccurate, even if individual statements are defensible. |
| CONTRADICTED | The available evidence points against the claim. |
Confidence
High: multiple independent lines of evidence agree. Moderate: evidence is relevant but incomplete or indirect. Low: evidence is thin, second-hand or conflicting.
Evidence grades
A experiment · B observational study with a control or gradient · C review, guidance or official statistics · D assertion or anecdote. ◆ marks a source known only second-hand.
Standards
- Quote the speaker, not the headline, with outlet and date, and link the original where possible.
- Separate the claim from the evidence offered for it, and say who made which statement.
- Grade the evidence and show differing views side by side where the evidence is unsettled.
- State what we could not access or verify, and what would change the verdict either way.
- Ask for the missing evidence in specific, answerable requests.
- Offer a right of reply where a check finds a claim Not substantiated, Misleading or Contradicted (or a pledge Not measurable, Off track or Missed), before wider circulation, and append responses.
- Correct errors openly with a version number and change log.
- Whistle-blow only on evidence: a verdict of Misleading or Contradicted requires documents or data that can be shown, not inference.
- Check every side. Government, opposition, NGOs and developers are held to the same standard.
Appendix B: revision log
| Version | Date | Change |
|---|---|---|
| 1.0 | 5 Oct 2026 | First issue. No right of reply needed for a Supported verdict. |
| 1.1 | 5 Oct 2026 | Corrections: (1) Amphora names no source and links none; the cover, flyer, references and claim record no longer say it cites Eurostat, and section 1 now says that only the income sentence is attributed, to an unnamed “report”. Likely source added: Eurostat’s Statistics Explained article (last edited 14 Aug 2025) and news release (1 Sep 2025) [5, 6]. (2) Sub-claim D re-rated Accurate (official wording): “reporting exposure to pollution” is Eurostat’s own description of the indicator, so the verdict no longer treats it as a caveat. (3) Sub-claim E re-rated Largely accurate: the split is above against below 60% of median income, and the “above” group is 83.4% of people; the direction reversed in 6 of 17 years; EU-wide it runs the other way (14.0% below, 11.8% above). (4) TL;DR point 4 “Not a recent deterioration” replaced: +8.2 points since 2017, the highest since 2014 (37.4%). (5) The 2021–22 gap explained: the question moved to a three-yearly EU-SILC module collected in 2023 and 2026 [8–10]; removed from the requests. (6) “Move the verdict up” box: none (top of the scale); a Eurostat revision or a survey artefact moved to “down”. (7) Unsourced sentence on density and traffic removed; the indicator is now defined precisely (people living in households where the respondent reports the problem) [7]. (8) Eurostat flags kept (EU-27 2010–2020 estimated; Germany 2023 low reliability); Figure 1 no longer bridges 2021–22; Figure 2 labels to one decimal; table note kept with its table; cover status “draft · no right of reply needed”. Verdict and confidence unchanged. |
| 1.2 | 6 Oct 2026 | Clarification after the 6 Oct 2026 audit: an unsourced sentence on perception reworded as general context, tied to the cited study [3]. Verdict unchanged; no right of reply needed. |
Sources and archived copies
-
2026 Election Guidebook: The Environment, Amphora Media, 12 May 2026.
Original · Archived copy
The claim. Read in full on 5 Oct 2026. No source named or linked. -
Pollution, grime or other environmental problems (ilc_mddw02), Eurostat, updated 13 Aug 2026.
Original · fetched and fingerprinted 2026-10-10; no public snapshot yet
Primary evidence. Retrieved 5 Oct 2026, with Eurostat's flags. -
Quality of life indicators – natural and living environment (Statistics Explained), Eurostat, last edited 14 Aug 2025.
Original · fetched and fingerprinted 2026-10-10; no public snapshot yet
Likely source of Amphora's three statements (34.7%, 'by far the highest share', Malta 5.5 points lower for people at risk of poverty). Read 5 Oct 2026. -
12% of EU population reported pollution in their area, Eurostat, 1 Sep 2025.
Original · Archived copy
News release; the 12% EU headline; data from a module 'collected every 3 years'. Read 5 Oct 2026.
Right of reply
Not needed: this check finds the claim supported. A right of reply is sought when a check finds a claim Not substantiated, Misleading or Contradicted.
Connections
How this claim relates to the others: who made it, the themes it shares with other claims, and the patterns it shows. A connection is a reason to read two checks side by side. It does not make either one right or wrong. How connections are found.
Who made it
Other claims by Amphora Media 1
Linked directly 0
Not yet linked to another claim by a theme.
Similar wording
Claims whose own words overlap with this one, with the words they share. Found by comparing the wording of the claims, not their verdicts; a lead to read them together, not a finding.
Timeline
What was said, what was published before and after it, and each step of this check, in date order. Statements and sources carry the date they were published. The steps of the check carry the date the research was done, from the check's research log. Other statements by the same body on the same topic show whether a position was repeated, changed or corrected.
2007
- 2007 Evidence published Self-reported traffic, air pollution annoyance, and GIS-modeled exposure to air pollutants in pregnant women (Aguilera et al., Epidemiology 18:S43), Epidemiology
2019
- 10 October 2019 Evidence published Regulation (EU) 2019/1700 establishing a common framework for European statistics relating to persons and households (IESS), European Parliament and Council
- 16 December 2019 Evidence published Commission Delegated Regulation (EU) 2020/256: multiannual rolling planning (IESS), European Commission
2021
- 28 October 2021 Evidence published Commission Delegated Regulation (EU) 2022/29: variables on Labour market and housing (EU-SILC), European Commission
2025
- 1 September 2025 Statement published 12% of EU population reported pollution in their area (Eurostat news), Eurostat
2026
- 12 May 2026 The statement Amphora Media (this claim)
- May 2026 Reported 2026 Election Guidebook: The Environment, Amphora Media
- 4 October 2026 Added to the claims to check
- 5 October 2026 Check started Check started. Eurostat ilc_mddw02 downloaded through the dissemination API; Crossref and OpenAlex searched for studies comparing self-reported and measured pollution (Aguilera et al. 2007, conference abstract).
- 5 October 2026 Exact wording found Verbatim wording found on the Amphora page. Eurostat ilc_mddw02 downloaded and recomputed: Malta 34.7%, EU-27 12.2%, first of 27, first in 17 of 17 survey years.
- 5 October 2026 Version 1.0: first issue First issue. Verdict Supported (high confidence); no right of reply needed.
- 5 October 2026 Note Independent review and corrections. Eurostat ilc_mddw02 re-downloaded with Eurostat's flags (2,019 rows, values unchanged; matches the review's own download); ilc_li02 downloaded (Malta at-risk-of-poverty rate 16.6% in 2023). Read Eurostat's Statistics Explained article (last edited 14 Aug 2025), its news release of 1 Sep 2025 and its EU-SILC methodology note on the environment of the dwelling; Regulation (EU) 2019/1700 (Annex IV) and Delegated Regulations (EU) 2020/256 and 2022/29 read via the EU Publications Office (Cellar): the pollution item (HS180) is in the three-yearly module 'Labour market and housing', collected in 2023 and 2026. Amphora page re-fetched (hashes in archive/manifest.csv and literature/CC-037/notes.md); it names no source and links none. A Wayback capture of 16 Jun 2026 is listed but could not be opened from this network.
- 5 October 2026 Version 1.1: corrections Corrections: (1) Amphora names no source and links none; the cover, flyer, references and claim record no longer say it cites Eurostat, and section 1 now says that only the income sentence is attributed, to an unnamed “report”. Likely source added: Eurostat’s Statistics Explained article (last edited 14 Aug 2025) and news release (1 Sep 2025) [5, 6]. (2) Sub-claim D re-rated Accurate (official wording): “reporting exposure to pollution” is Eurostat’s own description of the indicator, so the verdict no longer treats it as a caveat. (3) Sub-claim E re-rated Largely accurate: the split is above against below 60% of median income, and the “above” group is 83.4% of people; the direction reversed in 6 of 17 years; EU-wide it runs the other way (14.0% below, 11.8% above). (4) TL;DR point 4 “Not a recent deterioration” replaced: +8.2 points since 2017, the highest since 2014 (37.4%). (5) The 2021–22 gap explained: the question moved to a three-yearly EU-SILC module collected in 2023 and 2026 [8–10]; removed from the requests. (6) “Move the verdict up” box: none (top of the scale); a Eurostat revision or a survey artefact moved to “down”. (7) Unsourced sentence on density and traffic removed; the indicator is now defined precisely (people living in households where the respondent reports the problem) [7]. (8) Eurostat flags kept (EU-27 2010–2020 estimated; Germany 2023 low reliability); Figure 1 no longer bridges 2021–22; Figure 2 labels to one decimal; table note kept with its table; cover status “draft · no right of reply needed”. Verdict and confidence unchanged. all corrections
- 6 October 2026 Note Audit checks, no change to the report. (1) doi:10.2908/ILC_MDDW02 (reference 2) resolves through doi.org to Eurostat's databrowser page for ilc_mddw02 and DataCite lists it as Eurostat's dataset 'Pollution, grime or other environmental problems' (Crossref has no record, as expected for a DataCite DOI); kept. (2) The Amphora page shows '12 May 2026' as its post date (page re-fetched 6 Oct 2026), so claim date and sources date are the publication date; history dates are research dates. (3) The Wayback capture of 16 Jun 2026 now opens and carries the same wording and date. (4) The explicit status_note was removed from build_report.py; the derived status wording is the same ('no right of reply needed'), so the PDF is unchanged and the version stays 1.1.
- 6 October 2026 Version 1.2 1.2: clarification after the 6 Oct 2026 audit; verdict unchanged. Verdict in this version: Supported, high confidence.
- 6 October 2026 Evidence reviewed
- 6 October 2026 Clarification Section 5, Q2: the unsourced sentence 'Perception varies with expectations' reworded as general context tied to the cited study [3] (audit of 6 Oct 2026). all corrections
2027
- 6 October 2027 Coming up: Evidence review due Each finished check is reviewed against new evidence within a year.
Every change to this claim's record is public: history of the record.
Download the report and flyer