CC-034 · Air · Air quality & health
Air Quality Plan 'already yielding results'
Not substantiated Moderate confidence Draft: right of reply pending
Parts of this claim
The claim is split into parts that are tested separately, as in the report below. Each part has its own number.
- CC-034A The reform in the power generation sector has contributed to improvements in air qualityPower-station sulphur oxides −99.8% and nitrogen oxides −90%, 2014 to 2018 (−99.9% and −95% from 2008; 55% of the sulphur fall came before 2015) [5]; SO₂ in the air −83% at Żejtun (2008–12 to 2018–23); Kordin already 2.6 µg/m³ in 2014 [3]; nickel down at Kordin (plan) [2].
- CC-034B Grants for more sustainable transport have contributedThe plan gives uptake, not effect [2]. NO₂ at Msida −22%, matching the modelled −23% in road exhaust NOx from a newer fleet, which grants are one cause of [3, 5]; cars +31% [6].
- CC-034C Free school transport (from 2018) has contributedThe plan’s NO₂ fall of “around 10 µg/m³” at rush hour does not reproduce: peak to peak −1.0 in the EEA data, and its 2014–17 baseline cannot be matched; autumn 2018 had the highest morning NO₂ of 2013–2023; a sustained fall of 11.5 came from 2019 and cannot be tied to the measure; the term-time change matches the Attard background [2, 3].
- CC-034D Better ferry landing places and the fast ferry (2021) have contributedThe plan reports passengers only (1.6 million in 2018; about 42,000 in the fast ferries’ first month) [2]. No air data offered.
- CC-034E Free public transport for all (from October 2022) has contributedThe plan offers no measured effect [2]. In the year after it began, 10 of 11 station readings were higher; Msida PM10 +8.1 µg/m³, 90 days over 50 against 48 (one site, one year, no weather adjustment) [3].
- CC-034F Msida exceeded the PM10 daily limit in 2018 and 2023 (the plan’s reason)ERA’s reports: 41 and 52 days after natural deduction, 86 and 84 before; 35 allowed [4]. 2023 is the highest of 2015–2023 at the old Msida point; ERA’s 2024–25 counts (20, 23) are zone counts from other stations.
Claim Check 034 · Air quality
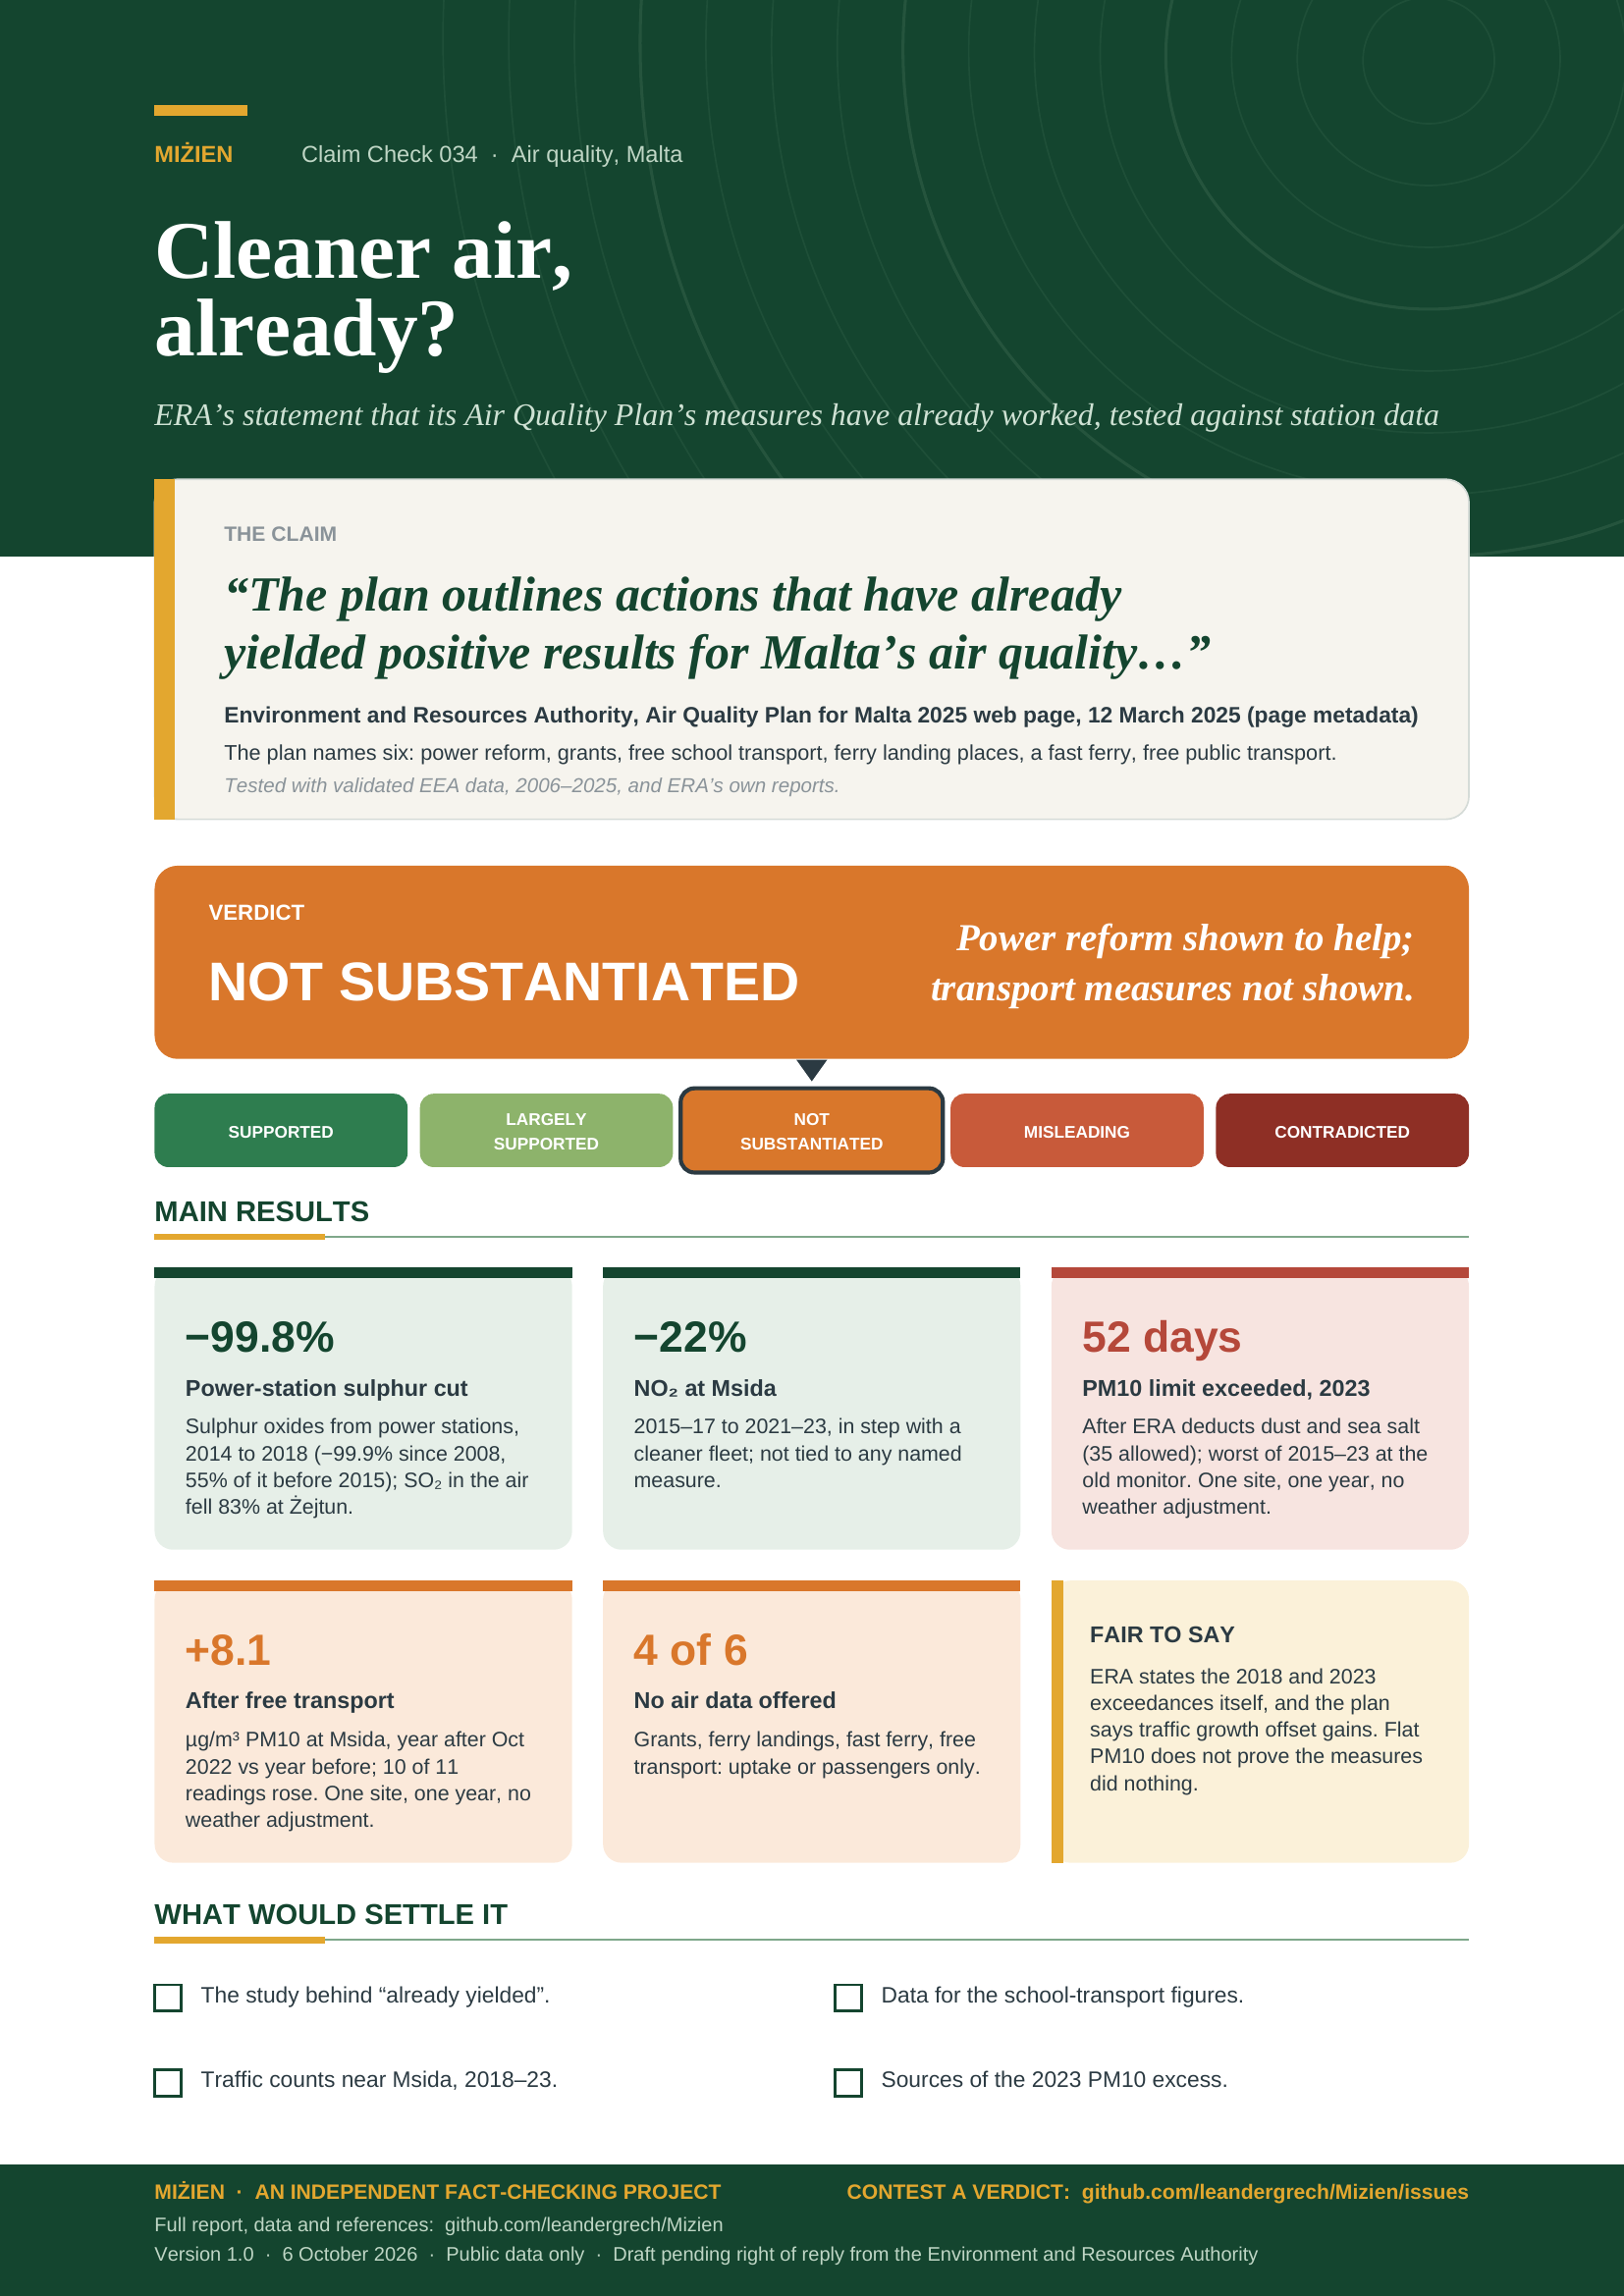
Cleaner air, already?
Testing ERA’s statement that measures in the Air Quality Plan have already improved Malta’s air
“The plan outlines actions that have already yielded positive results for Malta’s air quality…”
Environment and Resources Authority, Air Quality Plan for Malta 2025 web page, 12 March 2025 (page metadata).
The plan names six measures, from power-sector reform to free public transport for all.
Verdict: Not substantiated Power reform shown to help; transport measures not shown
Version 1.0 · 6 October 2026
TL;DR
The Environment and Resources Authority (ERA) says its Air Quality Plan “outlines actions that have already yielded positive results for Malta’s air quality” [1]. The plan names six, from “the reform in the power generation sector” to “free public transport for all” [2], and we rate the claim as applying to those six. We tested it against validated measurements from every ERA station (2006–2025), ERA’s reports to the European Environment Agency (EEA) and Malta’s emissions inventory.
- The power-sector reform did clean the air. Sulphur oxides from power stations fell 99.8% between 2014 and 2018, the reform years [5] (99.9% since 2008, though 55% of that fall came before 2015); sulphur dioxide in the air fell 83% at Żejtun [3].
- NO₂ and PM2.5 at the Msida roadside are lower than in 2015–17 (36.5 to 28.5 and 15.3 to 12.6 µg/m³, 2015–17 to 2021–23) [3], in step with a cleaner vehicle fleet [5]. The data cannot tie this to any named measure.
- PM10, the reason for the plan, did not improve. After ERA deducts dust and sea salt, Msida had 52 days over the daily limit in 2023 (35 allowed), the most of 2015–2023 at the old monitor, with the transport measures in place [4]. The monitor moved in 2024, so later counts are not comparable.
- The transport measures come with uptake figures, not results. The plan’s one test, of free school transport, does not reproduce in the EEA data; in the year after free public transport began, 10 of 11 station readings rose [3].
- Verdict: not substantiated (moderate confidence). Missing evidence, not proof that the measures did nothing. Pending right of reply from ERA.
- Supported
- Largely supported
- Not substantiated
- Misleading
- Contradicted
What would move the verdict up
A published analysis that isolates the transport measures’ effect, for example traffic counts past Msida and meteorologically normalised trends against a control site, showing lower pollution after they began: Largely supported.
What would move it down
Traffic or travel-survey data showing that the measures did not reduce car traffic in the harbour area, set beside the station data: Contradicted for those measures.
IN THIS REPORT
1 The claim and what we could verify
The statement is on ERA’s web page for the plan, dated 12 March 2025 in the page’s metadata [1]. The page says “actions” without listing them; the plan’s executive summary names them [2]. The claim record combines the two documents, so each is quoted with its own source below. The plan was approved under Article 51 of the Environment Protection Act (Cap. 549) [1]. What we rate. Read alone, “actions that have already yielded positive results” is met by any one action that worked, and the power-sector reform did. We read “actions” as the six measures in the plan’s executive summary [2]; that reading is ours, and the verdict applies to it.
| What was said | Where | Our access |
|---|---|---|
| “The plan outlines actions that have already yielded positive results for Malta’s air quality, measures committed to by the Government for imminent implementation, and additional proposed measures …” | ERA web page, Air Quality Plan for Malta 2025 [1] | Read in full (Wayback capture of 15 Aug 2025) |
| “…measures from other policy documents that have already contributed to improvements in air quality in Malta, such as the reform in the power generation sector, grants for more sustainable transport, free school transport, improvement of ferry landing places, a fast ferry link between the main islands and free public transport for all.” | Plan, executive summary, p. 3 [2] | Pages 3, 21–67, 91, 95 read; the rest skimmed (section 9) |
| The Msida station “exceeded the allowed number of exceedances for the daily limit value of particulate matter (PM10)”, on ERA’s assessment of 2018 and 2023 data. | ERA web page [1]; plan, p. 25 [2] | Page read in full; p. 25 read |
2 Method
Evidence. All validated measurements Malta reported to the EEA for PM10, PM2.5, nitrogen dioxide (NO₂), sulphur dioxide (SO₂) and carbon monoxide (CO), from every ERA station, 2006–2025 (85 files, retrieved 6 October 2026) [3]; ERA’s attainment reports for 2015–2025 (PM10 exceedances before and after deduction of natural sources) [4]; the emissions inventory [5]; car numbers [6]. Every figure is recomputed by tools/cc-034-report/calc.py from data/cc-034/ (see checks.csv). Attribution. Three controls: (1) background stations (the plan notes that natural sources affect “the entire monitoring network in a similar manner”, p. 25 [2], so Msida’s excess over rural Għarb or urban Żejtun and Attard removes shared dust, sea salt and weather); (2) ERA’s own deduction of Saharan dust and sea salt [4]; (3) before-and-after windows at the traffic site and the controls. We did not normalise for weather station by station [12] (section 9).
Time stamps. The EEA’s hourly values carry a Start time, the beginning of the hour on a fixed clock without daylight saving: all 22 days on which Malta’s clocks changed in 2013–2023 have 24 values, and Msida’s NO₂ peaks at Start 06 in summer and (but for 2014) 07 in winter, as traffic following local time gives on a fixed clock [3]; the EEA documents hourly times as UTC+1 [16] ◆. The plan states no convention for its hours; section 5.3 tests which its curves follow. Grades: official statistics C; the plan’s statements of effect without data D; peer-reviewed observational studies B. Verdicts follow Appendix A.
3 What moves Malta’s air
PM10 at Msida is mostly not exhaust. A source apportionment of 209 samples taken at the Msida traffic site in 2018 attributes 3.4% of PM10 to vehicle exhaust, 17% to tyre and brake wear and 18% to road dust and crustal material [7]; the plan’s account of the study adds sea salt (23%) and Saharan dust (21%) [2]. The authors found “no discernible trend” in Msida’s PM10 over the preceding decade and concluded that traffic policies will have “a minimal effect unless the non-exhaust emissions are adequately controlled” [7]. The inventory agrees: road exhaust PM10 fell from 82 t (2015) to 33 t (2023) while tyre, brake and road wear stayed at about 100 t [5]. So cleaner engines barely touch PM10; fewer vehicle-kilometres can. At rural Għarb, natural and regional sources make up most of the PM10 (the plan’s summary of [8] ◆). NO₂ is the clearest traffic signal: during the 2020 lockdowns monthly NO₂ at Msida was up to 54% below business as usual [9]. SO₂ and nickel trace the heavy fuel oil burned to 2015–17 [2].
4 What the data show
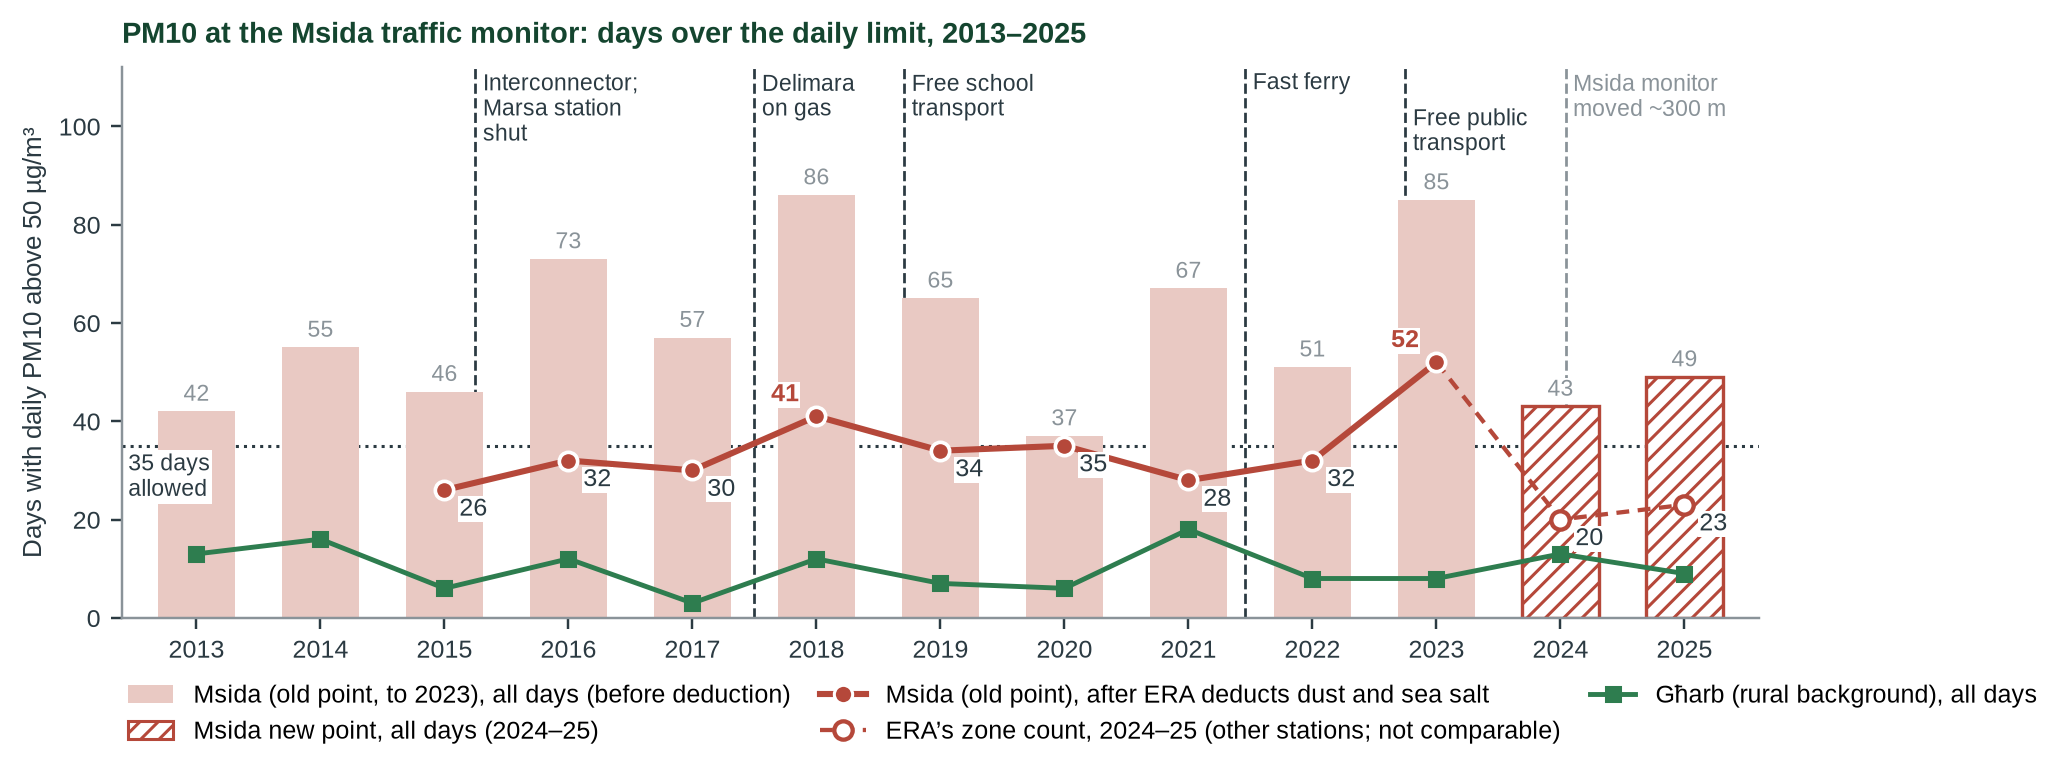
Figure 1. Days with PM10 above 50 µg/m³ at Msida (bars and Għarb: our counts from EEA daily values; red line: ERA’s count after deduction, dataflow G). Before the deduction of natural sources every year of 2013–2023 was over the 35 allowed [14]; after it, 2018 (41 days) and 2023 (52) were [4]. Għarb had fewer such days in 2023 (8) than in 2018 (12), so 2023 was not a dust year. The monitor moved about 300 m in January 2024 [13]: ERA’s 2024–25 counts (hollow) are zone counts from other stations, not comparable. Markers: start of each measure (plan, sections 10.11, 11); one gas-oil unit stayed on standby at Marsa (plan, p. 57).
| Indicator, Msida unless stated | 2015–17 | 2021–23 | Change | Grade |
|---|---|---|---|---|
| PM10, annual mean (µg/m³) | 40.1 | 40.2 | +0.1 | C |
| PM10, days over 50 after natural deduction (ERA), mean a year | 29.3 | 37.3 | +8.0 | C |
| PM2.5, annual mean (µg/m³) | 15.3 | 12.6 | −17% | C |
| NO₂, annual mean (µg/m³) | 36.5 | 28.5 | −22% | C |
| NO₂, Msida minus Attard (µg/m³) | 24.7 | 17.2 | −30% | C |
| NO₂ at Attard / Żejtun (urban background) | 11.8 / 14.2 | 11.4 / 13.7 | −0.5 / −0.5 | C |
Means of the three annual means per period, without 2020 (lockdowns); NO₂ at Msida had 83% valid data in 2015; with 2022–23 alone, 36.5 to 29.2 µg/m³ (−20%). Sources: EEA [3], ERA [4]; checks.csv [15].
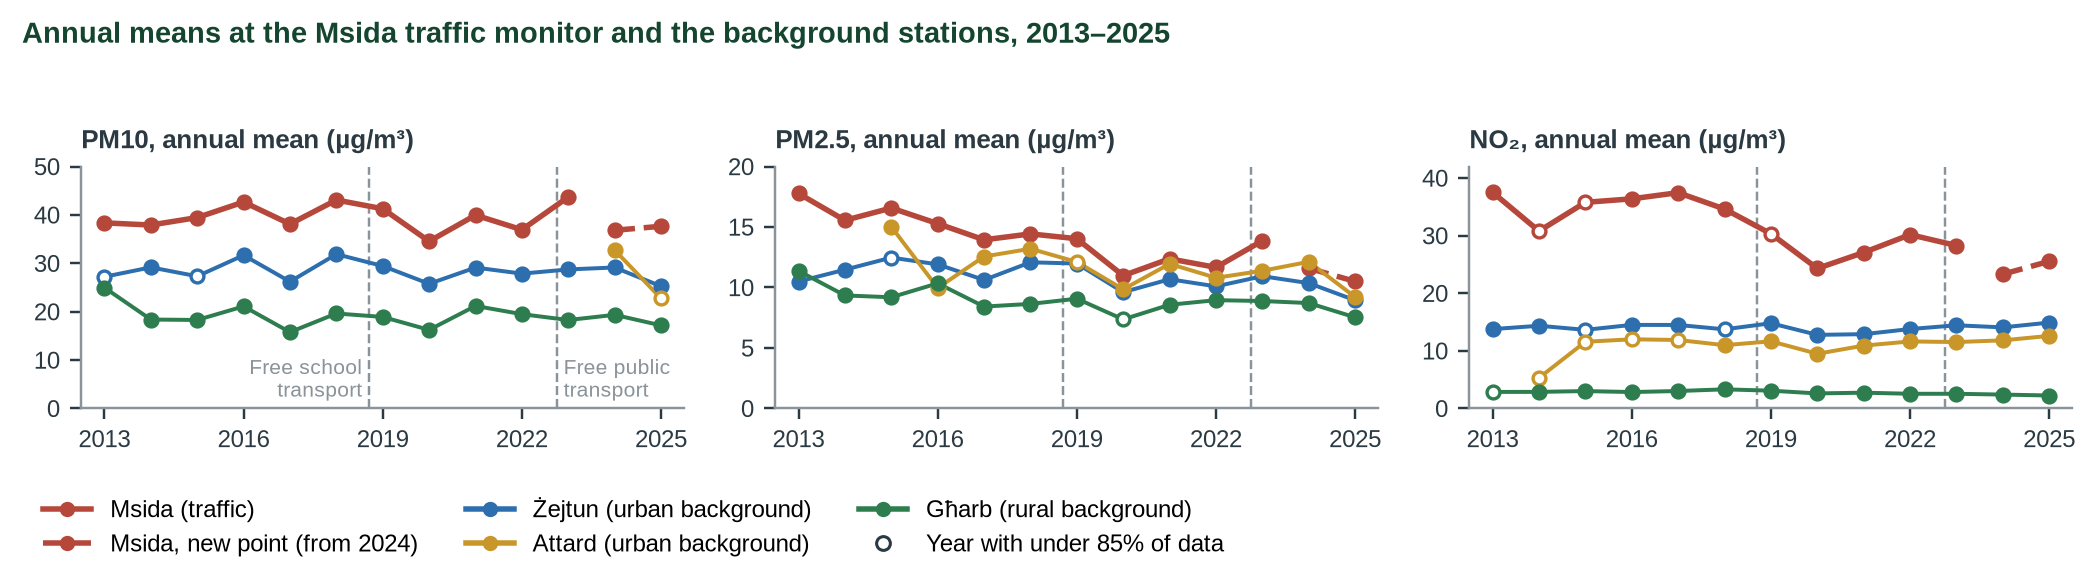
Figure 2. Annual means: roadside NO₂ and PM2.5 at Msida fell while the background stations changed little; PM10 did not fall. Hollow: under 85% of the year valid. Attard has PM10 only from 2024; the Msida monitor moved in January 2024 (dashed). Dashed verticals: Sept 2018 and Oct 2022 (see Figure 1). Source: EEA [3].
5 Measure by measure
5.1 Power-sector reform (2015–2017)
The interconnector to Sicily opened in April 2015, the Marsa power station was decommissioned in 2015 (one gas-oil unit stayed on standby) and from 2017 Delimara ran wholly on natural gas (plan, p. 57) [2]. The plan also credits an earlier shift to low-sulphur fuel for part of the fall in sulphur dioxide (pp. 41–42, 58). In 2008 the power sector produced 97% of Malta’s sulphur oxides and 58% of its nitrogen oxides. Its sulphur oxides fell from 10,100 t (2008) to 4,560 t (2014), before the reform, and to 10 t (2018): −99.8% from 2014, −99.9% from 2008, 55% of which came before 2015; nitrogen oxides fell 90% from 2014 (95% from 2008) and PM2.5 97% [5]. In the air, SO₂ at Żejtun, nearest Delimara, fell from 4.1 µg/m³ (2008–12, without 2011, when only 28.5% of the year was measured) to 0.7 (2018–23): −83%, or −68% from the 2013–16 mean. Since 1 January 2020 ships outside emission control areas have had to burn fuel with 0.5% sulphur, down from 3.5% [17]; the data cannot separate that from the reform [3]. SO₂ at Kordin, downwind of Marsa, was already 2.6 µg/m³ in 2014 (98% of the year measured) and 1.5 in 2015, so it shows no step at the reform; its higher 2010–13 values rest on 10–62% of the year, and the monitor closed in 2016 [3]. The plan shows the fall in its diffusion-tube maps and in nickel, a fuel-oil marker, at Kordin (pp. 57–58) [2]. NO₂, PM2.5 and PM10 at Żejtun did not change measurably (NO₂ 14.1 to 13.9 µg/m³) [3]. This measure is shown to have improved air quality, through sulphur dioxide and fuel-oil metals, though part of the fall came before it.
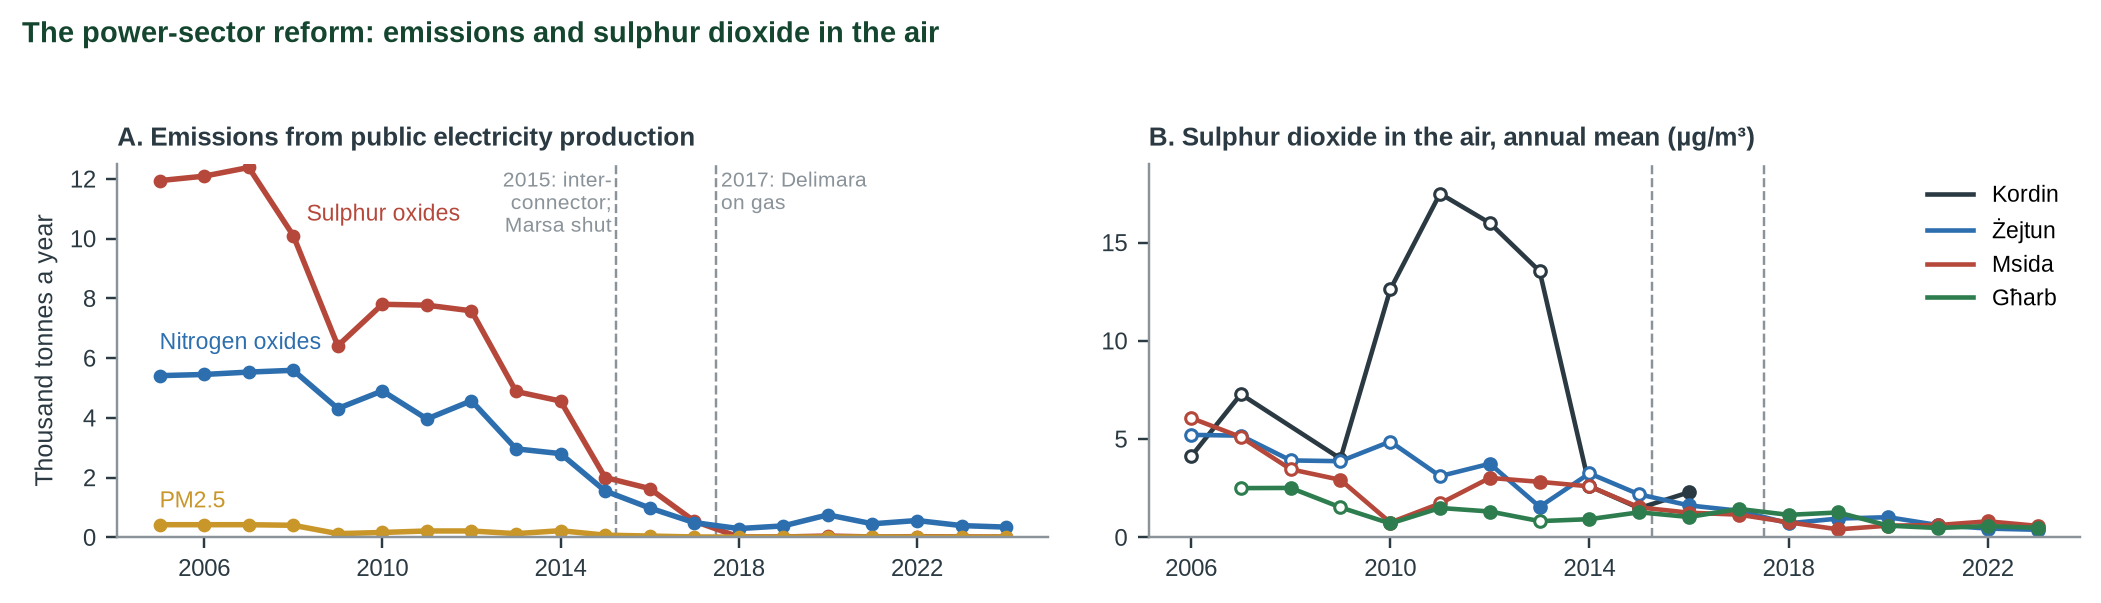
Figure 3. Power-station emissions (A: Eurostat, NFR 1A1a [5]) and sulphur dioxide in the air (B: EEA validated data, AirBase before 2013 [3]; hollow markers: under 85% of hours valid, as at Kordin 2010–13). Lines: interconnector and Marsa’s decommissioning (2015), Delimara on gas (2017) [2].
5.2 Grants for more sustainable transport (from 2010)
The plan lists the scrappage scheme and grants for electric, LPG and other vehicles and reports uptake, such as vehicles scrapped each year in 2017–21 (pp. 47–51) [2]; it gives no measured air effect and says the scheme “does not address the problem of the increasing number of vehicles on the road” (p. 47). NO₂ at Msida fell 22%, in line with the modelled inventory’s 23% fall in road-transport exhaust NOx (2,546 t in 2015 to 1,950 t in 2022) from a newer fleet [3, 5]. Grants are one reason a fleet renews; EU emission standards for new vehicles are another, and the data cannot separate them, while passenger cars rose 31% (256,096 in 2013 to 335,693 in 2025) [6]. Plausible, not shown.
5.3 Free school transport (from September 2018)
This is the only transport measure for which the plan offers air data: Msida’s average daily cycles of CO and NO₂ in October–December and June–August, 2014–17 against 2018–19. It reports the winter CO peak falling from about 1,200 to about 860 µg/m³ and NO₂ by “around 10 µg/m³” at rush hour, and that the falls “can also be attributed to other reasons” (pp. 59–60) [2]. We repeated the comparison with the EEA’s hourly data [3] and read the plan’s Figure 26 off the PDF (±1 µg/m³ at the peaks) [15]. Peaks. CO reproduces peak to peak (1.15 to 0.86 mg/m³), though its highest hour moves from Start 07 to 06 (06 in 2017–18, 07 in the other years). NO₂ does not: the EEA’s winter profile peaks at Start 07 in both periods, 62.3 then 61.3 µg/m³ (−1.0), whatever shift is applied to both periods; on weekdays only, 68.0 then 68.7 (+0.7).
The plan’s curves. Its peaks are about 70 (label 07, 2014–17) and 61 (label 08, 2018–19), a fall of about 8. The 2018–19 curves match the EEA data (RMSE 0.2 µg/m³, winter and summer) only if the plan’s label is the EEA’s Start plus one hour (hour-ending); with the EEA’s labels the error is 7.0 and 5.3. The 2014–17 curves match under neither (best RMSE 5.0 winter, 2.7 summer; no subset of years 2013–2019 does better than 3.9 for winter): the plan’s peak of about 70 compares with 62.3 in the EEA’s all-days profile and 68.0 on weekdays only. So the plan’s gap sits in its 2014–17 baseline, whose hour convention and data basis we cannot establish; a one-hour offset between the periods alone gives a fall of this size (62.3 at Start 07 in 2014–17 against 54.8 an hour earlier in 2018–19: −7.5).
Further tests. (1) Sustained fall: Msida’s weekday-morning NO₂ in October–December averaged 60.4 µg/m³ in 2013–17 and 48.9 in 2019–23, a fall of 11.5, similar to the plan’s “around 10” [3]. But the step came in 2019: October–December 2018, the first term with the measure, was the highest of 2013–2023 (70.3, against 54.3 in 2017) (Figure 4); the later window includes the 2020–21 lockdown years, and there is no control for fleet renewal. (2) CO was falling from 2014, before the measure, and rose slightly in 2018. (3) Term against summer holidays, morning NO₂ fell 2.5 µg/m³ more in term time at Msida and 2.7 more at Attard, which we use as a control for city-wide change, and rose 2.8 at Żejtun [3]. Not shown.
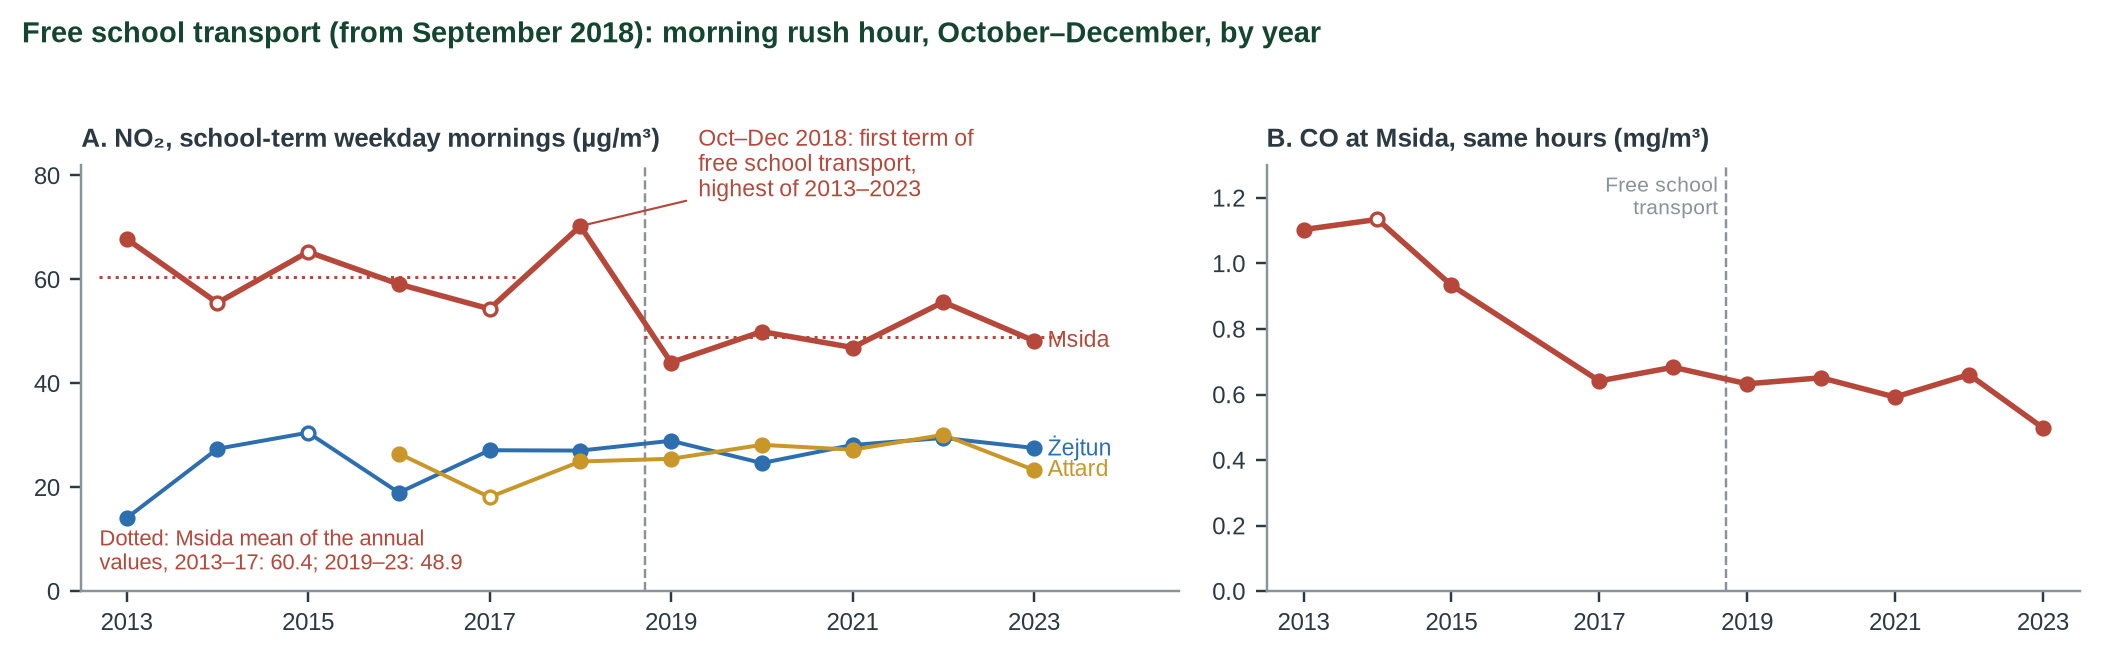
Figure 4. Weekday mornings (07:00–09:59 Start) in October–December [3]; a step down from autumn 2018 would be expected if free school transport had cut the school run past Msida. Hollow markers: under 85% of the mornings’ hours valid (Msida NO₂ 2014: 57%, 2015: 73%, 2017: 84%). Dotted: Msida means 2013–17 and 2019–23. The fixed window is shaky for CO, whose peak hour moves between 06 and 07; no CO at Attard or Żejtun; 2016 CO has no valid hours.
5.4 Ferry landing places and the fast ferry (2021)
The plan reports passengers, 1.6 million on the harbour ferries in 2018 and about 42,000 on the two fast ferries in their first month (pp. 62, 65), and expects fewer car journeys [2]. It gives no air-quality data for either. PM10 at Msida after June 2021 was no lower than before (Figure 1). No evidence offered.
5.5 Free public transport for all (from 1 October 2022)
The plan describes the measure and says it “should further encourage the public to use such modes” (p. 65) [2]; it offers no measured effect. In the 12 months after it began, PM10 at Msida averaged 44.4 µg/m³ against 36.3 in the 12 months before, with 90 days over 50 µg/m³ against 48; NO₂ was flat (29.2 to 29.5 µg/m³). Of 11 station and pollutant pairs with a full year on both sides, 10 were higher and one (PM10 at Għarb) 0.1 µg/m³ lower [3]. One year at one site, unadjusted for weather, is a weak test, and local sources the measures do not target also moved: inventory PM10 from construction and demolition rose from 80 t (2013) to 370 t (2023) [5], and the Msida Creek works lie 112 m from the old monitor [13] (we could not verify when work near it began). Elsewhere the evidence is mixed: Luxembourg’s free public transport (March 2020) cut road-transport CO₂ by an estimated 5.9%, with larger effects for nitrogen oxides [10], while Spain’s large fare discounts of 2022 produced “no evidence” of better air quality [11]. In Malta the measure has not shown up in any station’s data (daily values; St Paul’s Bay is left out because monitoring began in 2022, and Attard had no PM10 monitor before 2024; no weather adjustment). Not shown.
6 Where the evidence points different ways
Did the named transport measures lower NO₂ at Msida?
POSSIBLE; NOT ATTRIBUTABLEEVIDENCE FOR THE CLAIM'S IMPRESSION
NO₂ at the Msida roadside fell 22% between 2015–17 and 2021–23 and its excess over the background 30%, in a period with free school transport, the grants and the fast ferry; weekday-morning NO₂ in October–December fell 11.5 µg/m³ between 2013–17 and 2019–23, close to the plan’s “around 10” [3].
EVIDENCE AGAINST
The fall matches the inventory’s −23% in road-transport exhaust NOx from fleet renewal under EU standards [5]; the first school term with free transport was the highest since 2013 and the step down came in 2019; no traffic counts or surveys tie the fall to any measure; cars +31% [6].
7 Testing the claim
| Sub-claim | What the evidence shows | Rating |
|---|---|---|
| A. The reform in the power generation sector has contributed to improvements in air quality | Power-station sulphur oxides −99.8% and nitrogen oxides −90%, 2014 to 2018 (−99.9% and −95% from 2008; 55% of the sulphur fall came before 2015) [5]; SO₂ in the air −83% at Żejtun (2008–12 to 2018–23); Kordin already 2.6 µg/m³ in 2014 [3]; nickel down at Kordin (plan) [2]. | SUPPORTED |
| B. Grants for more sustainable transport have contributed | The plan gives uptake, not effect [2]. NO₂ at Msida −22%, matching the modelled −23% in road exhaust NOx from a newer fleet, which grants are one cause of [3, 5]; cars +31% [6]. | PLAUSIBLE, NOT SHOWN |
| C. Free school transport (from 2018) has contributed | The plan’s NO₂ fall of “around 10 µg/m³” at rush hour does not reproduce: peak to peak −1.0 in the EEA data, and its 2014–17 baseline cannot be matched; autumn 2018 had the highest morning NO₂ of 2013–2023; a sustained fall of 11.5 came from 2019 and cannot be tied to the measure; the term-time change matches the Attard background [2, 3]. | NOT SHOWN |
| D. Better ferry landing places and the fast ferry (2021) have contributed | The plan reports passengers only (1.6 million in 2018; about 42,000 in the fast ferries’ first month) [2]. No air data offered. | NO EVIDENCE OFFERED |
| E. Free public transport for all (from October 2022) has contributed | The plan offers no measured effect [2]. In the year after it began, 10 of 11 station readings were higher; Msida PM10 +8.1 µg/m³, 90 days over 50 against 48 (one site, one year, no weather adjustment) [3]. | NOT SHOWN |
| F. Msida exceeded the PM10 daily limit in 2018 and 2023 (the plan’s reason) | ERA’s reports: 41 and 52 days after natural deduction, 86 and 84 before; 35 allowed [4]. 2023 is the highest of 2015–2023 at the old Msida point; ERA’s 2024–25 counts (20, 23) are zone counts from other stations. | ACCURATE |
The speaker’s own reasoning. For five of the six measures the plan counts what was done (grants paid, passengers carried) as the result, yet for new measures its Annex I says “all efforts will be made to quantify the improvement in air quality” (p. 95) [2]; past measures have not been held to that standard.
8 Verdict and requests for evidence
Power-sector reform is shown to have improved the air; the five transport measures named have not been. Confidence: moderate. Missing evidence, not evidence against.
Why. (1) For the power-sector reform the plan and independent data agree. (2) For the five transport measures the plan offers uptake figures or nothing, and its one test does not reproduce. (3) NO₂ and PM2.5 at the roadside improved, but in step with fleet renewal as much as with any named measure, and PM10, the pollutant the plan exists to address, did not: 2023, with the transport measures in place, was the worst year of 2015–2023 at the old monitor after natural deductions. Read as the plan’s list of six, the claim is stated more strongly than the evidence allows: Not substantiated.
Why not Largely supported. One of the six measures has effect evidence (the power-sector reform); for the other five there is none, and the one test among them, free school transport, does not reproduce. That is most of the list, not a minor caveat. Why not Misleading or Contradicted. ERA’s page states the 2018 and 2023 exceedances as the reason for the plan, and the plan says traffic growth offset gains; and flat or worse PM10 does not prove the measures did nothing, with 31% more cars. Why moderate confidence. The data are extensive and validated, but there is no weather normalisation or traffic data to settle attribution.
What this verdict does not say: that the measures were poor policy, that Malta’s air has not improved (SO₂, NO₂ and PM2.5 have), or anything about the plan’s future measures. A supportable statement: Power-sector reform has cut sulphur dioxide sharply; roadside NO₂ and PM2.5 are lower than in the mid-2010s, but we have not measured how much is due to transport measures, and PM10 at Msida has not improved.
Evidence we are asking for
- For each of the six measures, the data or study behind “already yielded positive results”.
- The data behind the plan’s Figures 25–26: the hour convention and the days and years used for each period’s curves (we cannot reproduce its 2014–17 NO₂ curve), and how “around 10 µg/m³” was derived.
- Transport Malta traffic counts near Msida (for example Blata l-Bajda) and bus ridership, before and after September 2018 and October 2022.
- ERA’s analysis of the local sources of the 2023 PM10 excess at Msida, and a comparison of the old and new Msida sampling points.
9 Limitations
- Wording rated: the six measures the plan names (section 1); read as any action that worked, the power-sector reform alone would meet the claim. Weather and traffic: no weather normalisation [12] and no traffic data; the 2023 count (52 days) and the +8.1 µg/m³ after free public transport are single-site, single-year comparisons.
- Monitor and works: the Msida monitor moved about 300 m in January 2024 [13] with no overlapping valid data, so 2024–25 are not compared with earlier years; the Msida Creek works lie 112 m from the old monitor [13] (when work near it began is not verified). Our PM10 day counts differ from ERA’s by −1 to +4 a year; findings use ERA’s counts where they exist.
- Time labels: the plan states no hour convention; our tests are in section 5.3. The plan’s curves were read off the PDF (±1 µg/m³ at the peaks).
- Access: ERA’s page and plan were read from Wayback copies saved on 5 October 2026 (archive unreachable on 6 October). Plan pages 3, 21–67, 91 and 95 were read; pp. 4–20, 68–90 and 96–104 were skimmed for effect estimates of the six measures and none was found, so the plan gives no measured effect means in the pages read and skimmed. ERA’s consultation report was not read; two papers were read as abstracts; [8] is second-hand ◆.
References
- [1] Environment and Resources Authority. Air Quality Plan for Malta 2025 (web page; dated 12 Mar 2025 in the page metadata). Wayback capture of 15 Aug 2025. https://web.archive.org/web/20250815211515/https://era.org.mt/air-quality-plan-for-malta-2024/
- [2] Environment and Resources Authority (2025). Air Quality Plan for Malta (approved policy), 104 pp. Pages 3, 21–67, 91, 95 read; pp. 4–20, 68–90, 96–104 skimmed for effect estimates; printed page numbers. https://era.org.mt/wp-content/uploads/2025/02/DIGITAL-Air-Quality-Plan.pdf
- [3] European Environment Agency. Air Quality download service: Malta, PM10, PM2.5, NO₂, SO₂, CO, all sampling points (AirBase; E1a validated, to 2025). Retrieved 6 Oct 2026; SHA-256 in data/cc-034/eea_files.csv. https://eeadmz1-downloads-api-appservice.azurewebsites.net/
- [4] Environment and Resources Authority. Air Quality e-Reporting, dataflow G (attainment), Malta, 2015–2025 (Eionet CDR). Retrieved 6 Oct 2026. https://cdr.eionet.europa.eu/mt/eu/aqd/g/
- [5] Eurostat. env_air_emis, Air pollutants by source sector, Malta; updated 7 Sep 2026, retrieved 6 Oct 2026. https://ec.europa.eu/eurostat/databrowser/view/env_air_emis/default/table
- [6] Eurostat. road_eqs_carpda and road_eqs_carhab, passenger cars. Retrieved 6 Oct 2026. https://ec.europa.eu/eurostat/databrowser/view/road_eqs_carpda/default/table
- [7] Scerri M.M., Weinbruch S., Delmaire G., Mercieca N., Nolle M., Prati P., Massabò D. (2023). Exhaust and non-exhaust contributions from road transport to PM10 at a Southern European traffic site. Environmental Pollution 316:120569. (Abstract read.) https://doi.org/10.1016/j.envpol.2022.120569
- [8] Scerri M.M., Kandler K., Weinbruch S. (2016). Disentangling the contribution of Saharan dust and marine aerosol to PM10 levels in the Central Mediterranean. Atmospheric Environment 147:395–408. ◆ (Known from the plan’s summary.) https://doi.org/10.1016/j.atmosenv.2016.10.028
- [9] Fenech S., Aquilina N.J., Vella R. (2021). COVID-19-related changes in NO₂ and O₃ concentrations and associated health effects in Malta. Frontiers in Sustainable Cities 3:631280. (Full text read, CC BY.) https://doi.org/10.3389/frsc.2021.631280
- [10] Eibinger T., Fernando S. (2026). Zero fare, cleaner air? The causal effect of Luxembourg’s free public transportation policy on transport emissions. Environmental and Resource Economics 89:45. (Authors’ copy read, CC BY.) https://doi.org/10.1007/s10640-026-01090-5
- [11] Albalate D., Borsati M., Gragera A. (2024). Free rides to cleaner air? Examining the impact of massive public transport fare discounts on air quality. Economics of Transportation 40:100380. (Abstract read.) https://doi.org/10.1016/j.ecotra.2024.100380
- [12] Grange S.K., Carslaw D.C., Lewis A.C., Boleti E., Hueglin C. (2018). Random forest meteorological normalisation models for Swiss PM10 trend analysis. Atmospheric Chemistry and Physics 18:6223–6239. (Abstract read.) https://doi.org/10.5194/acp-18-6223-2018
- [13] Miżien, Claim Check 008: Msida sampling points from ERA’s dataset D 2025 (data/cc-008/aq_stations.csv); old to new point 301 m, old point to the nearest flyover vertex 112 m (data/cc-008/checks.csv).
- [14] European Environment Agency. Particulate matter (PM10): annual limit value for the protection of human health (Directive 2008/50/EC). Read 6 Oct 2026. https://www.eea.europa.eu/en/analysis/maps-and-charts/particulate-matter-pm10-annual-limit-value-for-the-protection-of-human-health-3
- [15] Miżien. Data and calculations: data/cc-034/, tools/cc-034-report/calc.py. The plan’s Figure 26 (p. 60) was read off the PDF by tools/cc-034-report/digitise_fig26.py.
- [16] European Environment Agency. Data dictionary, Air Quality e-Reporting time series (E1a, E2a): hourly date-time begin in UTC+1. ◆ (Seen in a web-search summary on 6 Oct 2026; page not opened.)
- [17] International Maritime Organization. IMO 2020 – cutting sulphur oxide emissions (0.50% m/m limit on ships’ fuel oil outside emission control areas from 1 Jan 2020, down from 3.50%). Read 6 Oct 2026. https://www.imo.org/en/MediaCentre/HotTopics/Pages/Sulphur-2020.aspx
Appendix A: series standards and verdict scale
Every investigation in this series follows the same rules so that verdicts are comparable and challengeable.
| Verdict | Meaning |
|---|---|
| SUPPORTED | Evidence consistently backs the claim as stated. |
| LARGELY SUPPORTED | Backed by the evidence, with minor caveats that do not change the substance. |
| NOT SUBSTANTIATED | Stated more strongly than the evidence offered or available allows. May be true in some conditions but has not been shown. |
| MISLEADING | Omits material facts so that the overall impression is inaccurate, even if individual statements are defensible. |
| CONTRADICTED | The available evidence points against the claim. |
Confidence
High: multiple independent lines of evidence agree. Moderate: evidence is relevant but incomplete or indirect. Low: evidence is thin, second-hand or conflicting.
Evidence grades
A experiment · B observational study with a control or gradient · C review, guidance or official statistics · D assertion or anecdote. ◆ marks a source known only second-hand.
Standards
- Quote the speaker, not the headline, with outlet and date, and link the original where possible.
- Separate the claim from the evidence offered for it, and say who made which statement.
- Grade the evidence and show differing views side by side where the evidence is unsettled.
- State what we could not access or verify, and what would change the verdict either way.
- Ask for the missing evidence in specific, answerable requests.
- Offer a right of reply where a check finds a claim Not substantiated, Misleading or Contradicted (or a pledge Not measurable, Off track or Missed), before wider circulation, and append responses.
- Correct errors openly with a version number and change log.
- Whistle-blow only on evidence: a verdict of Misleading or Contradicted requires documents or data that can be shown, not inference.
- Check every side. Government, opposition, NGOs and developers are held to the same standard.
Appendix B: revision log
| Version | Date | Change |
|---|---|---|
| 1.0 | 6 Oct 2026 | First issue. Draft verdict Not substantiated (moderate); pending right of reply from the Environment and Resources Authority. |
Sources and archived copies
-
Air Quality Plan for Malta 2025, ERA, 2025.
Original · not yet archived
Primary plan page; 403 to scripts. Page metadata gives datePublished 12 Mar 2025. -
Air Quality Plan for Malta 2025 (web page, Wayback capture of 15 Aug 2025), ERA, 15 Aug 2025.
Original · not yet archived
The claim: the plan outlines actions 'that have already yielded positive results for Malta's air quality'. Read in full on 6 Oct 2026 from the copy saved through the Wayback Machine on 5 Oct 2026 (the archive was unreachable from this network on 6 Oct); SHA-256 in literature/CC-034/references.bib. -
Air Quality Plan for Malta (approved policy, PDF), ERA, Jan 2025.
Original · Archived copy
104 pages, ISBN 978-9918-628-10-0; pages 3, 21-67, 91 and 95 read on 6 Oct 2026 from the Wayback copy saved 5 Oct 2026; pp. 4-20, 68-90 and 96-104 skimmed for effect estimates of the six measures (none found). Executive summary, p. 3: measures 'have already contributed to improvements in air quality'. Evidence of effect given only for the power-sector reform (pp. 57-58) and free school transport (pp. 59-60). -
Air Quality download service: Malta, PM10, PM2.5, NO2, SO2, CO, all sampling points, European Environment Agency, retrieved 6 Oct 2026.
Original · not yet archived
Primary evidence. AirBase (to 2012), E1a validated (2013-2025) and E2a (2026, not validated, not used for findings); 85 files, SHA-256 in data/cc-034/eea_files.csv. -
Air Quality e-Reporting, dataflow G (attainment), Malta, 2015-2025, ERA (Eionet Central Data Repository), retrieved 6 Oct 2026.
Original · Archived copy
ERA's own reported PM10 exceedances before and after deduction of natural sources: Msida 86/41 days (2018), 84/52 days (2023); 35 allowed. -
Air pollutants by source sector (env_air_emis); passenger cars (road_eqs_carpda, road_eqs_carhab), Eurostat, updated 7 Sep 2026; retrieved 6 Oct 2026.
Original · fetched and fingerprinted 2026-10-10; no public snapshot yet
Power-sector (NFR 1A1a) and road-transport emissions; car stock. -
IMO 2020: cutting sulphur oxide emissions, International Maritime Organization, read 6 Oct 2026.
Original · fetched and fingerprinted 2026-10-10; no public snapshot yet
Sulphur limit for ships' fuel oil outside emission control areas: 0.50% m/m from 1 January 2020, down from 3.50%. A co-driver of SO2 at Żejtun.
Right of reply
The body concerned has not yet been asked to reply. Its response will be published here, beside the verdict.
Connections
How this claim relates to the others: who made it, the themes it shares with other claims, and the patterns it shows. A connection is a reason to read two checks side by side. It does not make either one right or wrong. How connections are found.
Who made it
Environment and Resources Authority (ERA)
Other claims by Environment and Resources Authority (ERA) 7
- CC-002 Comino tree compensation (Largely supported)
- CC-036 Construction dust 'a nuisance, not a health issue' (not yet checked)
- CC-038 Saharan dust behind PM10 spikes (not yet checked)
- CC-051 'Over 30% of our seas protected' (Misleading)
- CC-052 Fish-farm slime 'promptly contained' (not yet checked)
- CC-057 1,649 compensation trees (not yet checked)
- CC-082 35 quarries for construction waste (not yet checked)
Linked directly 0
Not yet linked to another claim by a theme.
Same pattern
Pattern tags name a recurring way a claim can mislead. They describe the statement, not the speaker.
Input-as-outcome
Effort counted (trees planted, kilograms separated) is presented as if it were the result (trees surviving, recycling rate).
Timeline
What was said, what was published before and after it, and each step of this check, in date order. Statements and sources carry the date they were published. The steps of the check carry the date the research was done, from the check's research log. Other statements by the same body on the same topic show whether a position was repeated, changed or corrected.
2016
2018
- 2018 Earlier statement by Environment and Resources Authority (ERA) on Air CC-036 Construction dust 'a nuisance, not a health issue' (not yet checked)
- 2018 Evidence published Grange et al. (2018), Random forest meteorological normalisation models for Swiss PM10 trend analysis, Atmospheric Chemistry and Physics 18:6223-6239, Copernicus
2021
2023
2024
2025
- January 2025 Statement published Air Quality Plan for Malta (approved policy), ERA
- 12 March 2025 The statement Environment and Resources Authority (ERA) (this claim)
- 2025 Statement published Air Quality Plan for Malta 2025, ERA
- 15 August 2025 Statement published Air Quality Plan for Malta 2025 (web page, Wayback capture of 15 Aug 2025), ERA
2026
- 3 February 2026 Evidence published AQD_REP_MT_ERA_D-001_2025: Air Quality e-Reporting dataset D (measurement configuration), Environment and Resources Authority (via Eionet CDR)
- 2026 Evidence published Eibinger and Fernando (2026), Zero fare, cleaner air? The causal effect of Luxembourg's free public transportation policy on transport emissions, Environmental and Resource Economics 89:45, Springer
- 4 October 2026 Added to the claims to check
- 6 October 2026 Check started Check started in the maintainer session. EEA download service queried for every Maltese sampling point (PM10, PM2.5, NO2, SO2, CO; AirBase, E1a, E2a: 85 files); ERA's attainment reports (dataflow G) 2015-2025 downloaded from the Eionet CDR; Eurostat env_air_emis and road_eqs_carpda retrieved; literature searched in Crossref (OpenAlex rate-limited).
- 6 October 2026 Exact wording found Verbatim wording read in full from the ERA page (Wayback capture of 15 Aug 2025; page metadata datePublished 12 Mar 2025) and the plan's executive summary (p. 3), using the copies saved through the Wayback Machine on 5 Oct 2026 (SHA-256 of the PDF matches primary-source.md); the archive was unreachable on 6 Oct. The claim record combines the two documents.
- 6 October 2026 Note Findings (figures as revised in the review fixes below): power-station SOx -99.8% and NOx -90% (2014-2018; -99.9% and -95% from 2008), SO2 in the air -83% at Żejtun; Msida NO2 -22% and PM2.5 -17% (2015-17 to 2021-23), PM10 flat; ERA's own counts after natural deduction 41 days (2018) and 52 (2023), the most of 2015-2023 at the old Msida point; the plan's school-transport NO2 fall does not reproduce; 10 of 11 station readings higher in the year after free public transport began. CC-007 and CC-008 data reused for station metadata; CC-033 and CC-038 have no data on this branch.
- 6 October 2026 Note Review fixes before release (independent review, 15 findings). Added a test of the hour labels of the plan's Figure 26 against the EEA hourly profiles (clock check, peak hours, fits under two labellings; calc.py section G, digitise_fig26.py): the plan's 2018-19 curves reproduce only with hour-ending labels, its 2014-17 baseline under neither. Stated the plan pages read (3, 21-67, 91, 95) and skimmed (4-20, 68-90, 96-104) and logged the skim. Re-based sub-claim A (2014 baseline; Kordin and Żejtun baselines and coverage flagged; ships' fuel-sulphur cap noted). Qualified 'highest of 2015-2023 at the old Msida point' (ERA's 2024-25 counts are zone counts from other stations). Added the sustained 2013-17 to 2019-23 fall, morning-hour coverage and the CO window, the NO2 2022-23 sensitivity, construction PM10 and the Msida Creek works. PM10 day counts now use unrounded daily values (2020: 37). Stated which wording is rated and why not Largely supported. Layout: figure notes moved into captions and the report cut to 10 pages (Figure 5 dropped; its numbers stay in the text).
- 6 October 2026 Version 1.0: first issue First issue. Draft verdict Not substantiated (moderate); pending right of reply from the Environment and Resources Authority. Verdict in this version: Not substantiated, moderate confidence.
- 6 October 2026 Evidence reviewed
2027
- 6 October 2027 Coming up: Evidence review due Each finished check is reviewed against new evidence within a year.
Every change to this claim's record is public: history of the record.
Download the report and flyer