CC-040 · Water · Water supply & groundwater
Low water use per head
Largely supported Moderate confidence Draft: no right of reply needed
Parts of this claim
The claim is split into parts that are tested separately, as in the report below. Each part has its own number.
- CC-040A “Per capita water consumption, today stands at around 110l/cap/day”Eurostat households: 116 (2022), 120 (2024), estimates [2][3]. Within about 9%; definition of the 110 not stated.
- CC-040B Consumption has been kept “low”No benchmark in the deck. Malta ranks 13th of 19 EU states, 8% above the median [2].
- CC-040C Tariffs and engagement “contributed” to this; a “90 litres” higher-tariff thresholdA causal claim with no evidence in the deck; the WSC tariff schedule was not obtained.
- CC-040D “Relatively low compared with other European countries” (intake wording)Not in the speaker’s words; headline wording, not rated. For reference, Malta is mid-table [2].
Claim Check 040 · Water
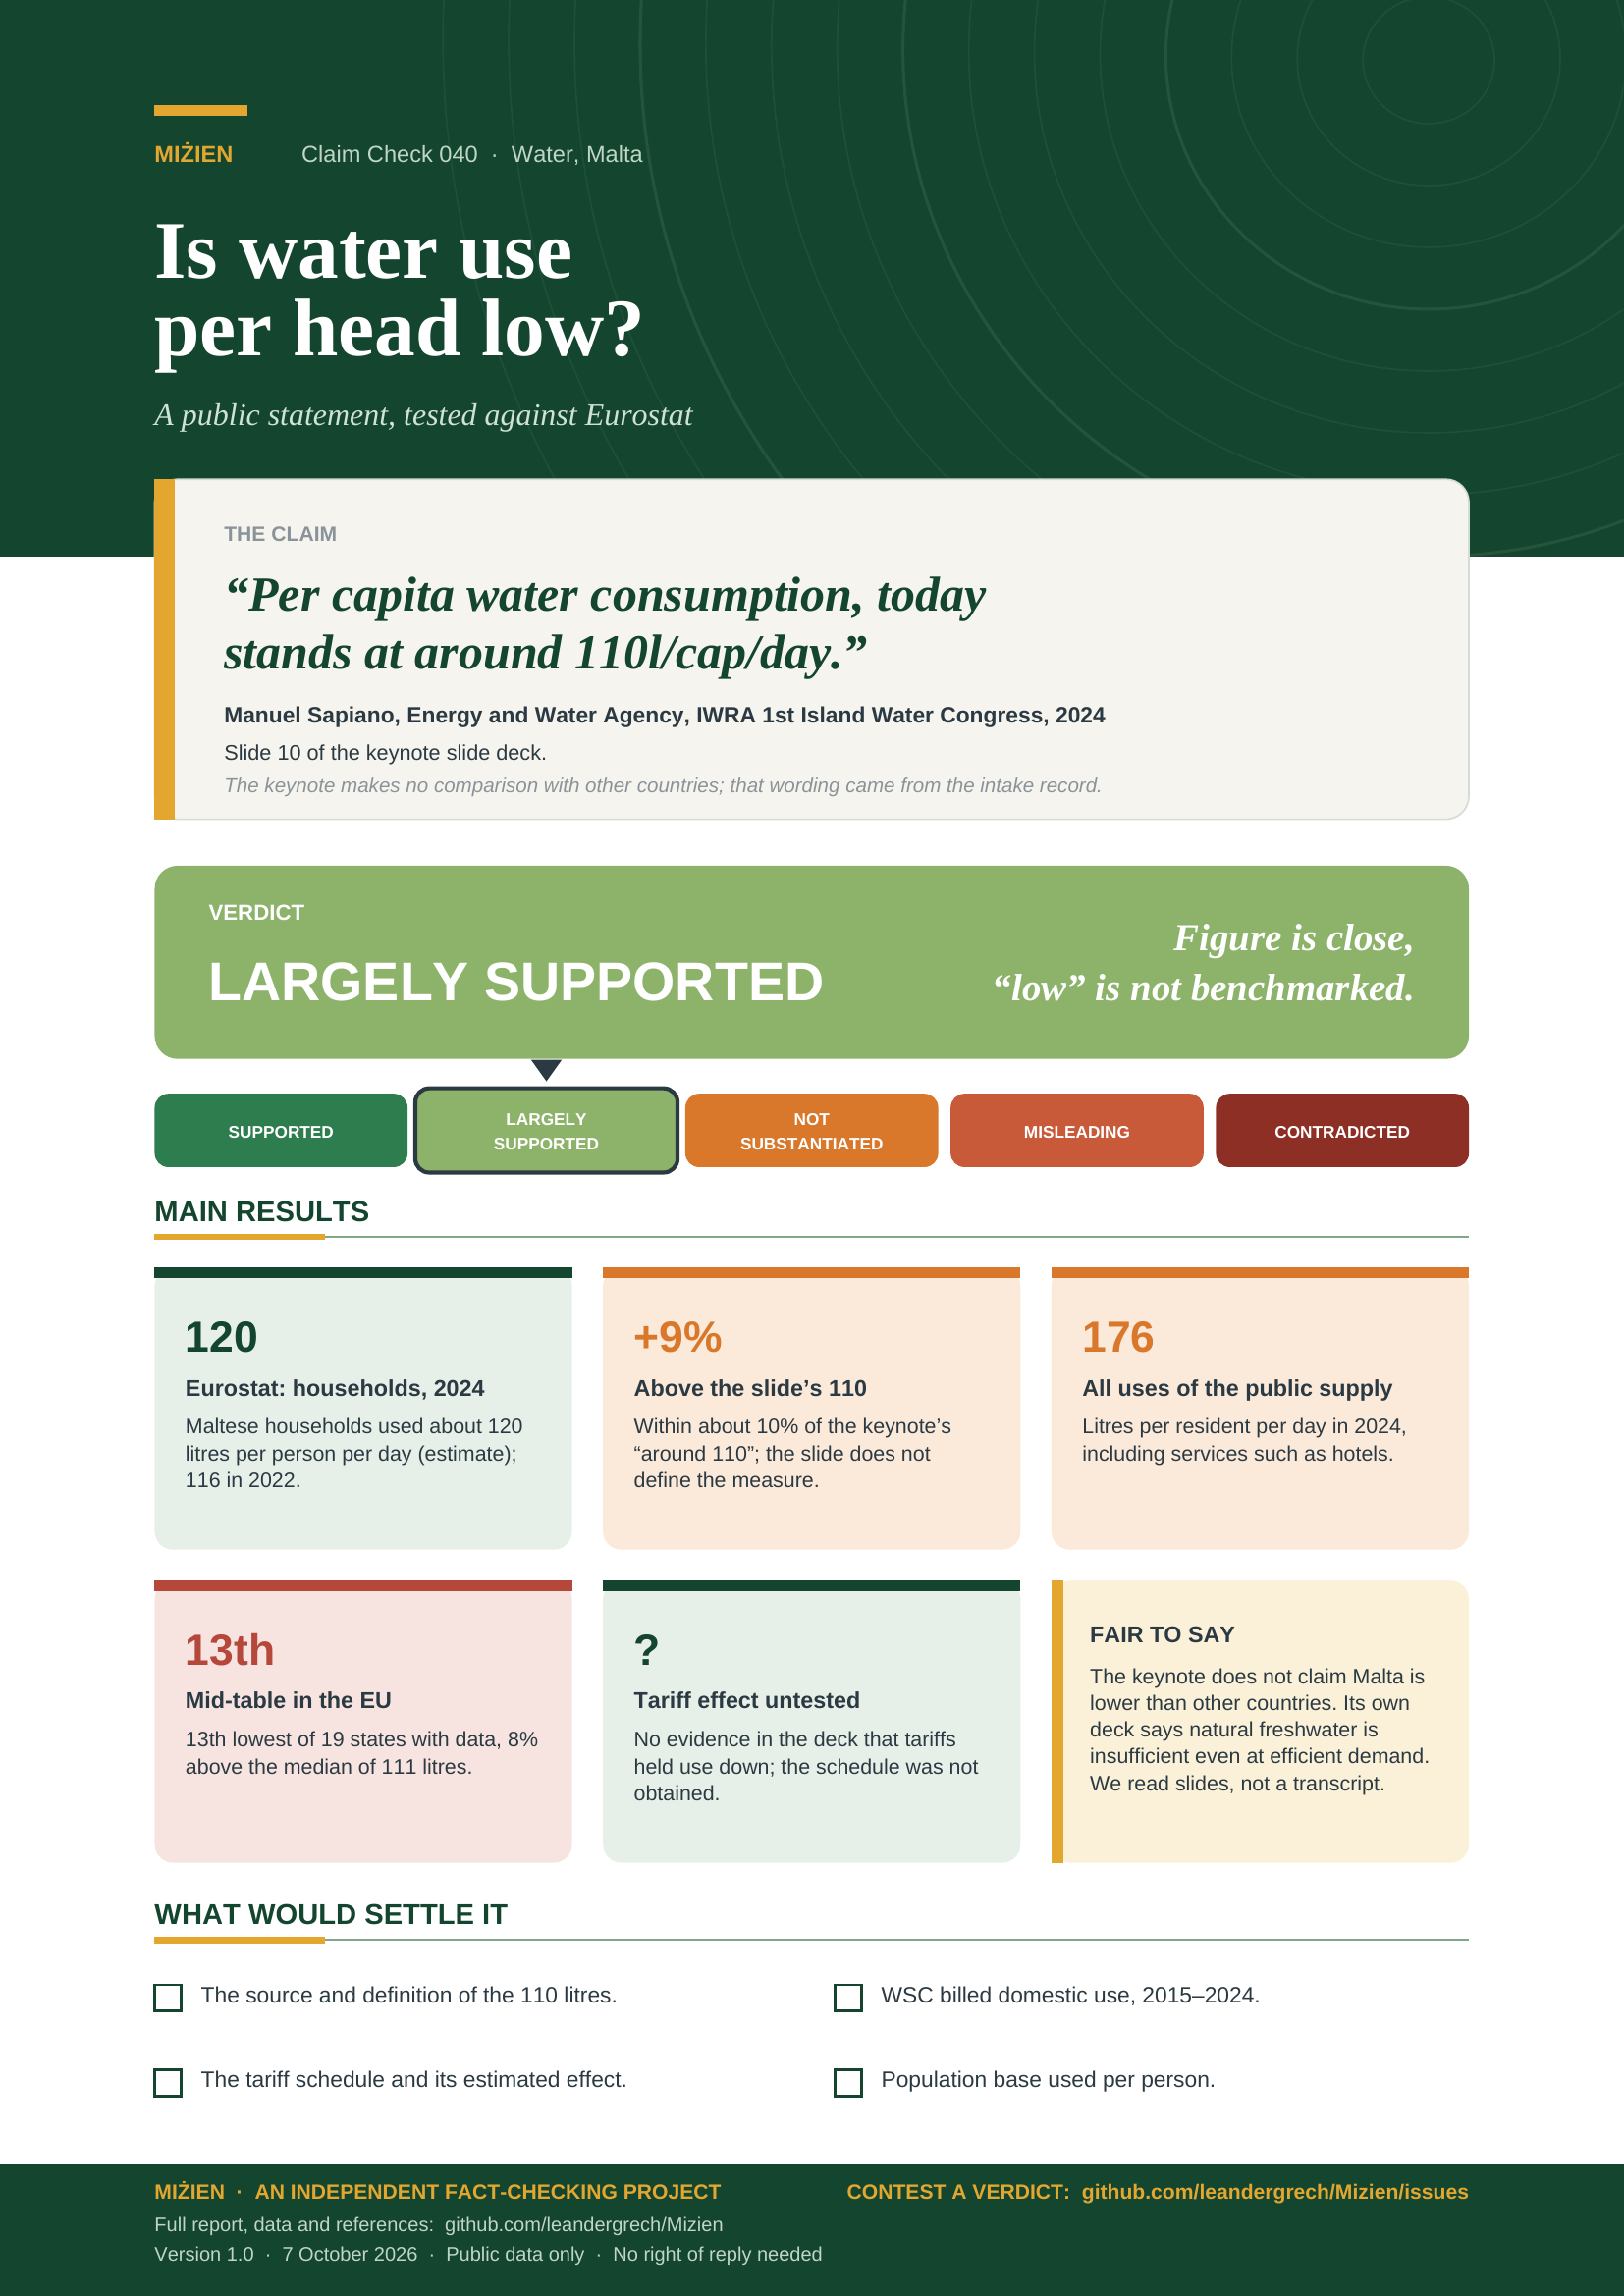
Is water use per head low?
Testing a public claim about Malta’s per-person water use against Eurostat’s household series
“Per capita water consumption, today stands at around 110l/cap/day.”
Manuel Sapiano, Energy and Water Agency, keynote slide, IWRA 1st Island Water Congress, 2024.
On a slide about keeping per-person consumption “low”.
Verdict: Largely supported The figure is close; “low” is not benchmarked
Version 1.0 · 7 October 2026
TL;DR
In a keynote to the 1st Island Water Congress (IWRA, 2024), Manuel Sapiano of the Energy and Water Agency showed a slide saying: “Per capita water consumption, today stands at around 110l/cap/day.” The previous slide says tariffs and engagement have “contributed to maintaining the per capita water consumption low”. We tested the figure against Eurostat’s household water-use series. It is close, but Eurostat’s estimate for Maltese households is higher, and Malta sits mid-table among the EU states that report. The keynote does not compare Malta with other countries; that framing came from the intake record, not from the speaker.
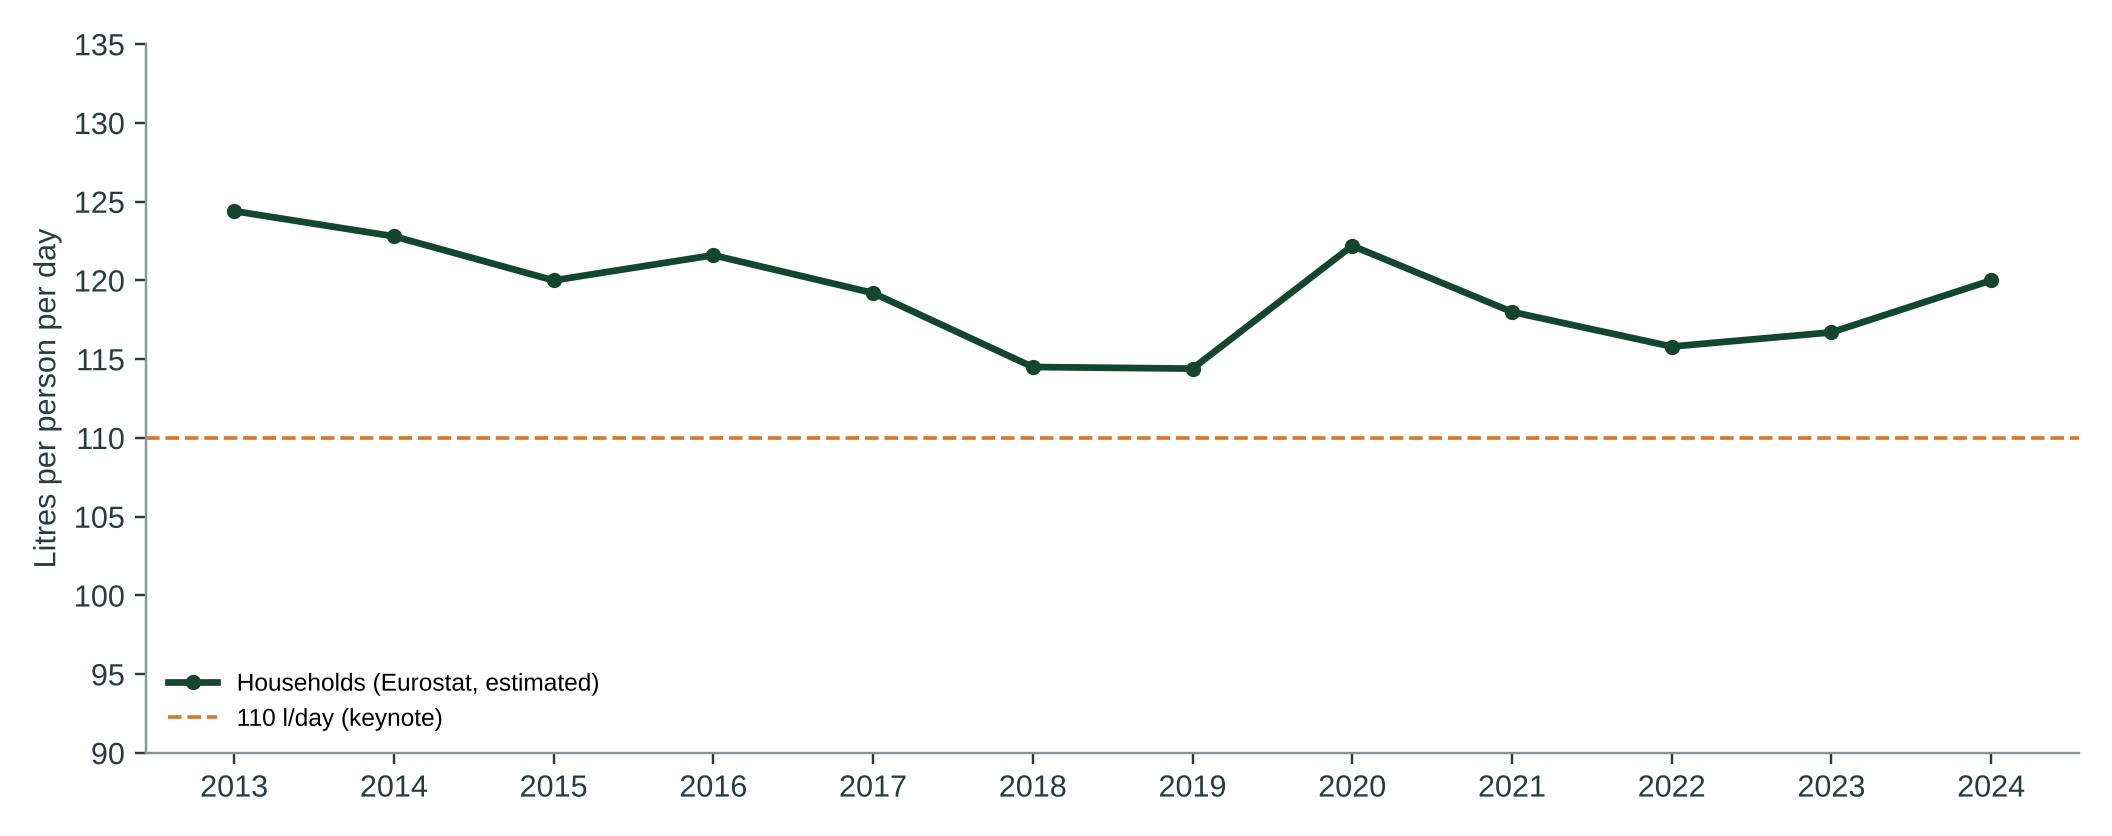
- The figure is about right. Eurostat puts Maltese households’ use of public water at 116–120 litres per person per day in 2022–2024 (an estimate, 9% above 110 in 2024), against “around 110” in the keynote.
- It covers households only. All uses of the public supply, including services such as hotels, come to about 169–176 litres per head per day on the same basis, because the supply also serves tourists, shops and industry.
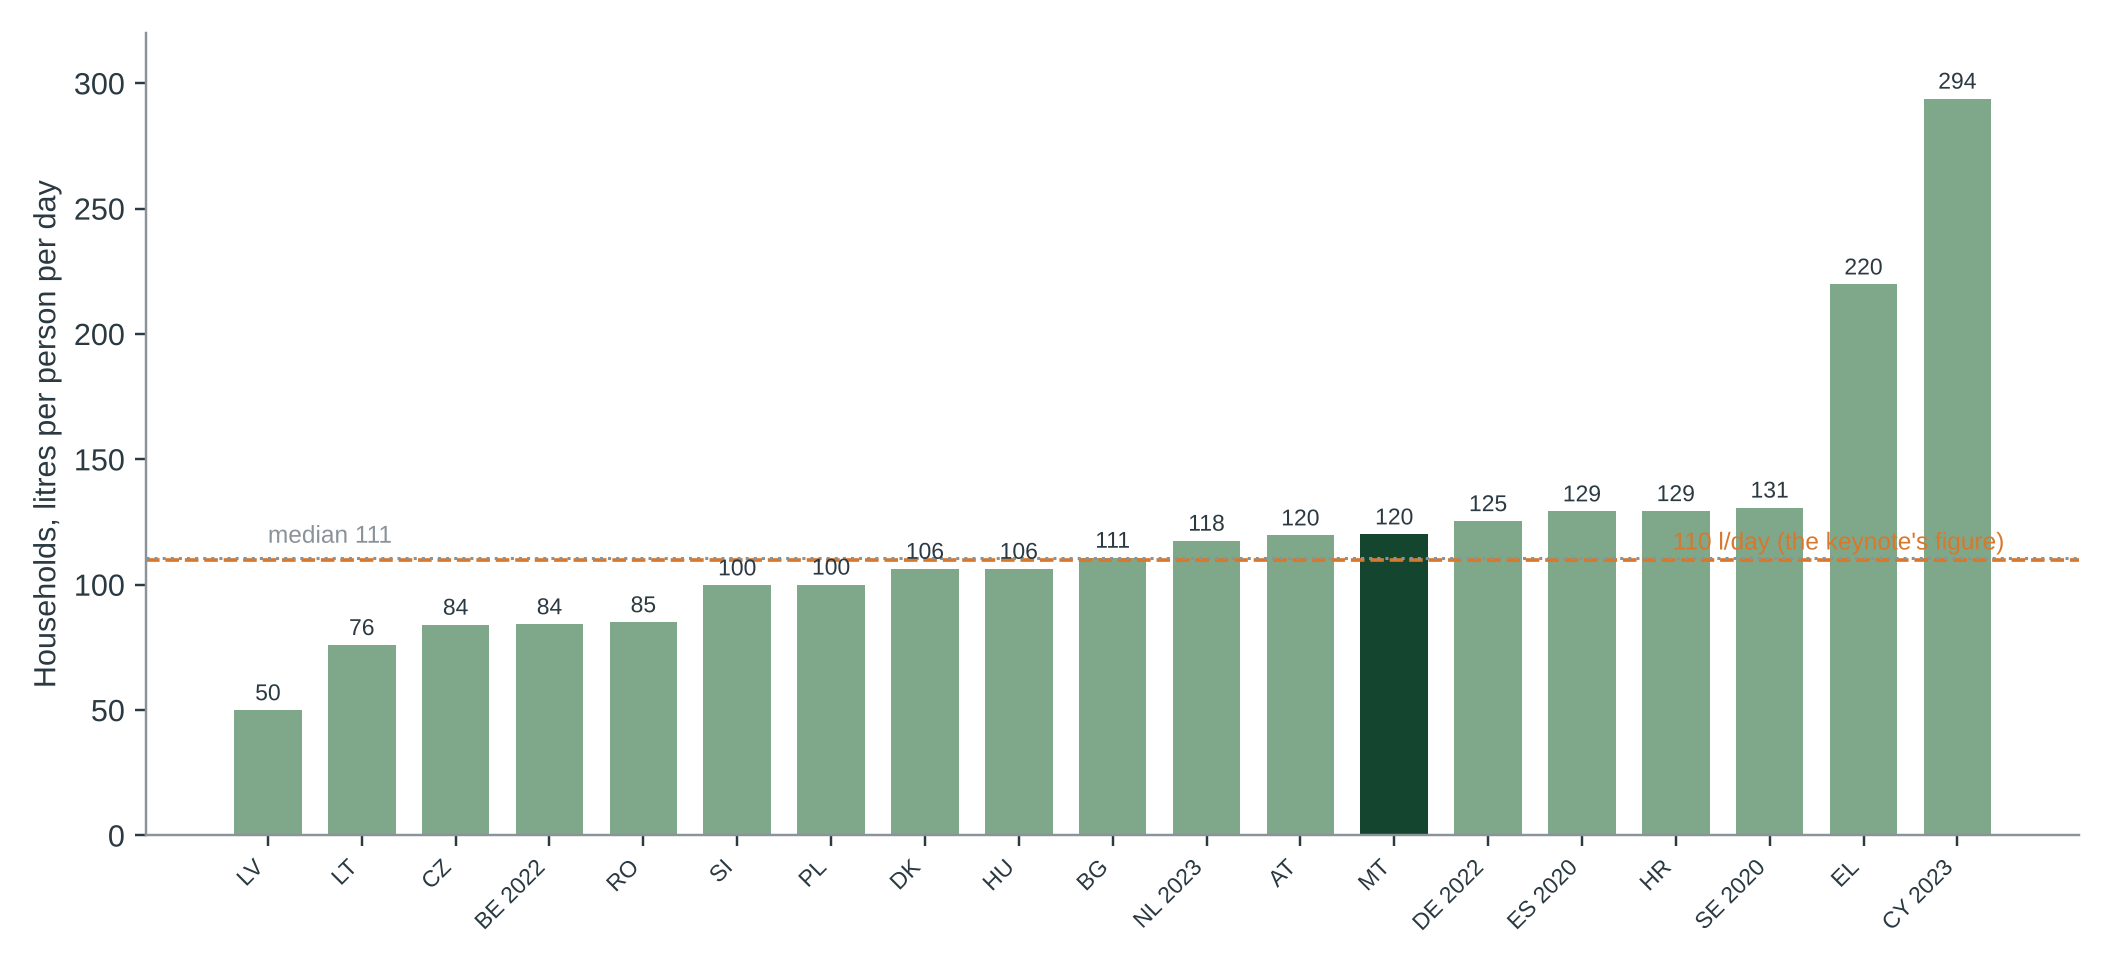
- “Low” is not shown by this comparison. Among the 19 EU states with a recent household figure, Malta ranks 13th from the lowest, 8% above the median (111 l). The speaker made no EU comparison, so this does not contradict the keynote.
- The tariff effect is untested. We found no evidence on how much the rising block tariff changed use; we did not obtain the tariff schedule.
- Verdict: largely supported (moderate confidence). The central figure agrees with Eurostat within about 10%. “Low” is a qualitative word that the keynote does not benchmark.
- Supported
- Largely supported
- Not substantiated
- Misleading
- Contradicted
What would move the verdict up
Nothing: Largely supported leaves room only for the caveats below, which are about definitions and the unquantified word “low”. (Supported is the top of the scale.)
What would move it down
A WSC billed-consumption series showing domestic use clearly above Eurostat’s 116–120 litres, or the speaker confirming that “low” was meant against other countries (the data show Malta mid-table).
IN THIS REPORT
1 The claim and what we could verify
The primary source is the slide deck of the keynote “Water Management in the Maltese Islands” by Manuel Sapiano, Energy and Water Agency, at the IWRA 1st Island Water Congress, 2024 [1]. We downloaded and read all 27 slides (the file is dated 15 October 2024). It is a slide deck, not a transcript: we cannot see what was said aloud. The wording we rate is on slide 10.
| What the slide says | Who | Access |
|---|---|---|
| “Tariffs and a continuous engagement programme have contributed to maintaining the per capita water consumption low, and in the region of the 90 litres per person per day higher tariff threshold.” | E&WA keynote, slide 10 [1] | Read in full |
| “Per capita water consumption, today stands at around 110l/cap/day.” | E&WA keynote, slide 10 [1] | Read in full |
2 Method
Question. Is Maltese per-person water use about 110 litres a day, and is it low?
Evidence. Eurostat env_wat_cat (water use by supply category and sector, OECD/Eurostat Joint Questionnaire on Inland Waters; public water supply, households) and demo_pjan (population on 1 January) [2][3], retrieved 7 October 2026. Per-person use = households’ volume divided by the mean of the 1 January population of that year and the next, converted to litres per day. Every Maltese value is flagged as estimated by Eurostat. The calculation is tools/cc-040-report/calc.py; inputs and results are in data/cc-040/.
Grades. Official statistics are grade C; the speaker’s slide is grade D (an assertion without method or source). Verdicts follow the five-point scale in Appendix A.
3 What the data show
| Indicator (Malta, public water supply) | 2019 | 2022 | 2024 | Grade |
|---|---|---|---|---|
| Households, litres per person per day | 114 | 116 | 120 | C |
| Services (incl. hotels), litres per head of resident population | 42 | 39 | 40 | C |
| All uses, litres per head of resident population | 173 | 169 | 176 | C |
| Households vs the keynote’s 110 | +4% | +5% | +9% | C |
Values in data/cc-040/checks.csv. “All uses” divides all sectors’ use of the public supply by the resident population; it includes use by tourists and businesses, so it is not a per-resident consumption figure.
Malta among EU states
Eurostat has a recent household figure for 19 of the 27 Member States (Estonia, Finland, France, Ireland, Italy, Luxembourg, Portugal and Slovakia have none from 2020 on). Taking each state’s latest year (2020–2024; Spain and Sweden 2020, Belgium and Germany 2022), Malta’s 120 litres ranks 13th from the lowest and is 8% above the median of 111 litres (Figure 2). Latvia, Lithuania, Czechia, Belgium and Romania are below 90; Greece (220) and Cyprus (294) are far higher [2].
4 Where the evidence points different ways
Q1 Is consumption “around 110 litres”?
CLOSEEVIDENCE FOR THE CLAIM'S IMPRESSION
Eurostat’s household series (116 in 2022, 120 in 2024) is within about 5–9% of 110; “around” covers that, and the series was 114 in 2018–2019. The speaker’s figure may be billed domestic consumption, which we have not seen.
EVIDENCE AGAINST
Every Maltese Eurostat value is an estimate, and the 2024 value is the highest since 2020. We did not obtain WSC billing data, so we cannot say which definition 110 follows.
Q2 Is it “low”?
NOT SHOWNEVIDENCE FOR THE CLAIM'S IMPRESSION
On the keynote’s own terms the claim is about holding use down while the population and economy grew (slide 9). We did not test that history: the slide’s 350 litres in 1995 is production capacity per head, not consumption, so it is not comparable.
EVIDENCE AGAINST
Against other EU states Malta is mid-table (13th of 19; 8% above the median). Total supply per resident, 176 litres, includes use by services and tourists.
5 Testing the claim
| Sub-claim | What the evidence shows | Rating |
|---|---|---|
| A. “Per capita water consumption, today stands at around 110l/cap/day” | Eurostat households: 116 (2022), 120 (2024), estimates [2][3]. Within about 9%; definition of the 110 not stated. | LARGELY SUPPORTED |
| B. Consumption has been kept “low” | No benchmark in the deck. Malta ranks 13th of 19 EU states, 8% above the median [2]. | NOT SHOWN |
| C. Tariffs and engagement “contributed” to this; a “90 litres” higher-tariff threshold | A causal claim with no evidence in the deck; the WSC tariff schedule was not obtained. | NOT TESTED |
| D. “Relatively low compared with other European countries” (intake wording) | Not in the speaker’s words; headline wording, not rated. For reference, Malta is mid-table [2]. | NOT RATED |
6 Verdict and requests for evidence
The figure is about right for households; “low” is unquantified. Confidence: moderate.
Why. (1) The headline number, 110 litres, is within about 9% of Eurostat’s household figure for 2024 and 5% for 2022. (2) The keynote gives no benchmark for “low” and no source for the 110, and the tariff effect is not evidenced, so we rate them as not shown rather than false. (3) The EU comparison in the claim record is not the speaker’s statement; we report it (Malta is mid-table) without rating it. Our scale calls backing with caveats that do not change the substance Largely supported.
What this verdict does not say. It does not say that Malta’s water use is low by European standards or that its water supply is sustainable. The keynote itself says natural freshwater is insufficient even at highly efficient demand (slide 3).
Evidence we are asking for
- The source and definition of the 110 litres figure (billed domestic, per resident, year).
- WSC domestic billed consumption and the resident population used, 2015–2024.
- The rising block tariff schedule and any estimate of its effect on use.
7 Limitations
- We read slides only: any spoken qualification is not in the deck.
- Eurostat’s Maltese values are estimates; its metadata page for the dataset family (env_nwat_esms) refers to the Joint Questionnaire definitions, which we did not read in full.
- Eurostat’s per-person figure uses our population denominator (mean of two 1 January populations); WSC may use another.
- EU comparison covers 19 states with different years (2020–2024); countries differ in how they measure household use. Greece and Cyprus are very high, so we use the median.
- We did not search WSC or NSO publications for a 110 litres series; none was found through Eurostat or in our web search of 7 October 2026 (see literature/CC-040/notes.md).
References
- [1] Sapiano M. (2024). Water Management in the Maltese Islands. Keynote, IWRA 1st Island Water Congress. Energy and Water Agency (slide deck, 27 slides). https://www.iwra.org/proceedings/congress/resource/IWRA2024_1stIslandWC_0609_HLP_EuroInbo_MSapiano_Keynote.pdf
- [2] Eurostat. env_wat_cat, Water use by supply category and economical sector (public water supply, households; status flags checked); retrieved 7 Oct 2026. https://doi.org/10.2908/ENV_WAT_CAT
- [3] Eurostat. demo_pjan, Population on 1 January by age and sex; retrieved 7 Oct 2026. https://doi.org/10.2908/DEMO_PJAN
- [4] Eurostat. Environment and water statistics, explanatory texts (env_nwat_esms). https://ec.europa.eu/eurostat/cache/metadata/en/env_nwat_esms.htm
- [5] MiŻien. Data and calculations: data/cc-040/; tools/cc-040-report/calc.py.
Appendix A: series standards and verdict scale
Every investigation in this series follows the same rules so that verdicts are comparable and challengeable.
| Verdict | Meaning |
|---|---|
| SUPPORTED | Evidence consistently backs the claim as stated. |
| LARGELY SUPPORTED | Backed by the evidence, with minor caveats that do not change the substance. |
| NOT SUBSTANTIATED | Stated more strongly than the evidence offered or available allows. May be true in some conditions but has not been shown. |
| MISLEADING | Omits material facts so that the overall impression is inaccurate, even if individual statements are defensible. |
| CONTRADICTED | The available evidence points against the claim. |
Confidence
High: multiple independent lines of evidence agree. Moderate: evidence is relevant but incomplete or indirect. Low: evidence is thin, second-hand or conflicting.
Evidence grades
A experiment · B observational study with a control or gradient · C review, guidance or official statistics · D assertion or anecdote. ◆ marks a source known only second-hand.
Standards
- Quote the speaker, not the headline, with outlet and date, and link the original where possible.
- Separate the claim from the evidence offered for it, and say who made which statement.
- Grade the evidence and show differing views side by side where the evidence is unsettled.
- State what we could not access or verify, and what would change the verdict either way.
- Ask for the missing evidence in specific, answerable requests.
- Offer a right of reply where a check finds a claim Not substantiated, Misleading or Contradicted (or a pledge Not measurable, Off track or Missed), before wider circulation, and append responses.
- Correct errors openly with a version number and change log.
- Whistle-blow only on evidence: a verdict of Misleading or Contradicted requires documents or data that can be shown, not inference.
- Check every side. Government, opposition, NGOs and developers are held to the same standard.
Appendix B: revision log
| Version | Date | Change |
|---|---|---|
| 1.0 | 7 Oct 2026 | First issue. No right of reply needed. |
Sources and archived copies
-
Water Management in the Maltese Islands (IWRA keynote slide deck), Energy and Water Agency, 2024.
Original · Archived copy
Primary. All 27 slides read 7 Oct 2026; wording on slide 10. Slides, not a transcript. -
Water use by supply category and economical sector (env_wat_cat), Eurostat, 2026.
Original · fetched and fingerprinted 2026-10-10; no public snapshot yet
Households, public water supply; Malta values flagged estimated. Retrieved 7 Oct 2026.
Right of reply
Not needed: this check finds the claim supported. A right of reply is sought when a check finds a claim Not substantiated, Misleading or Contradicted.
Connections
How this claim relates to the others: who made it, the themes it shares with other claims, and the patterns it shows. A connection is a reason to read two checks side by side. It does not make either one right or wrong. How connections are found.
Linked directly 0
Not yet linked to another claim by a theme.
Timeline
What was said, what was published before and after it, and each step of this check, in date order. Statements and sources carry the date they were published. The steps of the check carry the date the research was done, from the check's research log. Other statements by the same body on the same topic show whether a position was repeated, changed or corrected.
2023
- November 2023 Earlier statement by Energy and Water Agency on Water CC-108 Net-zero impact on the groundwater environment (pledge: Not measurable)
2024
- 2024 The statement Energy and Water Agency (Manuel Sapiano) (this claim)
- 2024 Statement published Water Management in the Maltese Islands (IWRA keynote), Energy and Water Agency
2026
- 4 October 2026 Added to the claims to check
- 7 October 2026 Check started Worker A run. Keynote slide deck read; Eurostat household water use tested.
- 7 October 2026 Exact wording found Verbatim wording on slide 10 of the E&WA keynote deck; no EU comparison in the deck.
- 7 October 2026 Version 1.0: first issue First issue. No right of reply needed. Verdict in this version: Largely supported, moderate confidence.
- 7 October 2026 Evidence reviewed
2027
- 7 October 2027 Coming up: Evidence review due Each finished check is reviewed against new evidence within a year.
Every change to this claim's record is public: history of the record.
Download the report and flyer